Abstract
AbstractAll amyloid fibrils contain a cross-β fold. How this structure differs in fibrils formed from proteins associated with different diseases remains unclear. Here, we combine cryo-EM and MAS-NMR to determine the structure of an amyloid fibril formed in vitro from β2-microglobulin (β2m), the culprit protein of dialysis-related amyloidosis. The fibril is composed of two identical protofilaments assembled from subunits that do not share β2m’s native tertiary fold, but are formed from similar β-strands. The fibrils share motifs with other amyloid fibrils, but also contain unique features including π-stacking interactions perpendicular to the fibril axis and an intramolecular disulfide that stabilises the subunit fold. We also describe a structural model for a second fibril morphology and show that it is built from the same subunit fold. The results provide insights into the mechanisms of fibril formation and the commonalities and differences within the amyloid fold in different protein sequences.
🔬 Techniques
🔭 Microscopes
🧬 Organisms
💻 Software
🧪 Sample Preparation
🔬 Cell Lines
🏭 Microscope Brands
🧪 Reagent Suppliers
💻 Software Details
💻 Code & Software
💾 Data Repositories
🏛️ Research Organizations (ROR)
Affiliated research institutions:
📋 Methods
Preparation of β 2 m fibrils β 2 m was recombinantly-expressed in Escherichia coli . Samples for cryo-EM were grown in LB medium 38 , while isotopically labelled samples used for MAS-NMR were grown in M9 or HCDM1 medium with a single carbon and nitrogen source. All MAS-NMR samples used for this study were uniformly 15 N labelled using 15 NH 4 Cl (Cambridge Isotope Laboratory (CIL)). A total of 5 samples were generated using different carbon sources: (1) [u- 13 C, u- 15 N]-β 2 m using [ 13 C 6 ]-glucose, (2) [1,6- 13 C 2 , u- 15 N]-β 2 m using [1,6- 13 C 2 ]-glucose, (3) [1,3- 13 C 2 , u- 15 N]-β 2 m using [1,3- 13 C 2 ]-glycerol, (4) [2- 13 C 1 , u- 15 N]-β 2 m using [2- 13 C 1 ]-glycerol, and (5) [ 13 C-VYL, u- 15 N]-β 2 m using [ 13 C, 15 N]-VYL. Fibrils for cryo-EM were formed by dissolving purified, monomeric β 2 m in buffer containing 25 mM sodium phosphate, 25 mM sodium acetate pH 2.5, and 0.03% (w/v) NaN 3 at 0.25 mg/mL (21 µM) β 2 m and incubating quiescently for 5 weeks at 37 °C. For MAS-NMR, de novo wild-type β 2 m fibrils were generated by re-suspending lyophilised protein in 25 mM sodium phosphate, 25 mM sodium acetate buffer at pH 2.5, containing 50 mM NaCl, 0.02 % (w/v) NaN 3 at a concentration of 83 μΜ. Several samples of 1 mL were incubated each in 2 mL Eppendorf tubes at 37 °C with 200 rpm orbital shaking for 14 days. The samples were collated and transferred to a single tube and fibrils then pelleted by 30 min centrifugation at 14,000 g using a bench-top centrifuge. Control experiments using MAS-NMR showed that identical spectra were obtained when fibrils were grown in the presence of 50 mM NaCl. The long, straight morphology of each fibril preparation was confirmed using EM and/or AFM. MAS-NMR experiments Isotopically labelled samples were individually packed into a 3.2 mm Bruker rotor (Bruker BioSpin, Billerica, MA) using a home-built centrifugal packing tool. Typically, ∼30 mg of hydrated β 2 m fibrils were needed for a fully packed rotor. Chemical shift assignment 13 C and 15 N chemical shifts of the resonances arising from residues in the fibril core of β 2 m were assigned using multi-dimensional assignment spectra conducive to backbone sequential walks as previously published 53 . Briefly, a set of 3D NCACX, 3D NCOCX, and 3D CONCA spectra were acquired on a Cambridge Instruments 750 MHz spectrometer operating under RNMR (courtesy of Dr. David Ruben). The spectra were recorded at ω r /2 π = 12.5 kHz and regulated to ±10 Hz using a Bruker MAS I spinning frequency controller. DARR mixing was used for the 3D NCACX ( τ mix = 60 ms) and 3D NCOCX ( τ mix = 80 ms). Additionally, 3D NNC α experiments were acquired on Bruker 800 and 900 MHz AVANCE III spectrometers equipped with a 3.2 mm triple channel HCN Bruker probe (Bruker Biospin, Billerica, MA). Spectra were recorded at ω r /2 π = 20 kHz and regulated to ±10 Hz using a Bruker MAS II spinning frequency controller. The 15 ms 15 N– 15 N PAR mixing used radio frequency (RF) fields of ω 1H /2 π = 55.4 kHz and ω 15N /2 π = 32.2 kHz. Spectra recorded at ω 0H /2 π = 750 MHz were processed with the NMRPipe software package, while spectra recorded at ω 0H /2 π = 800 and 900 MHz were processed using TopSpin 3.2. All spectra were analysed in Sparky. 13 C and 15 N chemical shifts were referenced using the published shifts of adamantine relative to DSS for 13 C referencing and the IUPAC relative frequency ratios between DSS ( 13 C) and liquid ammonia ( 15 N). A list of acquisition and processing parameters with additional references can be found in Supplementary Tables 10 & 11 . All experiments were conducted at 268 K.
Show full methods section
Preparation of β 2 m fibrils β 2 m was recombinantly-expressed in Escherichia coli . Samples for cryo-EM were grown in LB medium 38 , while isotopically labelled samples used for MAS-NMR were grown in M9 or HCDM1 medium with a single carbon and nitrogen source. All MAS-NMR samples used for this study were uniformly 15 N labelled using 15 NH 4 Cl (Cambridge Isotope Laboratory (CIL)). A total of 5 samples were generated using different carbon sources: (1) [u- 13 C, u- 15 N]-β 2 m using [ 13 C 6 ]-glucose, (2) [1,6- 13 C 2 , u- 15 N]-β 2 m using [1,6- 13 C 2 ]-glucose, (3) [1,3- 13 C 2 , u- 15 N]-β 2 m using [1,3- 13 C 2 ]-glycerol, (4) [2- 13 C 1 , u- 15 N]-β 2 m using [2- 13 C 1 ]-glycerol, and (5) [ 13 C-VYL, u- 15 N]-β 2 m using [ 13 C, 15 N]-VYL. Fibrils for cryo-EM were formed by dissolving purified, monomeric β 2 m in buffer containing 25 mM sodium phosphate, 25 mM sodium acetate pH 2.5, and 0.03% (w/v) NaN 3 at 0.25 mg/mL (21 µM) β 2 m and incubating quiescently for 5 weeks at 37 °C. For MAS-NMR, de novo wild-type β 2 m fibrils were generated by re-suspending lyophilised protein in 25 mM sodium phosphate, 25 mM sodium acetate buffer at pH 2.5, containing 50 mM NaCl, 0.02 % (w/v) NaN 3 at a concentration of 83 μΜ. Several samples of 1 mL were incubated each in 2 mL Eppendorf tubes at 37 °C with 200 rpm orbital shaking for 14 days. The samples were collated and transferred to a single tube and fibrils then pelleted by 30 min centrifugation at 14,000 g using a bench-top centrifuge. Control experiments using MAS-NMR showed that identical spectra were obtained when fibrils were grown in the presence of 50 mM NaCl. The long, straight morphology of each fibril preparation was confirmed using EM and/or AFM. MAS-NMR experiments Isotopically labelled samples were individually packed into a 3.2 mm Bruker rotor (Bruker BioSpin, Billerica, MA) using a home-built centrifugal packing tool. Typically, ∼30 mg of hydrated β 2 m fibrils were needed for a fully packed rotor. Chemical shift assignment 13 C and 15 N chemical shifts of the resonances arising from residues in the fibril core of β 2 m were assigned using multi-dimensional assignment spectra conducive to backbone sequential walks as previously published 53 . Briefly, a set of 3D NCACX, 3D NCOCX, and 3D CONCA spectra were acquired on a Cambridge Instruments 750 MHz spectrometer operating under RNMR (courtesy of Dr. David Ruben). The spectra were recorded at ω r /2 π = 12.5 kHz and regulated to ±10 Hz using a Bruker MAS I spinning frequency controller. DARR mixing was used for the 3D NCACX ( τ mix = 60 ms) and 3D NCOCX ( τ mix = 80 ms). Additionally, 3D NNC α experiments were acquired on Bruker 800 and 900 MHz AVANCE III spectrometers equipped with a 3.2 mm triple channel HCN Bruker probe (Bruker Biospin, Billerica, MA). Spectra were recorded at ω r /2 π = 20 kHz and regulated to ±10 Hz using a Bruker MAS II spinning frequency controller. The 15 ms 15 N– 15 N PAR mixing used radio frequency (RF) fields of ω 1H /2 π = 55.4 kHz and ω 15N /2 π = 32.2 kHz. Spectra recorded at ω 0H /2 π = 750 MHz were processed with the NMRPipe software package, while spectra recorded at ω 0H /2 π = 800 and 900 MHz were processed using TopSpin 3.2. All spectra were analysed in Sparky. 13 C and 15 N chemical shifts were referenced using the published shifts of adamantine relative to DSS for 13 C referencing and the IUPAC relative frequency ratios between DSS ( 13 C) and liquid ammonia ( 15 N). A list of acquisition and processing parameters with additional references can be found in Supplementary Tables 10 & 11 . All experiments were conducted at 268 K.
Distance constraints from MAS-NMR spectroscopy
A total of 1157 contacts were observed, of which 399 were classified as intra-residue, 385 as sequential, 229 as medium-range, and 144 as long-range contacts. These contacts were extracted from a total of 19 2D 13 C– 13 C and 13 C– 15 N correlations. We recorded 13 C– 13 C-PDSD, 13 C– 13 C-PAR, 13 C– 13 C-RFDR, and 13 C– 15 N-PAIN spectra on almost all isotopically labelled samples. A full list of acquisition and processing parameters with additional references can be found in Supplementary Tables 10 , 11 . Cryo-EM grid preparation β 2 m fibrils were diluted 1:10 with fibril buffer to a final concentration of 0.025 mg/mL (2.1 µM) monomer equivalent concentration. A 300 mesh copper EM grid with Quantifoil R3.5/1 carbon film (Electron Microscopy Services) was glow discharged in a Cressington 208 carbon evaporator fitted with a glow discharge unit for 1 min at 10 mA power. Four microlitres of the sample was applied to the grid, which was then blotted with Whatman #40 filter paper and plunge-frozen in liquid ethane using an EM-GP plunge freezer (Leica).
EM data collection
EM images were collected using a Titan Krios (ThermoFisher) electron microscope operating at 300 keV and recorded on an energy filtered K2 direct detector (Gatan) with a pixel size of 1.06 Å/pixel. 5549 micrographs were recorded in two sets with total electron doses of 42.3 and 35.8 e − /Å 2 . The dose was fractionated into 40 frames for per frame doses of 1.05 and 0.89 e − /Å 2 respectively. Of the 5549 micrographs collected, 2012 (~36%) contain fibrils. Data processing Frames 3–40 of each micrograph movie were motion-corrected, dose weighted 67 , and merged using motioncor2 68 . The contrast transfer function (CTF) for each micrograph was determined using gCTF 69 on motion-corrected, but non-dose weighted, micrographs.
Helical reconstruction
All reconstruction was performed using Relion2.1 40 . As the micrographs contained multiple fibril morphologies, fibrils with a similar gross morphology were first selected by eye. The selected fibrils were segmented into 300 × 300 pixel boxes overlapping by 90% (270 px). One round of 2D classification was performed; only class averages showing an obvious β-sheet repeat (Fig. 1a —inset) were retained. An initial round of 3D classification was performed using a previous, low-resolution structure of β 2 m fibrils (EMD-1613 38 ) filtered to 60 Å as a reference. Multiple rounds of 3D classification were then performed with the best model from the previous iteration filtered to 40 Å as a reference. Initial helical symmetry parameters were estimated from measurements of the fibril and refined with local symmetry searches. The possibility of the fibrils having a 2 1 screw axis symmetry was also explored; after initial helical symmetry parameters were determined, a new set of local symmetry searches were performed using the equivalent 2 1 screw axis helical parameters. In all cases, this resulted in lower resolution structures with obvious artefacts from the application of incorrect symmetry (Supplementary Figure 9 ). Exhaustive symmetry searches were performed around the initial symmetry parameters to further refine the helical symmetry. There is some anisotropy in the Z dimension of the reconstruction which means we cannot completely preclude the possibility of the refinement having converged to a local optimum or having slightly symmetry parameters. When no further improvement was observed in the classes generated from 3D classification the particles that contributed to the best class were traced back to their original micrographs and those fibrils containing long runs of contributing segments were re-segmented using the original parameters. Multiple rounds of 3D classification were then again used to generate an optimised particle stack for the final refinement. All 3D classification was performed using a T value 39 of 4. A previous fibril reconstruction 11 reported the necessity of using higher T values to separate fibril morphologies but this was not found to be necessary for this dataset. One round of refinement with the helical symmetry parameters of 4.83 Å rise and −0.608° twist yielded the initial fibril map at 4.2 Å resolution. The final map was generated using the same helical parameters with an additional C 2 symmetry applied across the fibril axis, giving a final model at 3.9 Å resolution by gold standard FSC 70 . Classification and refinement were performed using 30% for the ‘ helical_z_percentage ’ parameter 40 , and final post-processing was performed with a value of 10%. A lower resolution reconstruction of the single protofilament fibril polymorph was made using the above methods, except a T value of 20 was used for 3D classification, the backtracking and re-extraction steps were omitted, and no post-processing was performed. The absolute handedness off the low-resolution reconstruction was not determined, and the fibril was assumed to be left-handed. The resolution of this reconstructions was estimated to be 6.7 Å by analysis of correlation between neighbouring Fourier pixels using the program rmeasure 71 , although the overall appearance the reconstructions, judged by the features that can be resolved suggests these resolution estimates are substantially overestimated due to the high symmetry applied.
Model building and refinement
A single chain of β 2 m was built and manually refined using COOT 72 and 7 copies of the resulting model fit into the EM map using UCSF Chimera 73 to preserve nearest neighbour interactions during subsequent refinement steps. The resulting stack of 8 subunits was then subjected to multiple rounds of real space refinement with NCS restraints in Phenix 74 . Initial refinement iterations were performed with no secondary structure restraints, the results of each round of refinement were analysed with STRIDE 75 to detect secondary structure elements. Distance restraints obtained from the MAS-NMR experiments were used to restrain backbone torsion angles during the final stages of refinement. All refinements were performed using map information to 4.0 Å resolution. For final statistics of the refined model, see Supplementary Table 12 . Surface complementarity of the steric zipper within this model was calculated using the program SC using default parameters. Searching the PDB for π-stacking interactions A python script was written to analyse all of the structures deposited in the RCSB PDB and search for π-stacking interactions similar to those found in the fibril structure. The ring centre for Phe and Tyr residues was defined as the point central to the six atoms that make up the ring (CG, CD1, CD2, CE1, CE2, and CZ) and the ring centre for Trp was defined as the point central to atoms CD2 and CE2. A ‘face-normal’ vector was used to define the orientation of each ring, calculated as the cross product of the centre to CG and centre to CD1 vectors for Phe/Tyr and centre to CD1 and centre to CD2 for Trp (Supplementary Figure 10 ). Two residues were defined to have a face-to-face π-stacking interaction if the centre-to-centre distance was less the 6 Å and difference between face normal vectors 0 ± 20° or 180 ± 20°. The script was then run on all of the structures deposited in the PDB, downloaded on the 17th of January, 2018. The resulting π-stack interactions predicted to involve greater than 5 rings were manually examined and curated. Scanning electron microscopy β 2 m fibrils were adsorbed onto a copper EM grid coated with a layer of amorphous carbon and lightly stained with 1% (w/v) uranyl acetate. The fibril morphology was confirmed using transmission electron microscopy (TEM) and then SEM imaging conducted with a Hitachi SU-8230 cold field emission scanning electron microscope (CFE-SEM) operated at 3.5 keV with beam deceleration of 1.5 keV. Images were recorded at a nominal magnification of 250,000× yielding a pixel size of 3.9 Å/px. Fibril sample preparation for AFM studies Fibril seeds were prepared by stirring a sample (500 μL) of lyophilised wild-type β 2 m re-suspended in a buffer of 10 mM sodium phosphate pH 2.0 containing 50 mM NaCl at a concentration of 120 μΜ, in a 1.5 mL glass vial containing a PTFE magnetic stirrer. Stirring was performed in a custom made magnetic stirrer built by the Department of Physics and Astronomy (University of Leeds) at 1000 rpm in room temperature for 2 days. To monitor the time course of fibril elongation, lyophilised wild-type β 2 m was re-suspended in the same buffer at a concentration of 120 μΜ with 10% (v/v) of seeds added. At various timepoints during fibril elongation, fibrils were deposited on mica surfaces. To ensure uniform coverage and dispersion of the entire surface, the sample was diluted to 0.4 μΜ with freshly made sterile filtered deionised water. A drop of 20 μL sample was deposited on the mica surface followed by incubation for 5 min. The surface was washed by pipetting quickly 1 mL of sterile water and was then immediately dried by applying a gentle steam of N 2 gas.
Atomic force microscopy
Tapping-mode atomic force microscopy was performed utilising a Dimension 3100 Scanning Probe Microscope (Veeco Instruments) and PPP-NCLR silicon cantilever probes (Nanosensors, Neuchatel, Switzerland). The images collected were 10 × 10 μm in each dimension (1024 × 1024 pixels) in height trace mode (scan rate was constant at 0.80 Hz). Acquisition of the image was followed by processing using the NanoScope 6.13rl software to remove surface tilt and scanner bow (by application of a 3rd order polynomial planefit).
Analysis of AFM images
AFM images were analysed using scripts 61 written in MATLAB (Mathworks). Briefly, only fibrils that do not interfere with the image boundaries, do not overlap with neighbouring fibrils, are 4–7 pixels in width and at least 4 pixels in length were unambiguously traced. The length distribution that is biased towards shorter fibrils was then bias-corrected 76 . A Weibull probability density function, found to best describe such a distribution was applied to fit the bias-corrected data and thus length parameters could be calculated. At least 300 fibrils were analysed for each elongation time-point.
Code availability
The script for analysis of PDB files for π-stacking interactions is available at https://github.com/attamatti/findpi .
Electronic supplementary material Supplementary Information Description of Additional Supplementary Files Supplementary Movie 1 Supplementary Movie 2
Electronic supplementary material Supplementary Information accompanies this paper at 10.1038/s41467-018-06761-6.
📊 Figures
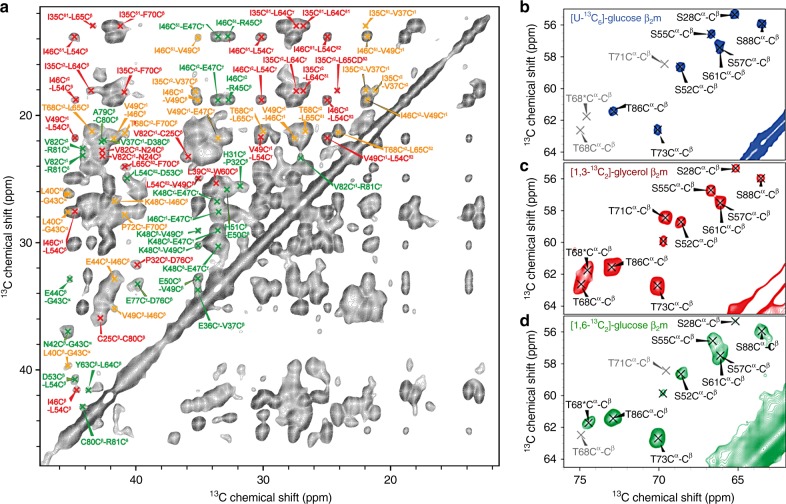
Fig. 1
MAS-NMR spectrau00a0of u03b2 2 m fibrils show a single subunit structure. a Excerpt of a 2D 13 Cu2013 13 C MAS spectrum of uniformly [ 13 C/ 15 N]-labelled u03b2 2 m fibrils using 15u2009ms PAR mixing...
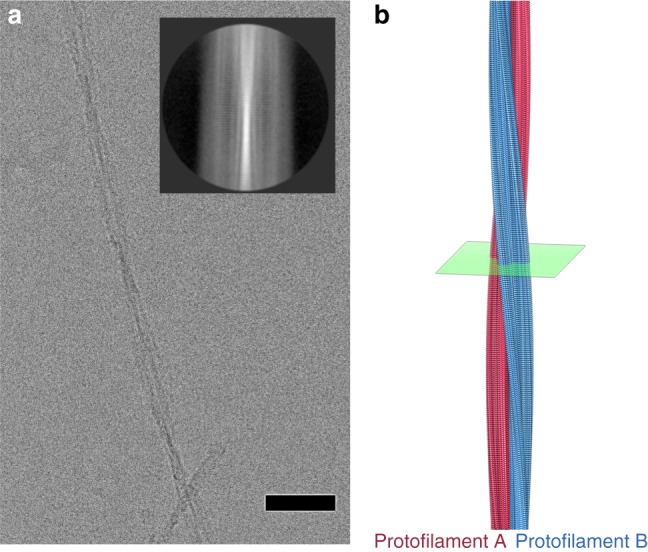
Fig. 2
The cryo-EM structure of a two protofilament u03b2 2 m amyloid fibril. a Raw cryo-EM image of a u03b2 2 m fibril in vitreous ice. The scale bar is 50u2009u00c5 in length. Inset: an average of fibril s...
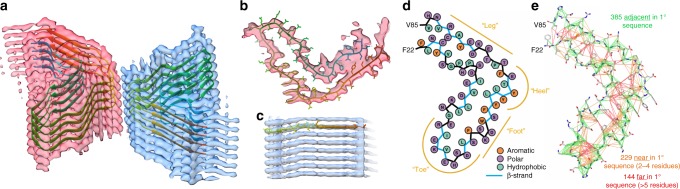
Fig. 3
The structure of a u03b2 2 m amyloid fibril. a Oblique view of the cryo-EM map, with four layers of a de novo atomic model built into each protofilament (coloured pink and blue). The view matches the ...
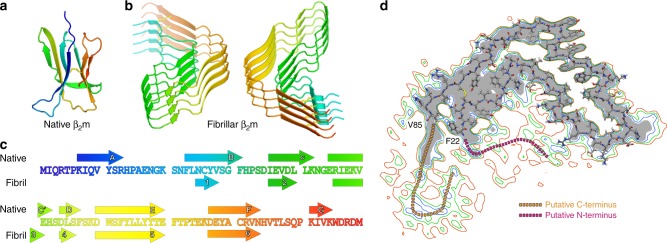
Fig. 4
The structure of u03b2 2 m in its native and fibrillar states. The strands of native u03b2 2 m ( a ) are labelled Au2013G, and those of the fibrillar u03b2 2 m subunit ( b ) are labelled 1u20136. Each...
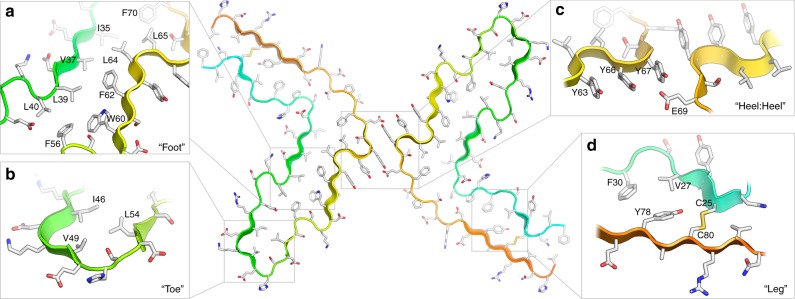
Fig. 5
The atomic model of a two protofilament u03b2 2 m fibril. The central panel shows two u03b2 2 m subunits, and represents a cross-section through a layer of the EM reconstruction, perpendicular to the ...
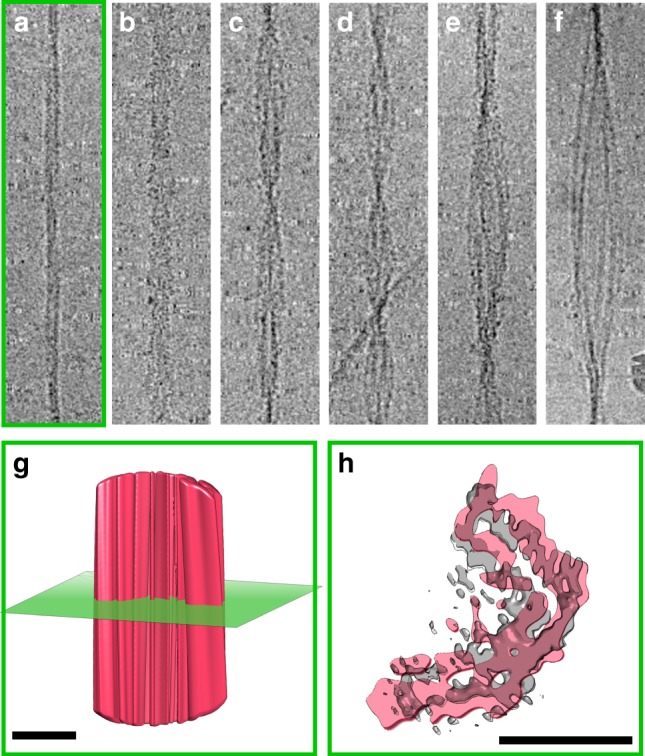
Fig. 6
Variety in fibril morphology. Six different morphologies were identified in the non-entangled fibrils constituting the cryo-EM dataset. These range in size from apparent single protofilaments ( a ), t...
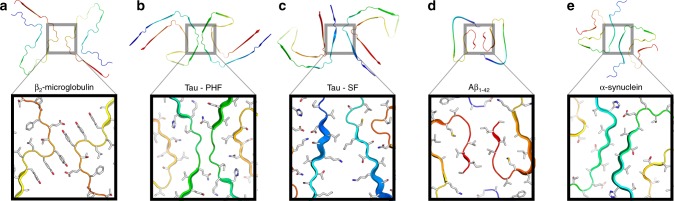
Fig. 7
Inter-protofilament interactions in cryo-EM structures of amyloid fibrils. Comparisons of the subunit structures (upper) and interfaces between protofilaments (boxes) of a u03b2 2 m, Tau variants 11 t...
Figure images are served from the NIH/NLM PubMed Central Open Access Subset or Europe PMC; copyright remains with the publishers and authors.
💬 Discussion
0 commentsNo comments yet. Be the first to start a discussion!
Leave a Comment