Abstract
AbstractMammalian sleep consists of distinct rapid eye movement (REM) and non-REM (NREM) states. The midbrain region ventrolateral periaqueductal gray (vlPAG) is known to be important for gating REM sleep, but the underlying neuronal mechanism is not well understood. Here, we show that activating vlPAG GABAergic neurons in mice suppresses the initiation and maintenance of REM sleep while consolidating NREM sleep, partly through their projection to the dorsolateral pons. Cell-type-specific recording and calcium imaging reveal that most vlPAG GABAergic neurons are strongly suppressed at REM sleep onset and activated at its termination. In addition to the rapid changes at brain state transitions, their activity decreases gradually between REM sleep and is reset by each REM episode in a duration-dependent manner, mirroring the accumulation and dissipation of REM sleep pressure. Thus, vlPAG GABAergic neurons powerfully gate REM sleep, and their firing rate modulation may contribute to the ultradian rhythm of REM/NREM alternation.
🔬 Techniques
🔭 Microscopes
💻 Software
✨ Fluorophores
🧪 Sample Preparation
🏭 Microscope Brands
🧪 Reagent Suppliers
💻 Software Details
🏛️ Research Organizations (ROR)
Affiliated research institutions:
📋 Methods
Animals
All experimental procedures were approved by the Animal Care and Use Committee at the University of California, Berkeley. Optogenetic manipulation experiments were performed in male or female GAD2 -Cre (Jackson Laboratory stock 010702) and VGLUT2-Cre (016963) mice. Optrode recording, calcium imaging, lesion, and rabies-mediated trans-synaptic tracing experiments were all performed in male or female GAD2 -Cre, VGLUT2 - Cre , TH - Cre (008601), and ChAT - Cre (006410) mice. Animals were housed on a 12-h dark/12-h light cycle (light on between 0700 and 1900 hours). Animals with implants for EEG/EMG recordings, optogenetic stimulation, optrode recordings, or calcium imaging were housed individually. Mice injected with viruses for trans-synaptic tracing were housed in groups of up to six animals. Surgical procedures Adult (6–12-week-old) mice were anesthetized with isoflurane (3% induction, 1.5% maintenance) and placed on a stereotaxic frame. Body temperature was kept stable throughout the procedure by using a heating pad. After asepsis, the skin was incised to expose the skull, and the overlying connective tissue was removed. For access to the vlPAG, a craniotomy (1 mm diameter) was made on top of the right superior colliculus (4.6–4.8 mm posterior to bregma, 0.6–0.7 mm lateral). AAV2-EF1a-FLEX-ChR2–eYFP, AAV2-EF1a-FLEX–eYFP (produced by University of North Carolina Vector Core), AAV1-Syn-Flex-GCaMP6f (University of Pennsylvania Vector Core), or AAV-DJ-EF1a-FLEX-ChR2–eYFP (University of Stanford Gene Vector and Virus Core) was loaded into a sharp micropipette mounted on a Nanoject II or Nanoject III and injected slowly at a depth of 2.5 mm from the brain surface (300–500 nl, unilateral). An optical fiber (0.2 mm diameter) was inserted with the tip 0.2 mm above the virus injection site. To stimulate axon projections of vlPAG GABAergic neurons in the dorsolateral pons, the optical fiber was implanted within the pons (5.2–5.3 mm posterior to bregma, 0.9 mm lateral, 3.0 mm depth). For cell-type-specific lesion experiments, AAV2-Flex-taCasp3-Tevp (University of North Carolina Vector Core) was injected bilaterally into the vlPAG (200–300 nl). For optogenetic experiments, data from animals where the tip of the optical fiber was not within the aimed location were excluded. For lesion experiments, data from animals where virus expression was not restricted to the vlPAG were excluded. For EEG and EMG recordings, a reference screw was inserted into the skull on top of the left cerebellum. EEG recordings were made from two screws, one on top of hippocampus (about 2 mm posterior to bregma) and one on top of the prefrontal cortex (about 1 mm anterior to bregma). Two EMG electrodes were inserted into the left and right neck muscles. For EEG/EMG recordings in differential mode, four screws were fixed on the skull, two posterior and two anterior of bregma. All screws, electrodes, microdrives, connectors, and GRIN lenses required for EEG/EMG recordings, optrode recordings, and calcium imaging were secured to the skull using dental cement. Rabies virus tracing For retrograde tracing, AAV-CAG-FLEx loxP -TC 66T (1.0 × 10 12 gc/mL) and AAV8-CAG-FLEx loxP -RG (1.8 × 10 12 gc/mL) was mixed at a 1:1 ratio and stereotaxically injected. For tracing from glutamatergic neurons in the dorsolateral pons, 100 nl was injected into VGLUT2-Cre mice at −5.3 mm AP, 0.8 mm ML, 3.3 mm DV, unilaterally. For tracing from the LDT, 300–500 nl was injected in ChAT - Cre mice at −5.2 mm AP, 0.7 mm ML, 3.2 mm DV, bilaterally. For tracing from the noradrenergic neurons in the LC, 200–300 nl was injected into TH-Cre mice at −5.34 mm AP, 0.8 mm ML, 3.2 mm DV, unilaterally. Two weeks after the AAV injection, 300–400 nl of RV dG -eGFP+EnvA (1.0 × 10 9 cfu/ml) was injected into the same location. The injection pipette for AAV was tilted at 20 degrees from vertical while the injection pipette for RV was inserted vertically to limit virus coinfection along a common injection tract. We excluded animals with inefficient trans-synaptic labeling indicated by 20) and L -ratio (
Show full methods section
Animals
All experimental procedures were approved by the Animal Care and Use Committee at the University of California, Berkeley. Optogenetic manipulation experiments were performed in male or female GAD2 -Cre (Jackson Laboratory stock 010702) and VGLUT2-Cre (016963) mice. Optrode recording, calcium imaging, lesion, and rabies-mediated trans-synaptic tracing experiments were all performed in male or female GAD2 -Cre, VGLUT2 - Cre , TH - Cre (008601), and ChAT - Cre (006410) mice. Animals were housed on a 12-h dark/12-h light cycle (light on between 0700 and 1900 hours). Animals with implants for EEG/EMG recordings, optogenetic stimulation, optrode recordings, or calcium imaging were housed individually. Mice injected with viruses for trans-synaptic tracing were housed in groups of up to six animals. Surgical procedures Adult (6–12-week-old) mice were anesthetized with isoflurane (3% induction, 1.5% maintenance) and placed on a stereotaxic frame. Body temperature was kept stable throughout the procedure by using a heating pad. After asepsis, the skin was incised to expose the skull, and the overlying connective tissue was removed. For access to the vlPAG, a craniotomy (1 mm diameter) was made on top of the right superior colliculus (4.6–4.8 mm posterior to bregma, 0.6–0.7 mm lateral). AAV2-EF1a-FLEX-ChR2–eYFP, AAV2-EF1a-FLEX–eYFP (produced by University of North Carolina Vector Core), AAV1-Syn-Flex-GCaMP6f (University of Pennsylvania Vector Core), or AAV-DJ-EF1a-FLEX-ChR2–eYFP (University of Stanford Gene Vector and Virus Core) was loaded into a sharp micropipette mounted on a Nanoject II or Nanoject III and injected slowly at a depth of 2.5 mm from the brain surface (300–500 nl, unilateral). An optical fiber (0.2 mm diameter) was inserted with the tip 0.2 mm above the virus injection site. To stimulate axon projections of vlPAG GABAergic neurons in the dorsolateral pons, the optical fiber was implanted within the pons (5.2–5.3 mm posterior to bregma, 0.9 mm lateral, 3.0 mm depth). For cell-type-specific lesion experiments, AAV2-Flex-taCasp3-Tevp (University of North Carolina Vector Core) was injected bilaterally into the vlPAG (200–300 nl). For optogenetic experiments, data from animals where the tip of the optical fiber was not within the aimed location were excluded. For lesion experiments, data from animals where virus expression was not restricted to the vlPAG were excluded. For EEG and EMG recordings, a reference screw was inserted into the skull on top of the left cerebellum. EEG recordings were made from two screws, one on top of hippocampus (about 2 mm posterior to bregma) and one on top of the prefrontal cortex (about 1 mm anterior to bregma). Two EMG electrodes were inserted into the left and right neck muscles. For EEG/EMG recordings in differential mode, four screws were fixed on the skull, two posterior and two anterior of bregma. All screws, electrodes, microdrives, connectors, and GRIN lenses required for EEG/EMG recordings, optrode recordings, and calcium imaging were secured to the skull using dental cement. Rabies virus tracing For retrograde tracing, AAV-CAG-FLEx loxP -TC 66T (1.0 × 10 12 gc/mL) and AAV8-CAG-FLEx loxP -RG (1.8 × 10 12 gc/mL) was mixed at a 1:1 ratio and stereotaxically injected. For tracing from glutamatergic neurons in the dorsolateral pons, 100 nl was injected into VGLUT2-Cre mice at −5.3 mm AP, 0.8 mm ML, 3.3 mm DV, unilaterally. For tracing from the LDT, 300–500 nl was injected in ChAT - Cre mice at −5.2 mm AP, 0.7 mm ML, 3.2 mm DV, bilaterally. For tracing from the noradrenergic neurons in the LC, 200–300 nl was injected into TH-Cre mice at −5.34 mm AP, 0.8 mm ML, 3.2 mm DV, unilaterally. Two weeks after the AAV injection, 300–400 nl of RV dG -eGFP+EnvA (1.0 × 10 9 cfu/ml) was injected into the same location. The injection pipette for AAV was tilted at 20 degrees from vertical while the injection pipette for RV was inserted vertically to limit virus coinfection along a common injection tract. We excluded animals with inefficient trans-synaptic labeling indicated by 20) and L -ratio (
📊 Figures
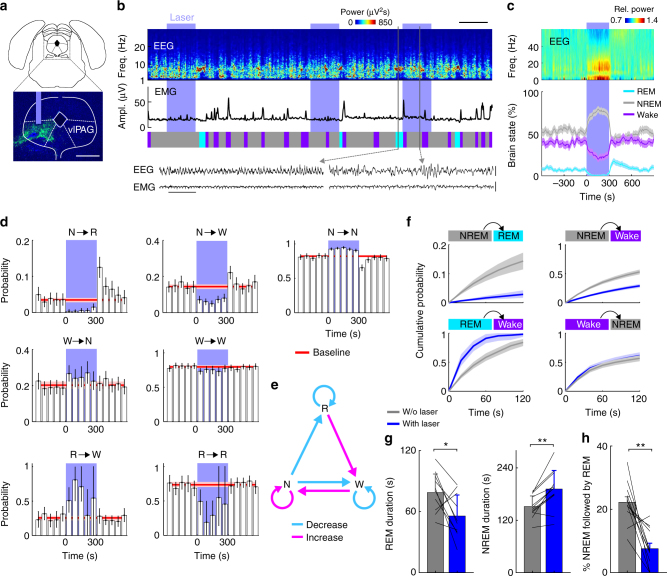
Fig. 1
Optogenetic activation of vlPAG GABAergic neurons suppresses REM sleep and wakefulness while enhancing NREM sleep. a Schematic of optogenetic experiment. Top, coronal diagram of mouse brain; bottom, f...
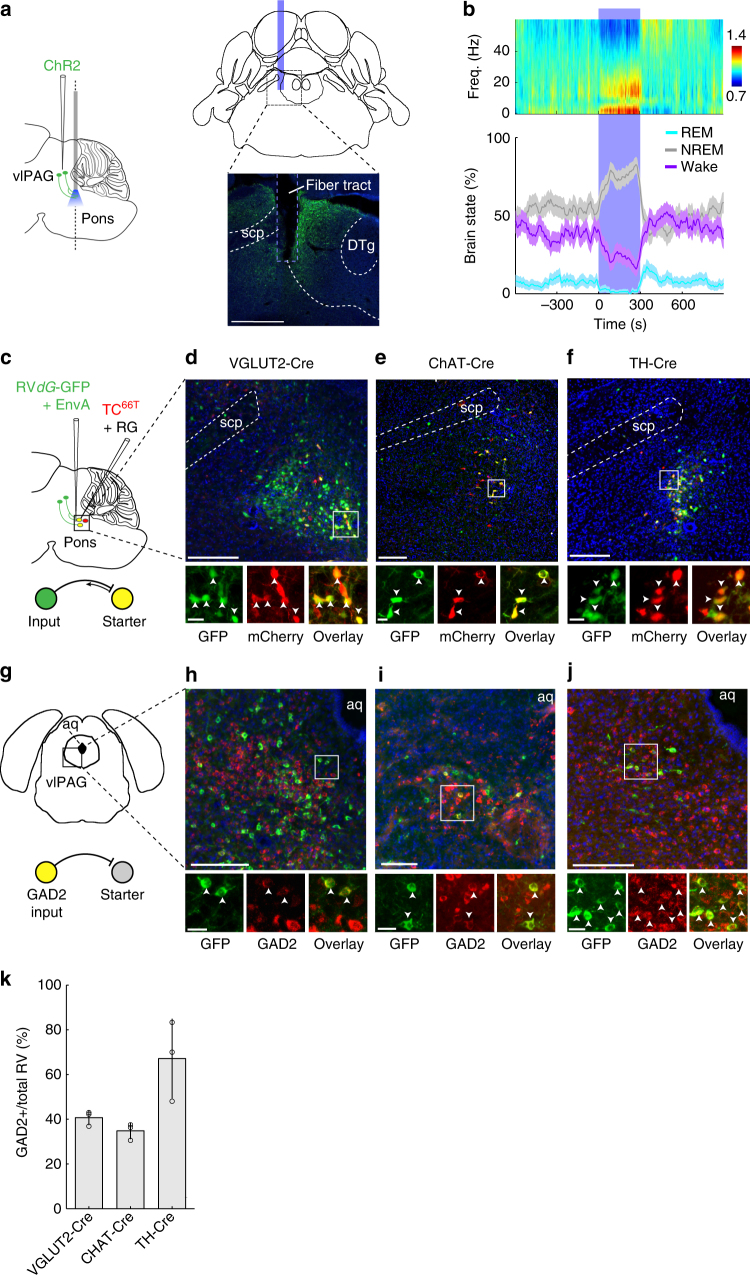
Fig. 2
Inhibition of dorsolateral pons by vlPAG GABAergic projection suppresses REM sleep and wakefulness while promoting NREM sleep. a Left, schematic depicting ChR2-mediated activation of GABAergic axons p...
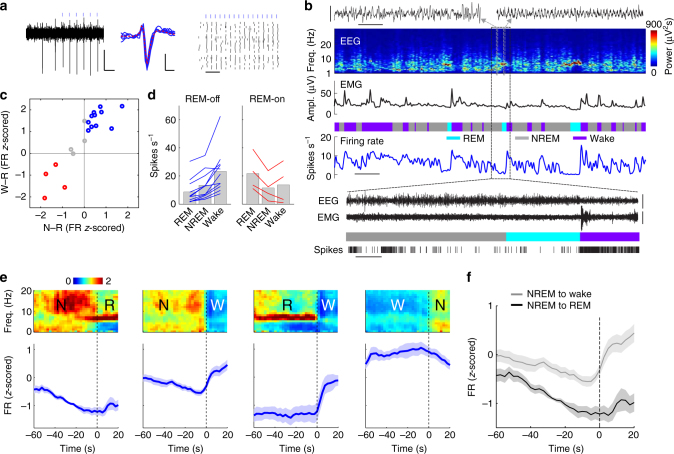
Fig. 3
Firing rates of identified vlPAG GABAergic neurons across brain states. a Example unit. Left, raw trace showing spontaneous and laser-evoked spikes. Blue ticks, laser pulses (15u2009Hz). Scale bars, 1...
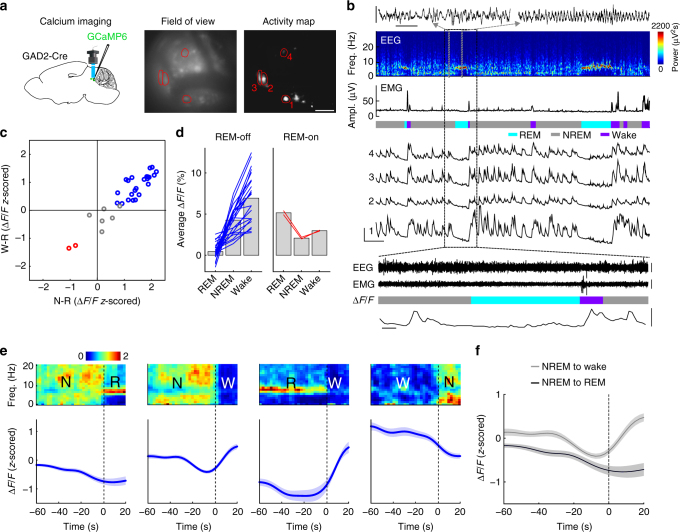
Fig. 4
Sleepu2013wake activity of vlPAG GABAergic neurons measured with calcium imaging. a Left, schematic of calcium imaging through GRIN lens. Middle, field of view of an example imaging session. Right, pi...
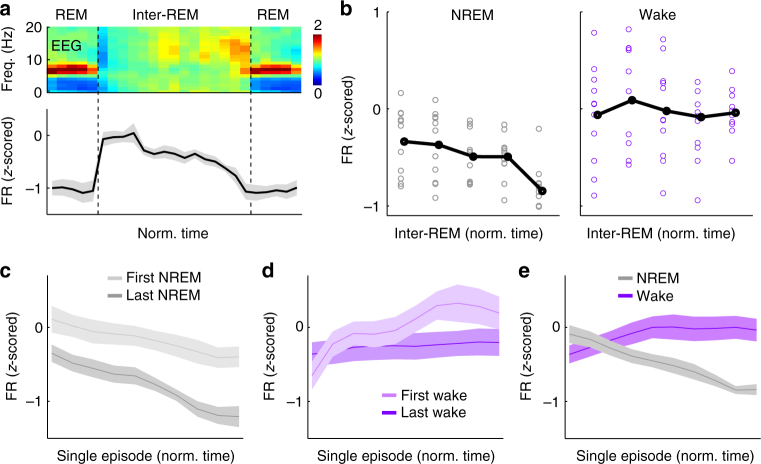
Fig. 5
Slow modulation of vlPAG GABAergic neuron activity during inter-REM interval. a Average normalized EEG spectrogram (upper) and mean firing rate ( z -scored) of significant REM-off vlPAG GABAergic neur...
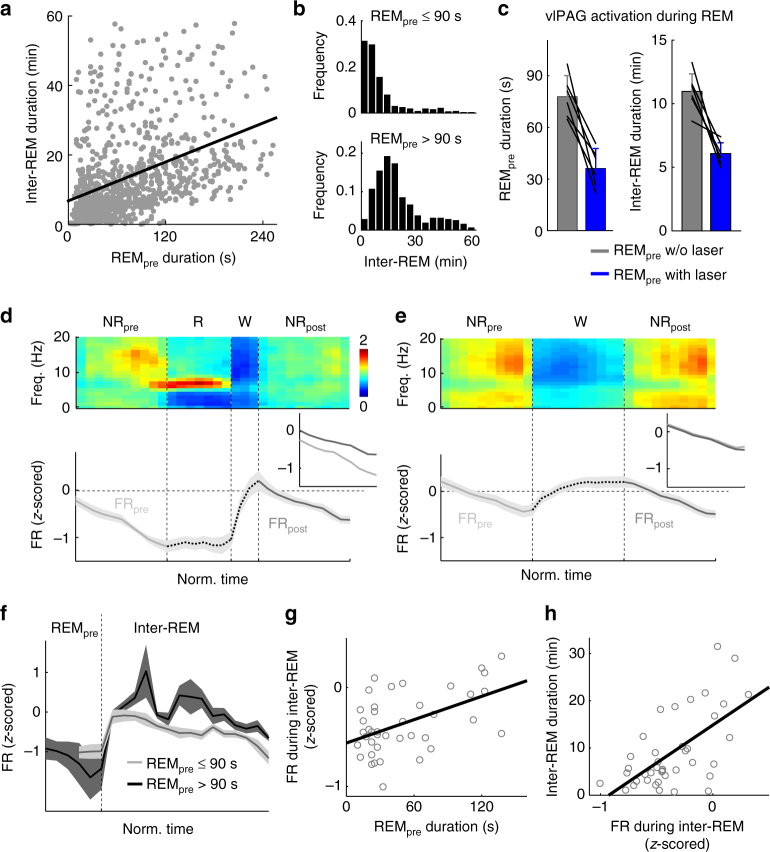
Fig. 6
Homeostatic modulation of REM sleep and REM-off neuron activity. a Correlation between REM episode duration and subsequent inter-REM interval. Each dot represents a single episode ( n =u2009972 episod...
Figure images are served from the NIH/NLM PubMed Central Open Access Subset or Europe PMC; copyright remains with the publishers and authors.
💬 Discussion
0 commentsNo comments yet. Be the first to start a discussion!
Leave a Comment