Abstract
Abstract Vasoactive intestinal polypeptide receptor (VIP1R) is a widely expressed class B G protein-coupled receptor and a drug target for the treatment of neuronal, metabolic, and inflammatory diseases. However, our understanding of its mechanism of action and the potential of drug discovery targeting this receptor is limited by the lack of structural information of VIP1R. Here we report a cryo-electron microscopy structure of human VIP1R bound to PACAP27 and Gs heterotrimer, whose complex assembly is stabilized by a NanoBiT tethering strategy. Comparison with other class B GPCR structures reveals that PACAP27 engages VIP1R with its N-terminus inserting into the ligand binding pocket at the transmembrane bundle of the receptor, which subsequently couples to the G protein in a receptor-specific manner. This structure has provided insights into the molecular basis of PACAP27 binding and VIP receptor activation. The methodology of the NanoBiT tethering may help to provide structural information of unstable complexes.
🔬 Techniques
🔭 Microscopes
🧬 Organisms
💻 Software
✨ Fluorophores
🧪 Sample Preparation
🔬 Cell Lines
🏭 Microscope Brands
🧪 Reagent Suppliers
📷 Detectors
💻 Software Details
💾 Data Repositories
🏛️ Research Organizations (ROR)
Affiliated research institutions:
📋 Methods
Constructs Human VIP1R (residues 31–437) was cloned into pFastbac with an N-terminal FLAG tag followed by a His8 tag, as well as LgBiT at the C-terminus using homologous recombination (CloneExpress One Step Cloning Kit, Vazyme). The primers used in this study are shown in Supplementary Table 5 . The native signal peptide was replaced with the prolactin precursor sequence to increase the protein expression. A dominant-negative bovine Gαs (DNGαs) construct was generated by site-directed mutagenesis to incorporate mutations S54N, G226A, E268A, N271K, K274D, R280K, T284D, and I285T to decrease the affinity of nucleotide-binding and increase the stability of Gαβγ complex 28 . Rat Gβ1 was cloned with an N-terminal His6 tag and a C-terminal SmBiT connected with a 15 residues linker. All three G protein components together with bovine Gγ2 were cloned into a pFastBac vector, respectively.
Insect cells expression
VIP1R(31–437)–LgBiT fusion, DNGαs, Gβ1–SmBiT fusion, and Gγ2 were coexpressed in Sf9 insect cells (Invitrogen) using the Bac-to-Bac baculovirus expression system (Thermo Fisher). Cell cultures were grown in ESF 921 serum-free medium (Expression Systems) to a density of 3 × 10 6 cells mL −1 and then infected with baculovirus expressing VIP1R(31–437)–LgBiT fusion, DNGαs, Gβ1–SmBiT fusion, and Gγ2, respectively, at the ratio of 1:1:1:1. The cells were collected by centrifugation at 1000 × g (Thermo Fisher, H12000 ) for 20 min after infection for 48 h, and kept frozen at −80 °C until use.
Expression and purification of Nb35 Nanobody-35
(Nb35) with a C-terminal His6 tag, was expressed in the periplasm of E. coli strain BL21 19 . Cultures of 2 L cells were grown to OD600 = 1.0 at 37 °C in TB media containing 0.1% glucose, 2 mM MgCl 2 , and 100 μg mL −1 ampicillin. Then, 1 mM IPTG was added to the medium to induce protein expression for another 4.5 h at 37 °C. Cells were harvested by centrifugation and lysed in ice-cold buffer (50 mM Tris pH 8.0, 12.5 mM EDTA, and 0.125 M sucrose), then centrifuged to remove cell debris. Nb35 was purified by nickel affinity chromatography, followed by size-exclusion chromatography using a HiLoad 16/600 Superdex 75 column, and finally spin concentrated to ~2.5 mg mL −1 .
Show full methods section
Constructs Human VIP1R (residues 31–437) was cloned into pFastbac with an N-terminal FLAG tag followed by a His8 tag, as well as LgBiT at the C-terminus using homologous recombination (CloneExpress One Step Cloning Kit, Vazyme). The primers used in this study are shown in Supplementary Table 5 . The native signal peptide was replaced with the prolactin precursor sequence to increase the protein expression. A dominant-negative bovine Gαs (DNGαs) construct was generated by site-directed mutagenesis to incorporate mutations S54N, G226A, E268A, N271K, K274D, R280K, T284D, and I285T to decrease the affinity of nucleotide-binding and increase the stability of Gαβγ complex 28 . Rat Gβ1 was cloned with an N-terminal His6 tag and a C-terminal SmBiT connected with a 15 residues linker. All three G protein components together with bovine Gγ2 were cloned into a pFastBac vector, respectively.
Insect cells expression
VIP1R(31–437)–LgBiT fusion, DNGαs, Gβ1–SmBiT fusion, and Gγ2 were coexpressed in Sf9 insect cells (Invitrogen) using the Bac-to-Bac baculovirus expression system (Thermo Fisher). Cell cultures were grown in ESF 921 serum-free medium (Expression Systems) to a density of 3 × 10 6 cells mL −1 and then infected with baculovirus expressing VIP1R(31–437)–LgBiT fusion, DNGαs, Gβ1–SmBiT fusion, and Gγ2, respectively, at the ratio of 1:1:1:1. The cells were collected by centrifugation at 1000 × g (Thermo Fisher, H12000 ) for 20 min after infection for 48 h, and kept frozen at −80 °C until use.
Expression and purification of Nb35 Nanobody-35
(Nb35) with a C-terminal His6 tag, was expressed in the periplasm of E. coli strain BL21 19 . Cultures of 2 L cells were grown to OD600 = 1.0 at 37 °C in TB media containing 0.1% glucose, 2 mM MgCl 2 , and 100 μg mL −1 ampicillin. Then, 1 mM IPTG was added to the medium to induce protein expression for another 4.5 h at 37 °C. Cells were harvested by centrifugation and lysed in ice-cold buffer (50 mM Tris pH 8.0, 12.5 mM EDTA, and 0.125 M sucrose), then centrifuged to remove cell debris. Nb35 was purified by nickel affinity chromatography, followed by size-exclusion chromatography using a HiLoad 16/600 Superdex 75 column, and finally spin concentrated to ~2.5 mg mL −1 .
PACAP27–VIP1R–Gs complex formation and purification
Cell pellets from 2 L culture were thawed and lysed in 20 mM HEPES, pH 7.4, 100 mM NaCl, 10% glycerol, 0.25 mM TCEP, 5 mM MgCl 2 , and 5 mM CaCl 2 supplemented with EDTA-Free Protease Inhibitor Cocktail (Selleck). The VIP1R–Gs complex was formed in membranes by the addition of 10 μM PACAP27 (Synpeptide), 10 μg mL −1 Nb35, and 25 mU mL −1 apyrase and incubation for 1.5 h at room temperature. Cell membranes were collected by ultracentrifugation at 64,000 × g for 35 min. The membranes were then resuspended and solubilized in buffer containing 20 mM HEPES, pH 7.4, 100 mM NaCl, 10% glycerol, 0.25 mM TCEP, 5 mM MgCl 2 , 5 mM CaCl 2 , and 0.5% (w/v) lauryl maltose neopentylglycol (LMNG, Anatrace), 0.1% (w/v) cholesteryl hemisuccinate TRIS salt (CHS, Anatrace), 5 µM PACAP27, and 25 mU mL −1 apyrase for 3 h at 4 °C. The supernatant was collected by centrifugation at 80,000 × g for 40 min and then incubated with 3 mL pre-equilibrated Nickel-NTA resin for 2 h at 4 °C. After batch binding, the resin was loaded into a plastic gravity flow column and washed with ten column volumes of 20 mM HEPES, pH 7.4, 100 mM NaCl, 40 mM imidazole, 10% glycerol, 0.25 mM TCEP, 2 mM MgCl 2 , 2 mM CaCl 2 , 0.01% (w/v) LMNG, 0.01% glyco-diosgenin (GDN, Anatrace) and 0.002% (w/v) CHS, 5 μM PACAP27 and eluted with five column volumes of the same buffer plus 250 mM imidazole. The Ni-NTA-purified fraction was immobilized by batch binding to M1 anti-Flag affinity resin overnight at 4 °C. Next day, the M1 anti-Flag affinity resin was washed with five column volumes of 20 mM HEPES, pH 7.4, 100 mM NaCl, 10% glycerol, 0.25 mM TCEP, 2 mM MgCl 2 , 2 mM CaCl 2 , 0.01% (w/v) LMNG, 0.01% GDN (Anatrace) and 0.002% (w/v) CHS, 5 μM PACAP27 and eluted with five column volumes of the same buffer plus 0.2 mg mL −1 Flag peptide. The complex was then concentrated using an Amicon Ultra Centrifugal Filter (MWCO 100 kDa) and injected onto a Superdex 200 10/300 GL column (GE Healthcare) equilibrated in the buffer containing 20 mM HEPES, pH 7.4, 100 mM NaCl, 2 mM MgCl 2 , 2 mM CaCl 2 , 0.0015% (w/v) LMNG, 0.0005% GDN, 0.0003% (w/v) CHS, 5 μM PACAP27, and 100 μM TCEP. The complex fractions were collected and concentrated for electron microscopy experiments. The final yield of the purified complex was ~0.2 mg per liter of insect cell culture.
CCR7–Gi–scfv16 complex expression and purification
The cDNA of human WT CCR7 was cloned into pFastbac with an LgBiT inserted at the C-terminal of CCR7. The CCR7–LgBiT was followed by a C-terminal double MBP and His8 tag to facilitate purification. Receptor, human DNGαi (G203A, A326S), rat Gβ1, bovine Gγ2, and scfv16 were coexpressed and assembled in Sf9 insect cells. The CCR7–Gi–scfv16 complex was purified substantially in the same way described above except for the MBP instead of M1 anti-Flag affinity purification.
Negative-stain electron microscopy screening
For preparing 0.75% uranyl formate solution, weigh out 37.5 mg of uranyl formate into a small beaker, add 5 mL of boiling water and stir for 5 min in the dark, add 10 μL of 5 M NaOH, continue stirring for 5 min, and finally filter the solution using a syringe filter 39 . 300-mesh copper grids with carbon film (Electron Microscopy Sciences) were glow-discharged (PELCO easiGlow™ Glow Discharge Cleaning System) for 1 min at 25 mA before 3.5 µL purified complex was applied to the grids and incubated for 30 s. After blotting the sample using filter paper, the grid surface was touched on two drops of 40 µL 0.75% uranyl formate, and then the grids were stained on the third drop of uranyl formate with gentle stirring for 40 s. Stained grids were blotted to remove excess stain. Negative-stain data collection was carried out on a Tecnai G2 Spirit transmission electron microscopy (Thermo FEI) operating at 120 kV. Images were collected at a nominal magnification of 105,000 (3.1 Å pixel size) within a −0.5 to −2.5 µm defocus range.
Cryo-EM data acquisition
The purified PACAP27–VIP1R–Gs complex (3.0 μL) at a concentration of 4–5 mg mL −1 was applied to glow-discharged holey carbon grids (Quantifoil R1.2/1.3, 200 mesh), and subsequently vitrified using a Vitrobot Mark IV (Thermo Fisher Scientific). Cryo-EM images were collected on a Titan Krios equipped with a Gatan K2 Summit direct electron detector. The microscope was operated at 300 kV accelerating voltage, at a nominal magnification of ×29,000 in counting mode, corresponding to a pixel size of 1.014 Å. In total, 4215 image stacks were obtained at the dose rate of about eight electrons per Å 2 per second with a defocus range of −1.5 to −2.3 μm. The total exposure time was set to 8 s with intermediate frames recorded every 0.2 s, resulting in an accumulated dose of 64 electrons per Å 2 .
Image processing and 3D reconstruction
Dose-fractionated image stacks were subjected to beam-induced motion correction and dose-weighting using MotionCor2.1 40 . A sum of all frames, filtered according to the exposure dose, in each image stack was used for further processing. Contrast transfer function parameters for each micrograph were determined by Gctf v1.06 41 . The further data processing was performed in RELION-3.0-beta2 42 . Particle selection, two-dimensional classification and the first round of three-dimensional classification were performed on a binned dataset with a pixel size of 2.028 Å. Auto-picking yielded 2,547,930 particle projections that were sequentially subjected to reference-free two-dimensional classification and produced 2,460,220 projections for further processing. This step barely discard false-positive particles or particles categorized in poorly defined classes, indicating the complex stability of the sample generated using NanoBiT tethering method developed in this study. This subset of particle projections was subjected to consecutive rounds of 3D classifications with a pixel size of 2.028 Å. A selected subset containing 131,263 projections was used to obtain the final map using a pixel size of 1.014 Å. After the last round of refinement, the final map has an indicated global resolution of 3.2 Å at a Fourier shell correlation of 0.143. Local resolution was determined using the Bsoft package with half maps as input maps 43 .
Model building and refinement
The cryo-EM structure of PTH1R–Gs–Nb35 complex (PDB code 6NBF) was used as the start for model rebuilding and refinement against the electron microscopy map. The model was docked into the electron microscopy density map using Chimera 44 , followed by iterative manual adjustment and rebuilding in COOT 45 . Real space refinement was performed using phenix.real_space_refine from Phenix program package 46 . The model statistics were validated using MolProbity 47 . Structural figures were prepared in Chimera and PyMOL ( https://pymol.org/2/ ). The final refinement statistics are provided in Supplementary Table 1 . cAMP accumulation assay The full-length VIP1R(31–457) and VIP1R mutants was cloned into pcDNA6.0 vector (Invitrogen) with a FLAG tag at its N-terminus (see Supplementary Table 5 for a list of primers used in this study). CHO-K1 cells (ATCC, #CCL-61) were cultured in Ham’s F-12 Nutrient Mix (Gibco) supplemented with 10% (w/v) fetal bovine serum. Cells were maintained at 37 °C in a 5% CO 2 incubator with 100,000 cells per well in a 12-well plate. Cells were grown overnight and then transfected with 1 μg VIP1R constructs by FuGENE ® HD transfection reagent (DNA/FuGENE ® HD ratio of 1:3) in each well. After 24 h, the transfected cells were seeded onto 384-well microtiter plates (3000 cells per well). cAMP accumulation was measured using the LANCE cAMP kit (PerkinElmer) according to the manufacturer’s instructions with different concentrations of peptides. Fluorescence signals were then measured at 620 and 665 nm by an Envision multilabel plate reader (PerkinElmer). Data presented are means ± SEM of at least three independent experiments. Detection of surface expression of VIP1R mutants The VIP1R mutants were cloned into pcDNA6.0 vector (Invitrogen) with a FLAG tag at its N-terminus. The cell seeding and transfection follow the same method as cAMP accumulation assay. After 24 h of transfection, cells were washed once with PBS and digested with 0.2% (w/v) EDTA in PBS. Cells were blocked with PBS containing 5% (w/v) BSA for 15 min at room temperature and then incubated with primary anti-Flag antibody (diluted with PBS containing 5% BSA at a ratio of 1:300, Sigma) for 1 h at room temperature. Thereafter, cells were washed three times with PBS containing 1% (w/v) BSA before incubating with anti-mouse Alexa-488-conjugated secondary antibody (diluted with PBS containing 5% BSA at a ratio of 1:1000, Invitrogen) at 4 °C in the dark for 1 h. After another three times wash, cells were resuspended, and fluorescence intensity was quantified in a BD Accuri C6 flow cytometer system (BD Biosciences) at excitation 488 nm and emission 519 nm. Approximately 10,000 cellular events per sample were collected and data were normalized to WT. Dynamic light scattering DLS sample was prepared at about 0.2–1.0 mg mL −1 and equilibrated for 5 min before loading 10 μL onto the DynaPro NanoStar (Wyatt Technology). For thermostability assay, the intensity was read with a thermal ramp from 25 to 75 °C with a ramp rate of 2 °C min −1 . All data acquisition and analysis were performed by the Dynamics software. Reporting summary Further information on research design is available in the Nature Research Reporting Summary linked to this article.
Supplementary information Supplementary Information Peer Review File Reporting Summary
📊 Figures
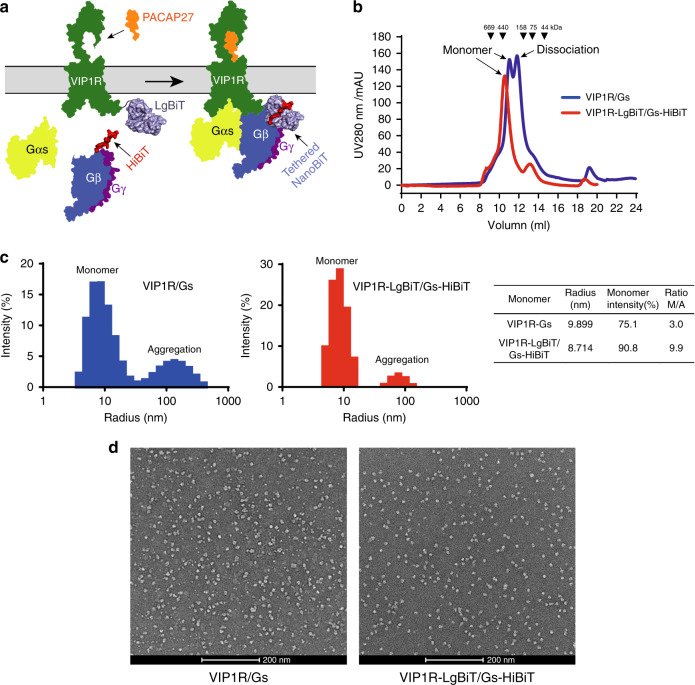
Fig. 1
The NanoBiT strategy for stabilization of PACAP27u2013VIP1Ru2013Gs protein complex.
a Schematic diagram of the NanoBiT aided assembly of the VIP1Ru2013Gs complex. PACAP27 is colored in orange, VIP1R in green, Gu03b1s in yellow, Gu03b2 in blue, Gu03b3 in purple, LgBiT in light blue, a...
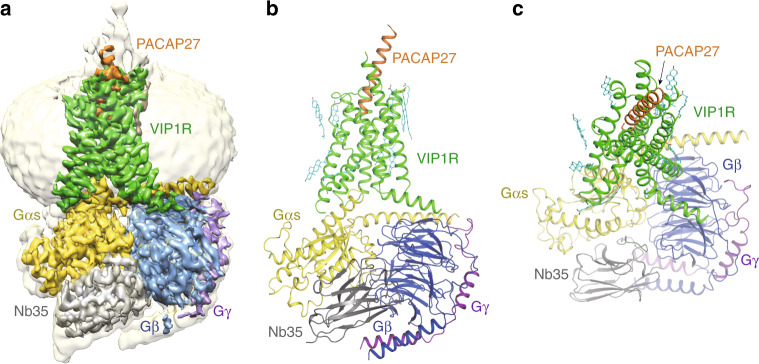
Fig. 2
The overall cryo-EM structure of PACAP27u2013VIP1Ru2013Gs complex.
a A cut-through view of the cryo-EM map of PACAP27u2013VIP1Ru2013Gs complex with a disc-shaped micelle. b A cartoon representation of the PACAP27u2013VIP1Ru2013Gs complex. c Extracellular view of the ...
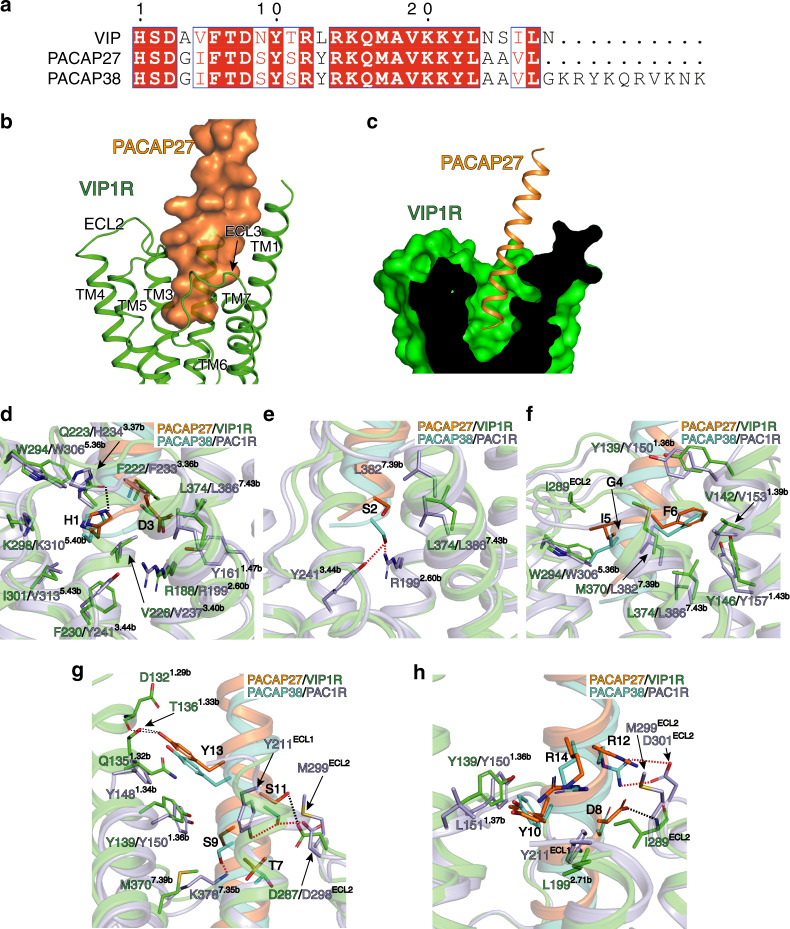
Fig. 3
Comparison of the binding mode of PACAPs to VIP1R and PAC1R.
a Sequence alignment of the VIP1R peptide ligands VIP, PACAP27, and PACAP38. b The binding mode of PACAP27 to VIP1R, showing that PACAP27 adopts u03b1-helical conformation and interacts with all TM he...
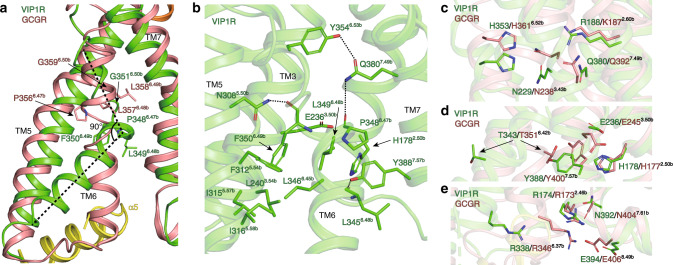
Fig. 4
Structure comparisons of active VIP1R with inactive GCGR.
a The structural alignment of activated VIP1R with inactive GCGR showing the outward bending of the intracellular portion of TM6 of activated VIP1R, which results in a kink at the PxxG motif in TM6 an...
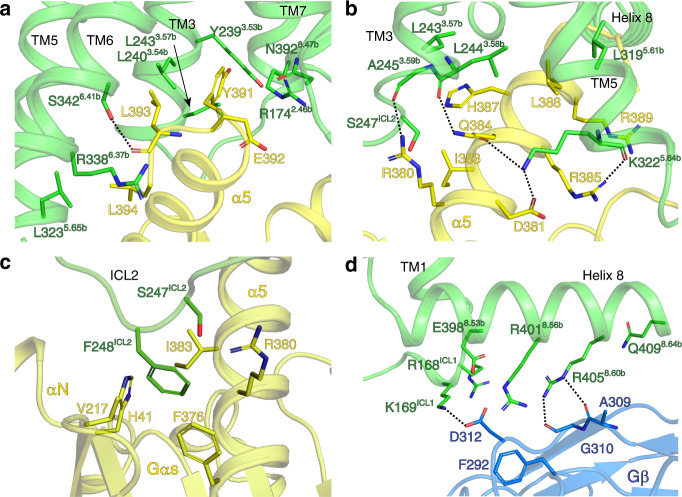
Fig. 5
The interactions between VIP1R and Gs heterotrimer.
a , b The binding interface between the cavity on the intracellular side of VIP1R TMD (green) and u03b15 helix of the Gu03b1s Ras-like domain (yellow). c The interface between ICL2 of VIP1R (green) an...
Figure images are served from the NIH/NLM PubMed Central Open Access Subset or Europe PMC; copyright remains with the publishers and authors.
💬 Discussion
0 commentsNo comments yet. Be the first to start a discussion!
Leave a Comment