Abstract
The accumulation of amyloid-β in the brain is an essential feature of Alzheimer's disease. However, the impact of amyloid-β-accumulation on neuronal dysfunction on the single cell level in vivo is poorly understood. Here we investigate the progression of amyloid-β load in relation to neuronal dysfunction in the visual system of the APP23×PS45 mouse model of Alzheimer's disease. Using in vivo two-photon calcium imaging in the visual cortex, we demonstrate that a progressive deterioration of neuronal tuning for the orientation of visual stimuli occurs in parallel with the age-dependent increase of the amyloid-β load. Importantly, we find this deterioration only in neurons that are hyperactive during spontaneous activity. This impairment of visual cortical circuit function also correlates with pronounced deficits in visual-pattern discrimination. Together, our results identify distinct stages of decline in sensory cortical performance in vivo as a function of the increased amyloid-β-load.
🔬 Techniques
🔭 Microscopes
💻 Software
✨ Fluorophores
🧪 Sample Preparation
🔬 Cell Lines
🏭 Microscope Brands
🧪 Reagent Suppliers
🔴 Lasers
💻 Software Details
🏛️ Research Organizations (ROR)
Affiliated research institutions:
📋 Methods
Animals and surgery
All experimental procedures were performed in accordance with institutional animal welfare guidelines and were approved by the Government of Bavaria, Germany. APP23×PS45 mice were generated from two already existing transgenic mouse lines as described previously 26 . Briefly, one line, APP23 32 , overexpresses human amyloid precursor protein (APP) with the Swedish double mutation at positions 670/671, whereas the other, PS45 (ref. 33 ) carries a transgene for the human Presenilin 1 bearing the G384A mutation (both lines are driven by a Thy-1 promoter). APP23×PS45 mice were reared in 12/12 h light/dark cycles (P46-P60, n =10; 3–3.25 months, n =9; 4–4.5 months, n =10; 8–10 months, n =19). These mice were compared with WT mice with the same strain background (C57Bl/6) and of similar ages (P55-P60, n =9; 3–3.25 months, n =5; 8–10 months, n =15) and to the PS45 mouse line (8–10 months, n =5). Genotypes were systematically determined by PCR analysis. Animals were prepared for in vivo two-photon calcium imaging, as described previously 29 . Briefly, the mice were placed onto a warming plate (38 °C) and anaesthetized by inhalation of 1.5% isoflurane (Curamed, Karlsruhe, Germany) in pure O 2 . After removing the skin, a custom-made recording chamber 55 was then glued to the skull with cyanoacrylic glue (UHU, Buhl-Baden, Germany). The mouse was then transferred into the set-up, placed onto a warming plate (38 °C), and continuously supplied with 0.8–1% isoflurane in pure O 2 (breathing rate, 110–130 b.p.m.). The position of the primary visual cortex was located according to brain atlas coordinates (Bregma −3 to −4.5, 2–3 mm lateral to the midline) 56 . In all experiments, the correct location of the imaged neurons was confirmed post-hoc by imaging of the stained brain area (for example, Fig. 1a ). A small craniotomy (~0.8×0.6 mm) was performed above the monocular region of primary visual cortex using a thin (30-gauge) injection needle. The recording chamber was perfused with warm (37 °C) extracellular perfusion saline containing (in mM): 125 NaCl, 4.5 KCl, 26 NaHCO 3 , 1.25 NaH 2 PO 4 , 2 CaCl 2 , 1 MgCl 2 , 20 glucose, pH 7.4, when bubbled with 95% O 2 and 5% CO 2 . The neurons were stained in vivo with the fluorescent calcium indicator dye Oregon Green BAPTA-1 (OGB-1) following the protocol described in detail in ref. 29 . Amyloid-β-plaques were stained in vivo in a comparable way, by pressure-injecting Thioflavin-S (0.001% (w/v)). Eye cream (Bepanthen, Bayer) was applied on both eyes to prevent dehydration during surgery. After surgery, the anaesthesia level was decreased to 0.8% isoflurane for recordings (breathing rate, 110–130 b.p.m.).
Show full methods section
Animals and surgery
All experimental procedures were performed in accordance with institutional animal welfare guidelines and were approved by the Government of Bavaria, Germany. APP23×PS45 mice were generated from two already existing transgenic mouse lines as described previously 26 . Briefly, one line, APP23 32 , overexpresses human amyloid precursor protein (APP) with the Swedish double mutation at positions 670/671, whereas the other, PS45 (ref. 33 ) carries a transgene for the human Presenilin 1 bearing the G384A mutation (both lines are driven by a Thy-1 promoter). APP23×PS45 mice were reared in 12/12 h light/dark cycles (P46-P60, n =10; 3–3.25 months, n =9; 4–4.5 months, n =10; 8–10 months, n =19). These mice were compared with WT mice with the same strain background (C57Bl/6) and of similar ages (P55-P60, n =9; 3–3.25 months, n =5; 8–10 months, n =15) and to the PS45 mouse line (8–10 months, n =5). Genotypes were systematically determined by PCR analysis. Animals were prepared for in vivo two-photon calcium imaging, as described previously 29 . Briefly, the mice were placed onto a warming plate (38 °C) and anaesthetized by inhalation of 1.5% isoflurane (Curamed, Karlsruhe, Germany) in pure O 2 . After removing the skin, a custom-made recording chamber 55 was then glued to the skull with cyanoacrylic glue (UHU, Buhl-Baden, Germany). The mouse was then transferred into the set-up, placed onto a warming plate (38 °C), and continuously supplied with 0.8–1% isoflurane in pure O 2 (breathing rate, 110–130 b.p.m.). The position of the primary visual cortex was located according to brain atlas coordinates (Bregma −3 to −4.5, 2–3 mm lateral to the midline) 56 . In all experiments, the correct location of the imaged neurons was confirmed post-hoc by imaging of the stained brain area (for example, Fig. 1a ). A small craniotomy (~0.8×0.6 mm) was performed above the monocular region of primary visual cortex using a thin (30-gauge) injection needle. The recording chamber was perfused with warm (37 °C) extracellular perfusion saline containing (in mM): 125 NaCl, 4.5 KCl, 26 NaHCO 3 , 1.25 NaH 2 PO 4 , 2 CaCl 2 , 1 MgCl 2 , 20 glucose, pH 7.4, when bubbled with 95% O 2 and 5% CO 2 . The neurons were stained in vivo with the fluorescent calcium indicator dye Oregon Green BAPTA-1 (OGB-1) following the protocol described in detail in ref. 29 . Amyloid-β-plaques were stained in vivo in a comparable way, by pressure-injecting Thioflavin-S (0.001% (w/v)). Eye cream (Bepanthen, Bayer) was applied on both eyes to prevent dehydration during surgery. After surgery, the anaesthesia level was decreased to 0.8% isoflurane for recordings (breathing rate, 110–130 b.p.m.).
Two-photon calcium imaging
In vivo calcium imaging was performed by using a custom-built two-photon microscope based on Ti:Sapphire pulsing laser (model: Chameleon, repetition rate: 80 MHz, pulse width: 140 fs; Coherent) and resonant galvo-mirror (8 kHz; GSI) system 57 . The scanner was mounted on an upright microscope (BX51WI, Olympus, Tokyo, Japan) equipped with a water-immersion objective (×60, 1.0 NA Nikon, Japan or ×40, 0.8″ NA Nikon, Japan). Emitted photons were detected by photomultiplier tubes (H7422-40; Hamamatsu). Full-frame images at 480×400 pixel resolution were acquired at 30 Hz by custom-programmed software based on LabVIEW (version 8.2; National Instruments). At each focal plane, we imaged spontaneous activity (for at least 4 min) as well as visually evoked activity (6 to 10 trials of visual stimulation). For simultaneous visualization of Aβ-plaques and cortical neurons labelled with OGB-1, the emitted fluorescence light was split at 515 nm. To identify the amyloid plaques close to the recorded neurons, the brain region (± about 200 μm, centred on the recorded neurons) was scanned through in the z direction (z-stack, 2 μm step), at the end of each experiment. Drug application Gabazine (2 μM) was added to the extracellular saline solution perfusing the chamber attached to the mouse's skull ('bath' application).
Visual stimulation
Visual stimuli were generated by Matlab (release 2007b; Mathworks) with the 'Psychtoolbox' add-on package (http://psychtoolbox.org/wikka.php?wakka=HomePage). Visual stimuli were projected on a screen placed 30 cm from the contralateral eye, covering 80°×67° of the visual field. Each trial of visual stimulation started with a grey screen (mean luminance) for 5 s, followed by a stationary square-wave grating for 4 s and the corresponding drifting phase for 2 s (0.03 c.p.d., 1 Hz, 8 directions, contrast 80%, mean luminance 3.7 cd m −2 ). We used stationary gratings during the inter-stimulus periods to study specifically the responses to moving gratings. When a blank screen is used during the inter-stimulus period instead of stationary gratings, responses to local changes in luminance may occur. At each focal plane, evoked activities were imaged during 6–10 trials. Under our experimental conditions, this visual stimulation protocol evoked visual responses in 95/313 neurons (APP23×PS45, 1.5–2 months), 132/426 neurons (WT, 1.5–2 months), 94/334 neurons (APP23×PS45, 3–3.25 months), 140/464 neurons (APP23×PS45, 4–4.5 months), 145/404 neurons (APP23×PS45, 8–10 months) and in 131/384 neurons (WT, 8–10 months).
Data analysis
The image analysis was performed off-line in two steps. First, the ImageJ software (http://rsb.info.nih.gov/ij/) was used for drawing regions of interest (ROIs) around cell bodies and around a large area of cell-free neuropil. Astrocytes were identified based on their selective staining by sulforhodamine 101 (refs 58 , 59 ), brighter appearance after staining with OGB1-AM 35 and their specific morphology with clearly visible processes. The presence of glial processes was assessed by inspecting 3D-stacks (70 μm below and upper the imaged plane) obtained routinely at the end of each experiment. In the next step, custom-made routines of the Igor Pro software (Wavemetrics, Lake Oswego, Oregon, USA) were used for the detection of wave-associated calcium transients in individual neurons. Calcium signals were expressed as relative fluorescence changes (ΔF/F) corresponding to the mean fluorescence from all pixels within specified ROIs. For each ROI, a transient was accepted as a signal, when its peak amplitude was greater than three times the standard deviation of the noise band. After the automatic analysis, all traces were carefully inspected. The analysis of the visually evoked responses was performed by using the average traces of the 6–10 stimulus trials used during the imaging session (see examples in Figs 1,2 1b and 2b). Neurons were defined as responsive to moving gratings when they responded to at least one of the eight directions with a significant change in fluorescence (mean amplitude during the 2 s of stimulus presentation, t-test) compared with the activity during the 2 s preceding the presentation of the stimulus (standing grating). An OSI (for example, ref. 36 ) was calculated to quantify the tuning level of the neurons with regard to the orientation of the drifting grating. The OSI was defined as ( R pref − R ortho )/( R pref + R ortho ), where R pref , the mean response in the preferred orientation, was the response with the largest magnitude in the average trace of the 6–10 trials. R pref was determined as the mean of the integrals of the calcium transients for the two corresponding opposite directions. R ortho was similarly calculated as the response evoked by the orthogonal orientation. With this index, perfect orientation selectivity would give OSI=1; an equal response to all orientations would have OSI=0, and 3:1 selectivity corresponds to OSI=0.5. Highly and poorly tuned neurons were defined as neurons with an OSI>0.5 and OSI
📊 Figures
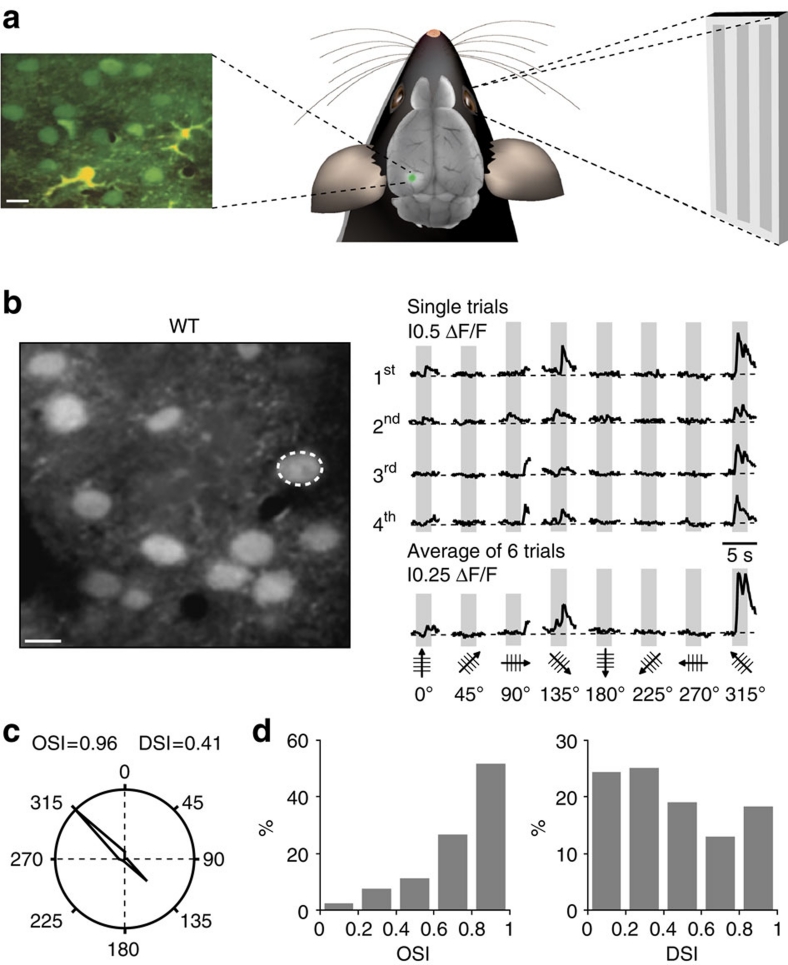
Figure 1
Orientation and direction tuning of visual cortex neurons in 8u201310 month-old WT mice.
( a ) Experimental arrangement for in vivo two-photon calcium imaging of stimulation-evoked neuronal activity. Left panel, in vivo two-photon image of cortical layer 2/3 of the primary visual cortex s...
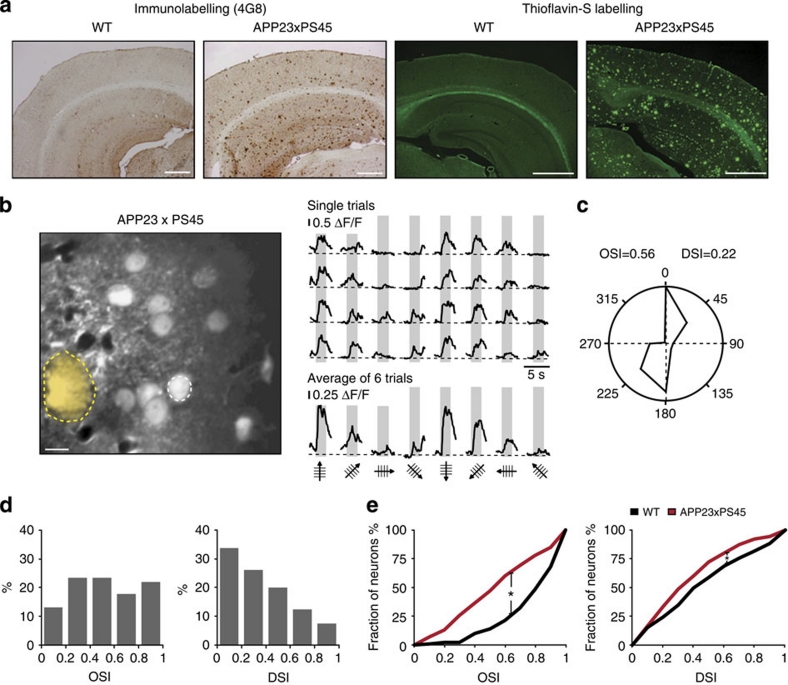
Figure 2
Impaired orientation/direction tuning of visual cortex neurons in 8u201310-month-old APP23u00d7PS45 mice.
( a ) Amyloid-u03b2-deposition in APP23u00d7PS45 mice. Micrographs of coronal brain slices of visual cortices stained with the 4G8 antibody ( a ) and Thioflavin-S ( b ). The slices were obtained from ...
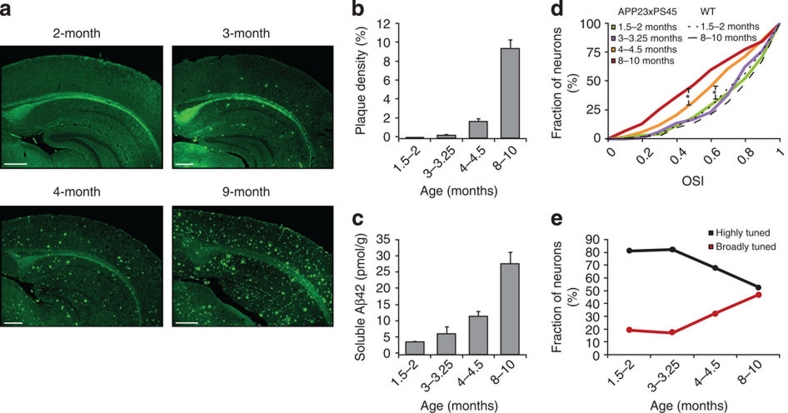
Figure 3
Age dependence of amyloid-u03b2-load and orientation tuning in the visual cortex of APP23u00d7PS45 mice.
( a ) Amyloid-u03b2-deposition in the visual cortex of APP23u00d7PS45 mice. Micrographs of coronal brain slices of visual cortices stained with Thioflavin-S. The slices were obtained from 2-, 3-, 4- a...
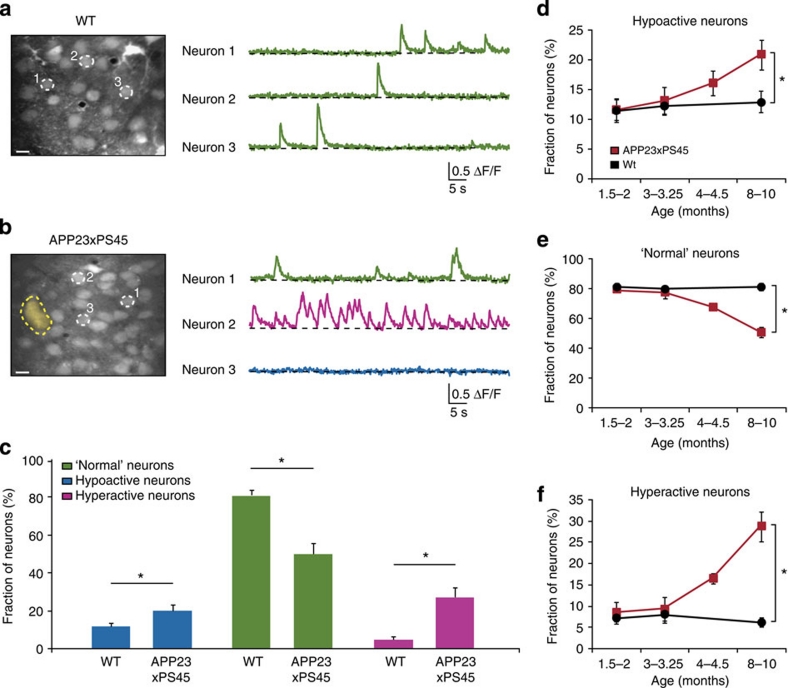
Figure 4
Age-dependence of spontaneous activity in the visual cortex of WT and APP23u00d7PS45 mice.
( a,b ) Spontaneous calcium transients recorded in vivo from layer 2/3 neurons of the visual cortex of a WT ( a ) and an APP23u00d7PS45 ( b ) mouse (10- and 9-months, respectively). Left panels, in vi...
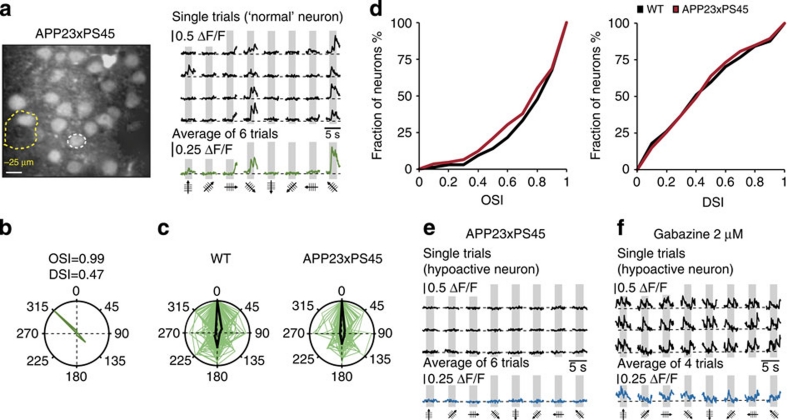
Figure 5
Response of normal and hypoactive neurons to stimulus orientation and direction.
( a ) Left panel, in vivo two-photon image of layer 2/3 neurons in the visual cortex of an APP23u00d7PS45 mouse (8-months). The broken yellow line delineates a Thioflavin-S-positive plaque that was lo...
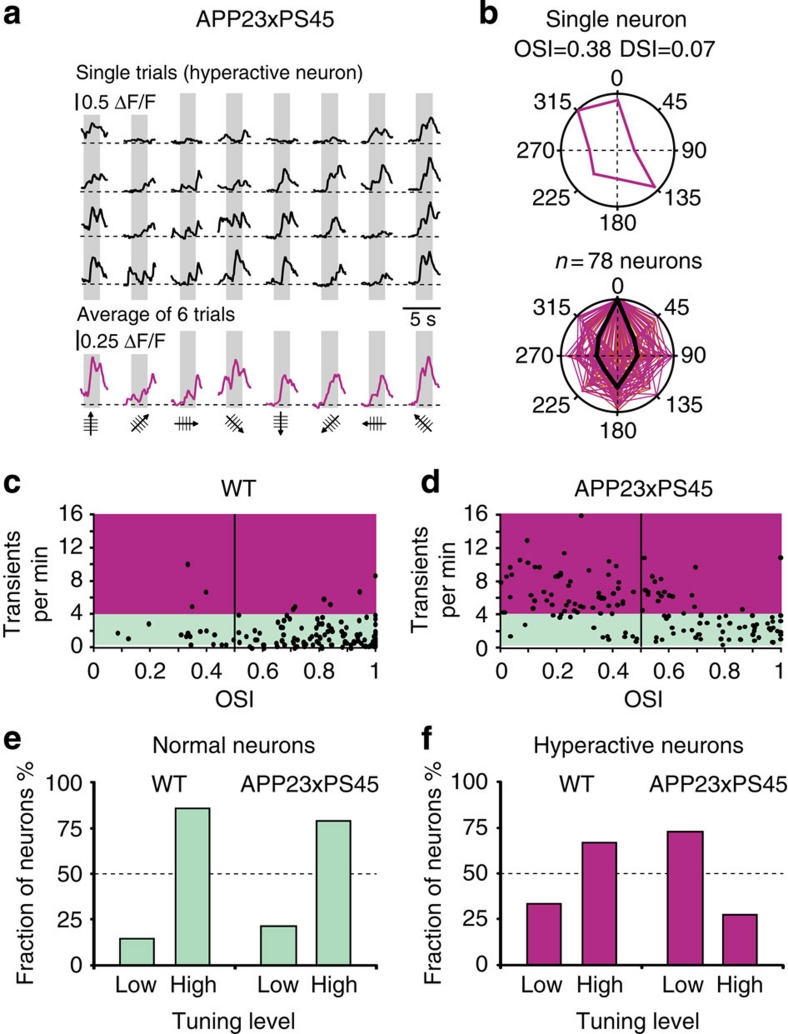
Figure 6
Response of hyperactive neurons to stimulus orientation and direction.
( a ) Stimulus-evoked calcium transients recorded from a hyperactive neuron in an APP23u00d7PS45 mouse (8-months). ( b ) Top panel, polar plot showing the response function (purple lines) to oriented ...
Figure images are served from the NIH/NLM PubMed Central Open Access Subset or Europe PMC; copyright remains with the publishers and authors.
💬 Discussion
0 commentsNo comments yet. Be the first to start a discussion!
Leave a Comment