Abstract
Formation of G protein-coupled receptors (GPCRs) into dimers and higher order oligomers represents a key mechanism in pleiotropic signaling, yet how individual protomers function within oligomers remains poorly understood. We present a super-resolution imaging approach, resolving single GPCR molecules to ∼ 8 nm resolution in functional asymmetric dimers and oligomers using dual-color photoactivatable dyes and localization microscopy (PD-PALM). PD-PALM of two functionally defined mutant luteinizing hormone receptors (LHRs), a ligand-binding deficient receptor (LHR(B-)) and a signaling-deficient (LHR(S-)) receptor, which only function via intermolecular cooperation, favored oligomeric over dimeric formation. PD-PALM imaging of trimers and tetramers revealed specific spatial organizations of individual protomers in complexes where the ratiometric composition of LHR(B-) to LHR(S-) modulated ligand-induced signal sensitivity. Structural modeling of asymmetric LHR oligomers strongly aligned with PD-PALM-imaged spatial arrangements, identifying multiple possible helix interfaces mediating inter-protomer associations. Our findings reveal that diverse spatial and structural assemblies mediating GPCR oligomerization may acutely fine-tune the cellular signaling profile.
🔬 Techniques
🔭 Microscopes
✨ Fluorophores
🧪 Sample Preparation
🔬 Cell Lines
🏭 Microscope Brands
🧪 Reagent Suppliers
📷 Detectors
🎨 Filters
💻 Software Details
🏛️ Research Organizations (ROR)
Affiliated research institutions:
📋 Methods
Materials Recombinant hCG and LH were purchased from National Peptides and Hormones Program (c/o A. F. Parlow, Harbor-UCLA Medical Center). For PALM studies, CAGE 500 and 552 N -hydroxysuccinimide esters for antibody conjugation and direct labeling of receptors were purchased from Abberior.
Primary antibodies
HA.11 and FLAG were purchased from Covance and Sigma, respectively. For BRET and pRL-cmv luciferase reporter assays, coelentrazine h and coelentrazine, respectively, were purchased from Promega. For cre-luc reporter gene assays, SteadyLite was purchased from PerkinElmer Life Sciences. Fluo-4 direct for calcium imaging was obtained from Invitrogen and HTRF-IP 1 assay from CisBio.
DNA Constructs Plasmid
DNA expressing N-terminally HA-tagged WT LHR, HA-tagged LHR B− , and FLAG-tagged LHR S− were generated as described previously ( 10 ). For control PD-PALM experiments, N-terminally FLAG-tagged M-CSF receptor was provided courtesy of N. Dibb, Imperial College London, UK. For BRET studies, plasmid DNA encoding Renilla luciferase 8 (Rluc8) was kindly provided by S. Gambhir (Stanford School of Medicine), and C-terminally Rluc8-tagged WT LHR, LHR B− , and LHR S− were generated by PCR to remove the stop codon and subcloning of the receptors into pcDNA3.1 plasmid containing Rluc8. All constructs were confirmed by sequencing.
Plasmid DNA encoding the Gα s and Gα q
BRET-tagged construct and the untagged Gβ 1 and untagged Gγ 2 were kindly provided by J. Javitch (Columbia School of Medicine, New York) and were generated and validated as described previously ( 12 , 19 ). The mVenus was utilized for BRET assays, courtesy of A. Miyawaki (RIKEN Brain Science Institute, Japan). cAMP-response element-luciferase (cre-luc) was used for cAMP reporter gene assays, and pRL-CMV transfection control plasmid was purchased from Promega. Cell Culture and Transfections HEK 293 cells were maintained and cultured as described previously ( 20 ). All functional studies were conducted using cell lines stably expressing either HA-WT LHR, HA-LHR B− , FLAG-LHR S− , or co-expressing HA-LHR B− and FLAG-LHR S− . These stable cell lines were generated through Lipofectamine 2000® (Invitrogen)-mediated transfection of the relevant plasmid DNAs, G418 selection, and assessment of cell surface receptor expression by flow cytometry (FACSCalibur, BD Biosciences). All transient transfections were carried out using Lipofectamine 2000® as per the manufacturer's instructions and assayed 48 h post-transfection. BRET- Constitutive and ligand-induced receptor-G protein interactions were assessed by BRET 1 , as described previously ( 12 ). Briefly, cells were washed and harvested in PBS and seeded at a density of ∼200,000 cells/well into 96-well plates. To measure constitutive G protein receptor association, coelentrazine h (5 μ m ) was added, and BRET luminescence and fluorescence ratios were recorded at 475/535 nm for a total of 10 cycles using a FLUOstar (BMG). In parallel cells, fluorescence of the mVenus-tagged Gα s or Gα q protein constructs was determined. For ligand-induced BRET changes, coelentrazine h substrate was added, and the BRET ratio at 475 nm/535 nm was recorded for 1 min. Following this, ligand was added, and the BRET ratio was immediately recorded for a further 1 min. BRET signals were calculated by the dividing the values at 535 nm over that omitted at 475 nm. For constitutive receptor-G protein associations, net BRET values were obtained by subtracting the basal BRET ratio of receptor-tagged Rluc8 alone from all readings. The ligand-induced net BRET changes were calculated by subtracting basal readings from stimulated conditions and further subtracting any changes observed with PBS control. For constitutive receptor-G protein association, duplicate readings were taken, and at least three independent experiments were carried out. For ligand-induced BRET changes, triplicate readings were taken, and 6–11 independent experiments were conducted. Signaling Assays cre-luc assays were conducted as described previously ( 10 , 20 ). IP 1 accumulation was determined using an IP-One HTRF assay kit (CisBio) and measured using a BMG PHERAstar plate reader with HTRF filters. To monitor Ca 2+ mobilization, Fluo-4 Direct (Invitrogen) labeling was employed as per the manufacturer's instructions, and time-resolved Ca 2+ mobilization was measured using confocal microscopy. Briefly, cells were loaded with calcium dye for 30 min at 37 °C followed by incubation at room temperature for a further 30 min. Cells were imaged using a TCS-SP5 confocal microscope (Leica) with a ×20 dry objective. Cells were imaged for ∼1 min before agonist treatment, 10 min after agonist addition, and capturing every 1.2 s. Time-lapse movies were analyzed with the Leica LASAF software. PD-PALM HA.11 and FLAG primary antibodies were labeled with CAGE 552 and CAGE 500 photoswitchable dyes as per manufacturer's instructions (Abberior). Using a derivation of Beer-Lambert Law ( A = ϵ C.D.), the degree of labeling efficiency was determined for FLAG-CAGE 500 to be 1.0 ± 0.2 dye molecules per antibody and for HA.11-CAGE 552 to be 1.3 ± 0.1 dye molecules per antibody, as per manufacturer's instructions. Cells were plated onto 8-chamber well 1.5 borosilicate coverglass (Labtek) slides. For assessment of basal cell surface receptor molecules, cells were incubated with caged fluorophore-labeled HA.11-CAGE 552/FLAG-CAGE 500 antibodies for direct labeling of receptors in 10% FCS in PBS, at 37 °C, with antibody for 30 min. Cells were washed with PBS and fixed in 4% paraformaldehyde with 0.2% glutaraldehyde for 30 min. The addition of 0.2% glutaraldehyde has been previously shown to dramatically reduce lateral diffusion of transmembrane receptors within the cell membrane, minimizing antibody-induced clustering artifacts that other fixatives can produce ( 21 , 22 ). Additionally, this fixative method has been previously shown to yield the same minimal clustering artifacts (∼4%) when compared with a nonclustering control ( 23 ). Following fixation, cells were washed in PBS and maintained in PBS for imaging. All labeling of receptors was carried out in the dark to ensure minimal photo-switching of labels. Images were acquired using an inverted Axiovert 200 manual inverted wide-field fluorescent microscope (Zeiss, Germany) fitted with a commercial TIRF condenser kit (TILL Photonics GmbH, Germany), with a 1.45 numerical aperture ×100 oil immersion objective. Photo-conversion of CAGE 500 and 552 dyes was achieved with a polychrome light source at 390 nm (Polychrome IV, TILL Photonics GmbH, Uckfield, UK) and was simultaneously imaged and photo-bleached by 491 and 561 nm laser lines, respectively. As the two laser lines have the same optical path through achromatic lenses, chromatic aberrations were negligible. Simultaneous dual channel imaging of CAGE 500 and 552 dyes was achieved using a beam splitter (Optisplit II, Andor) fitted with a T585lp dichroic and ET520-40 and ET632-60 emission filters (all Chroma). The microscope was contained in a plastic draft-proof enclosure maintained at a constant temperature of 25 °C and mounted on a vibration isolation table (Speirs Robertson Corp.). Laser lines were switched on at least 1 h prior to imaging to allow acclimatization and stabilization of the system. These measures served to ensure minimal sample drift throughout the experiments. Each PD-PALM time series was acquired using a cooled electron multiplying charged coupled device camera (EM-CCD; C9100-13, Hamamatsu) and Simple PCI software, with an exposure time of 30 ms. The use of an EM-CCD camera provided a homogeneous image in both imaged channels, also ensuring the integrity of images obtained. Bleed through between the 491- and 561-nm imaged channels was assessed using singly expressing FLAG-LHR S− and HA-LHR B− , labeled with CAGE 500 and CAGE 552, and determined to be 3.5 ± 1.0 and 4.3 ± 1.1, respectively. Bright field images of each series were acquired at 108.5-ms exposure and grid images used for post-acquisition alignment of the simultaneously imaged CAGE 500 and 552 channels using Fiji software.
Show full methods section
Materials Recombinant hCG and LH were purchased from National Peptides and Hormones Program (c/o A. F. Parlow, Harbor-UCLA Medical Center). For PALM studies, CAGE 500 and 552 N -hydroxysuccinimide esters for antibody conjugation and direct labeling of receptors were purchased from Abberior.
Primary antibodies
HA.11 and FLAG were purchased from Covance and Sigma, respectively. For BRET and pRL-cmv luciferase reporter assays, coelentrazine h and coelentrazine, respectively, were purchased from Promega. For cre-luc reporter gene assays, SteadyLite was purchased from PerkinElmer Life Sciences. Fluo-4 direct for calcium imaging was obtained from Invitrogen and HTRF-IP 1 assay from CisBio.
DNA Constructs Plasmid
DNA expressing N-terminally HA-tagged WT LHR, HA-tagged LHR B− , and FLAG-tagged LHR S− were generated as described previously ( 10 ). For control PD-PALM experiments, N-terminally FLAG-tagged M-CSF receptor was provided courtesy of N. Dibb, Imperial College London, UK. For BRET studies, plasmid DNA encoding Renilla luciferase 8 (Rluc8) was kindly provided by S. Gambhir (Stanford School of Medicine), and C-terminally Rluc8-tagged WT LHR, LHR B− , and LHR S− were generated by PCR to remove the stop codon and subcloning of the receptors into pcDNA3.1 plasmid containing Rluc8. All constructs were confirmed by sequencing.
Plasmid DNA encoding the Gα s and Gα q
BRET-tagged construct and the untagged Gβ 1 and untagged Gγ 2 were kindly provided by J. Javitch (Columbia School of Medicine, New York) and were generated and validated as described previously ( 12 , 19 ). The mVenus was utilized for BRET assays, courtesy of A. Miyawaki (RIKEN Brain Science Institute, Japan). cAMP-response element-luciferase (cre-luc) was used for cAMP reporter gene assays, and pRL-CMV transfection control plasmid was purchased from Promega. Cell Culture and Transfections HEK 293 cells were maintained and cultured as described previously ( 20 ). All functional studies were conducted using cell lines stably expressing either HA-WT LHR, HA-LHR B− , FLAG-LHR S− , or co-expressing HA-LHR B− and FLAG-LHR S− . These stable cell lines were generated through Lipofectamine 2000® (Invitrogen)-mediated transfection of the relevant plasmid DNAs, G418 selection, and assessment of cell surface receptor expression by flow cytometry (FACSCalibur, BD Biosciences). All transient transfections were carried out using Lipofectamine 2000® as per the manufacturer's instructions and assayed 48 h post-transfection. BRET- Constitutive and ligand-induced receptor-G protein interactions were assessed by BRET 1 , as described previously ( 12 ). Briefly, cells were washed and harvested in PBS and seeded at a density of ∼200,000 cells/well into 96-well plates. To measure constitutive G protein receptor association, coelentrazine h (5 μ m ) was added, and BRET luminescence and fluorescence ratios were recorded at 475/535 nm for a total of 10 cycles using a FLUOstar (BMG). In parallel cells, fluorescence of the mVenus-tagged Gα s or Gα q protein constructs was determined. For ligand-induced BRET changes, coelentrazine h substrate was added, and the BRET ratio at 475 nm/535 nm was recorded for 1 min. Following this, ligand was added, and the BRET ratio was immediately recorded for a further 1 min. BRET signals were calculated by the dividing the values at 535 nm over that omitted at 475 nm. For constitutive receptor-G protein associations, net BRET values were obtained by subtracting the basal BRET ratio of receptor-tagged Rluc8 alone from all readings. The ligand-induced net BRET changes were calculated by subtracting basal readings from stimulated conditions and further subtracting any changes observed with PBS control. For constitutive receptor-G protein association, duplicate readings were taken, and at least three independent experiments were carried out. For ligand-induced BRET changes, triplicate readings were taken, and 6–11 independent experiments were conducted. Signaling Assays cre-luc assays were conducted as described previously ( 10 , 20 ). IP 1 accumulation was determined using an IP-One HTRF assay kit (CisBio) and measured using a BMG PHERAstar plate reader with HTRF filters. To monitor Ca 2+ mobilization, Fluo-4 Direct (Invitrogen) labeling was employed as per the manufacturer's instructions, and time-resolved Ca 2+ mobilization was measured using confocal microscopy. Briefly, cells were loaded with calcium dye for 30 min at 37 °C followed by incubation at room temperature for a further 30 min. Cells were imaged using a TCS-SP5 confocal microscope (Leica) with a ×20 dry objective. Cells were imaged for ∼1 min before agonist treatment, 10 min after agonist addition, and capturing every 1.2 s. Time-lapse movies were analyzed with the Leica LASAF software. PD-PALM HA.11 and FLAG primary antibodies were labeled with CAGE 552 and CAGE 500 photoswitchable dyes as per manufacturer's instructions (Abberior). Using a derivation of Beer-Lambert Law ( A = ϵ C.D.), the degree of labeling efficiency was determined for FLAG-CAGE 500 to be 1.0 ± 0.2 dye molecules per antibody and for HA.11-CAGE 552 to be 1.3 ± 0.1 dye molecules per antibody, as per manufacturer's instructions. Cells were plated onto 8-chamber well 1.5 borosilicate coverglass (Labtek) slides. For assessment of basal cell surface receptor molecules, cells were incubated with caged fluorophore-labeled HA.11-CAGE 552/FLAG-CAGE 500 antibodies for direct labeling of receptors in 10% FCS in PBS, at 37 °C, with antibody for 30 min. Cells were washed with PBS and fixed in 4% paraformaldehyde with 0.2% glutaraldehyde for 30 min. The addition of 0.2% glutaraldehyde has been previously shown to dramatically reduce lateral diffusion of transmembrane receptors within the cell membrane, minimizing antibody-induced clustering artifacts that other fixatives can produce ( 21 , 22 ). Additionally, this fixative method has been previously shown to yield the same minimal clustering artifacts (∼4%) when compared with a nonclustering control ( 23 ). Following fixation, cells were washed in PBS and maintained in PBS for imaging. All labeling of receptors was carried out in the dark to ensure minimal photo-switching of labels. Images were acquired using an inverted Axiovert 200 manual inverted wide-field fluorescent microscope (Zeiss, Germany) fitted with a commercial TIRF condenser kit (TILL Photonics GmbH, Germany), with a 1.45 numerical aperture ×100 oil immersion objective. Photo-conversion of CAGE 500 and 552 dyes was achieved with a polychrome light source at 390 nm (Polychrome IV, TILL Photonics GmbH, Uckfield, UK) and was simultaneously imaged and photo-bleached by 491 and 561 nm laser lines, respectively. As the two laser lines have the same optical path through achromatic lenses, chromatic aberrations were negligible. Simultaneous dual channel imaging of CAGE 500 and 552 dyes was achieved using a beam splitter (Optisplit II, Andor) fitted with a T585lp dichroic and ET520-40 and ET632-60 emission filters (all Chroma). The microscope was contained in a plastic draft-proof enclosure maintained at a constant temperature of 25 °C and mounted on a vibration isolation table (Speirs Robertson Corp.). Laser lines were switched on at least 1 h prior to imaging to allow acclimatization and stabilization of the system. These measures served to ensure minimal sample drift throughout the experiments. Each PD-PALM time series was acquired using a cooled electron multiplying charged coupled device camera (EM-CCD; C9100-13, Hamamatsu) and Simple PCI software, with an exposure time of 30 ms. The use of an EM-CCD camera provided a homogeneous image in both imaged channels, also ensuring the integrity of images obtained. Bleed through between the 491- and 561-nm imaged channels was assessed using singly expressing FLAG-LHR S− and HA-LHR B− , labeled with CAGE 500 and CAGE 552, and determined to be 3.5 ± 1.0 and 4.3 ± 1.1, respectively. Bright field images of each series were acquired at 108.5-ms exposure and grid images used for post-acquisition alignment of the simultaneously imaged CAGE 500 and 552 channels using Fiji software.
Localization Analysis
Localization of receptors detected in 491- and 561-nm channels was individually determined using QuickPALM Fiji plugin ( 24 ). Fluorescent intensity images of cropped nonoverlapping areas of 7 × 7 μm within cell borders from corresponding 491- and 561-nm imaged channels were analyzed using the following parameters: a pixel size of 155 nm, a full-width half-maximum value of 3, and signal to noise ratio of 8. Particles were detected if the signal to noise ratio exceeded 8 and full-width half-maximum was 3 pixels or less. Analyzed areas did not span cell membranes to exclude any potential biasing resulting from edge effects. Data tables containing x-y particle localization coordinates were generated, and two-dimensional coordinates were determined. To analyze the number of associated receptor molecules from the x-y particle localization coordinates, a custom Java application was designed (PD-Interpreter). The individual files generated using QuickPALM containing localization coordinates of each identified molecule observed in the 491 and 561 nm fields were plotted as an image. A second order Getis Franklin neighborhood analysis was conducted, using a search radius of 50 nm, to determine the degree of both homomeric associations ( i.e. homo-associating WT LHR, LHR B− , or LHR S− protomers) within an individual channel and asymmetric heteromeric associations ( i.e. LHR B− associating with LHR S− ) across channels. The analysis worked upon the principle of quantitating the number of molecule(s) within a 50-nm radius of a single identified molecule. To identify dimers and oligomers, the program recursively searched at a 50-nm radius from each associating molecule until no further associating molecules were identified within the allotted search radius ( Fig. 1 , a and c ). Once an associating group of molecules was assigned, the composition of the di/oligomer was identified and omitted from further searches, so that molecules were not double counted. Data were represented in the form of co-localization plots using differential colors to distinguish 491 and 561 channels and heat maps, with individual colors depicting different numbers of associating molecules. Because of the irreversible photoactivating nature of the CAGE PDs, minimal re-activation or photoblinking of the PDs was observed. However, to discount any potential overestimation of di/oligomers, events within the same channel within a radius of 10 nm of a “parent” activated fluorophore (accounting for a localization precision of 20 nm) were discounted from the analysis. This typically resulted in discounting approximately
📊 Figures
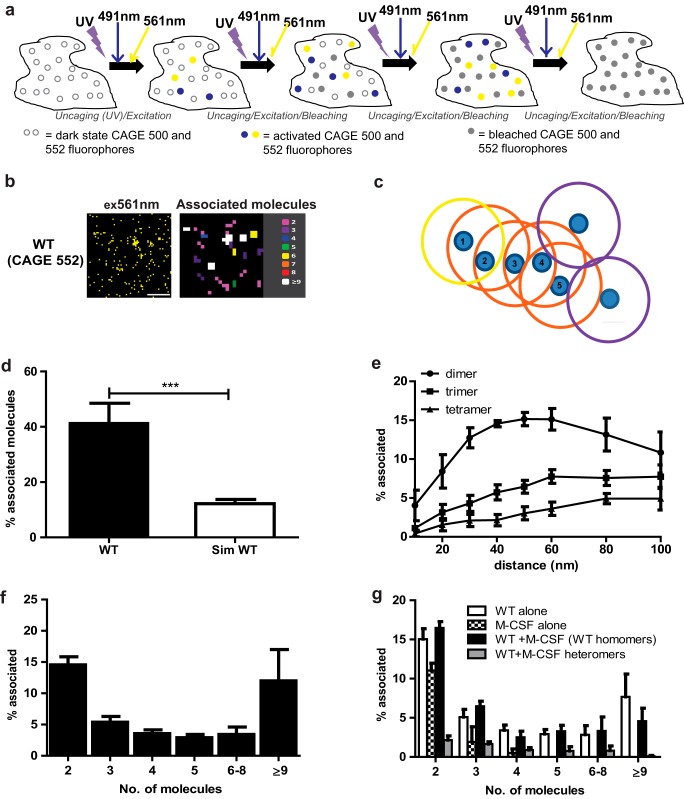
FIGURE 1.
Visualization of single WT LHR molecules within dimers and oligomers using PD-PALM. a, principles of PD-PALM, utilizing simultaneous dual-color imaging of CAGE 500- and 552-labeled receptors. CAGE 500...
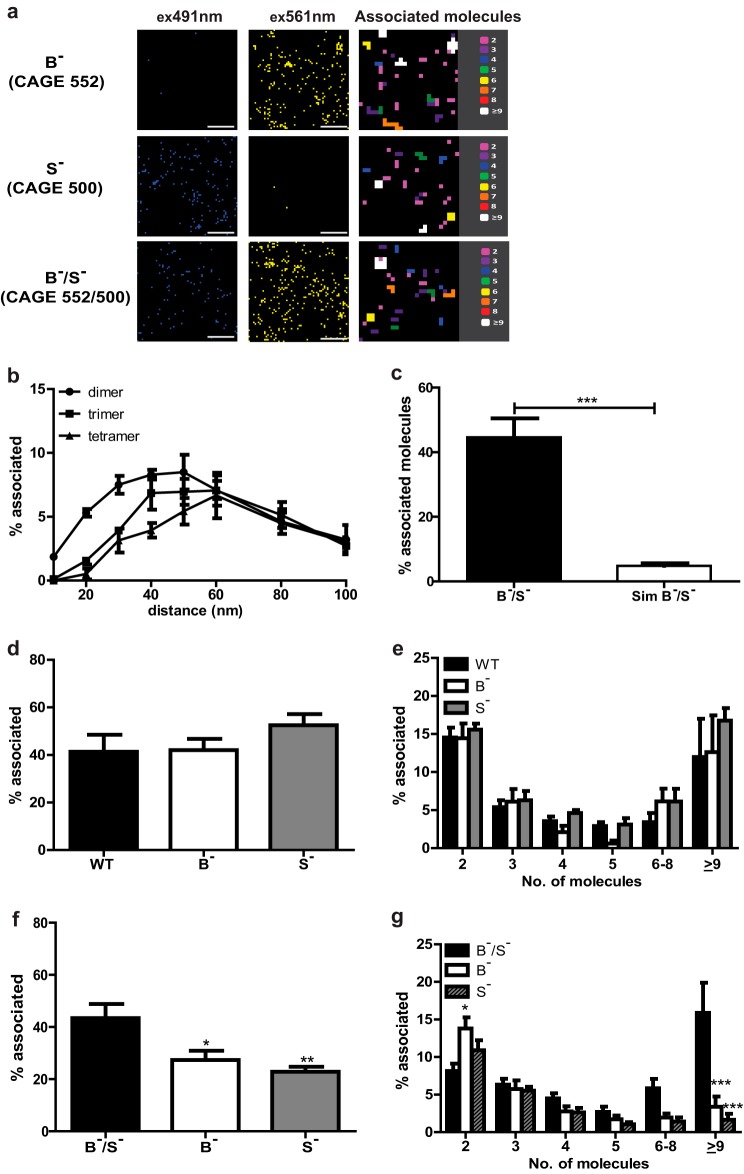
FIGURE 2.
Visualization of LHR Bu2212 /LHR Su2212 dimers and oligomers using PD-PALM. a, representative reconstructed PD-PALM images in 491- and 561-nm channels of singly expressed LHR Bu2212 (B u2212 ), LHR Su...
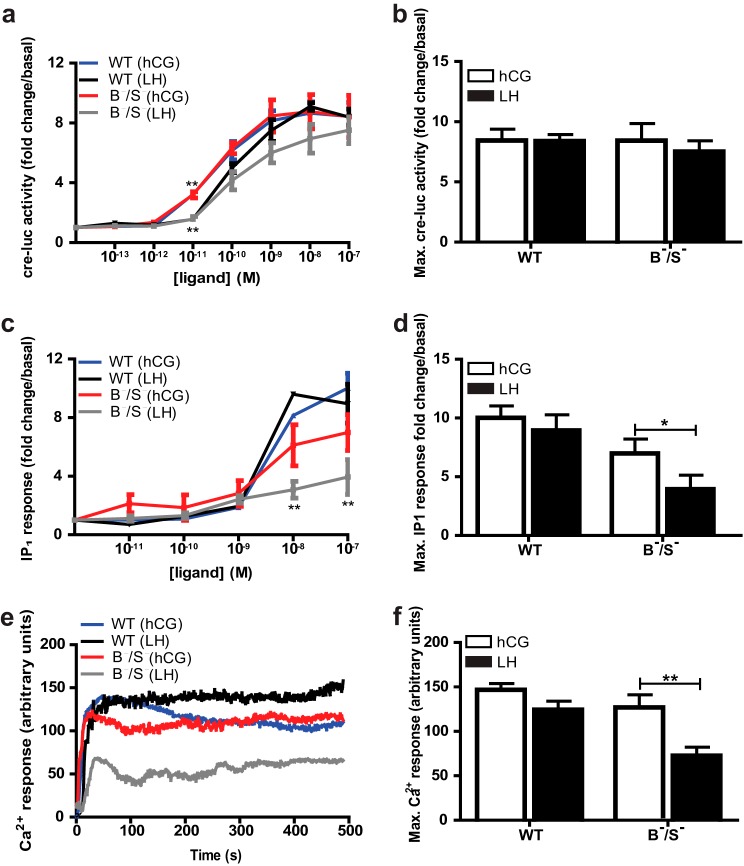
FIGURE 3.
Intermolecular cooperation of LHR is sufficient to fully activate hCG but not LH-mediated G protein signaling. a, HEK 293 cells stably expressing WT LHR ( WT ) or LHR Bu2212 /LHR Su2212 (B u2212 /S u2...
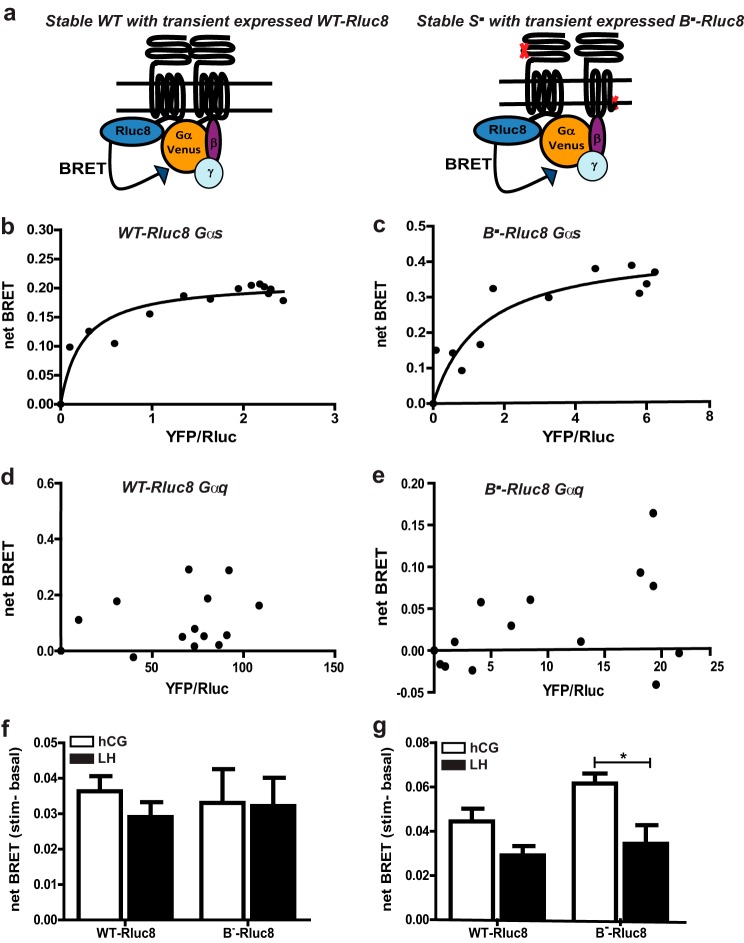
FIGURE 4.
Constitutive and ligand-induced BRET between WT LHR or LHRB u2212 with either Gu03b1 q or Gu03b1 s proteins. a, schematic showing the experimental design of receptor-G protein associations. Gu03b1 pro...
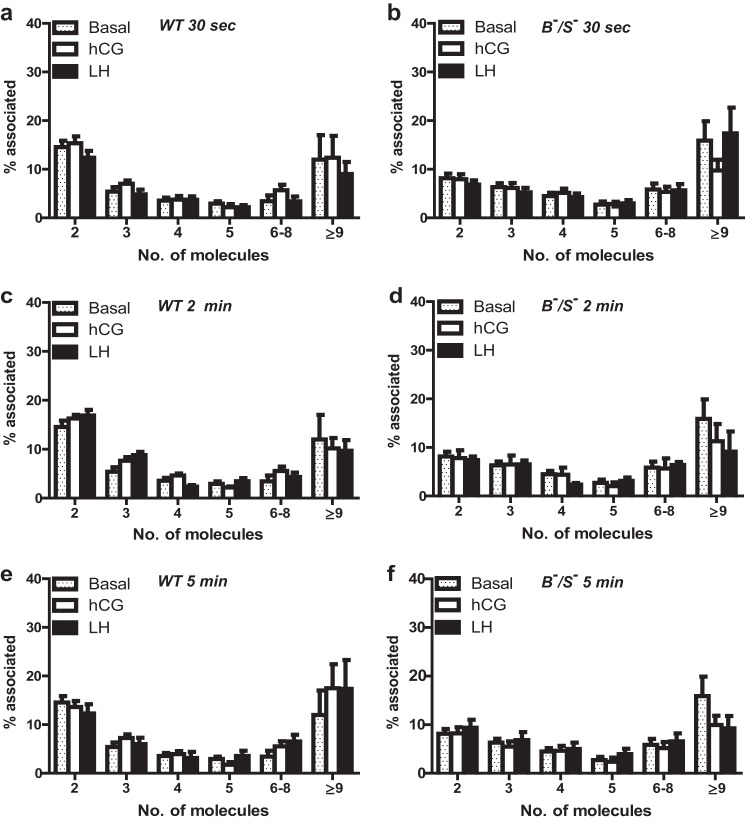
FIGURE 5.
Organization of WT LHR and LHR Bu2212 /LHR Su2212 complexes following ligand treatment. Cells stably expressing either WT LHR or LHR Bu2212 /LHR Su2212 were treated with hCG and LH (both 10 n m ) foll...
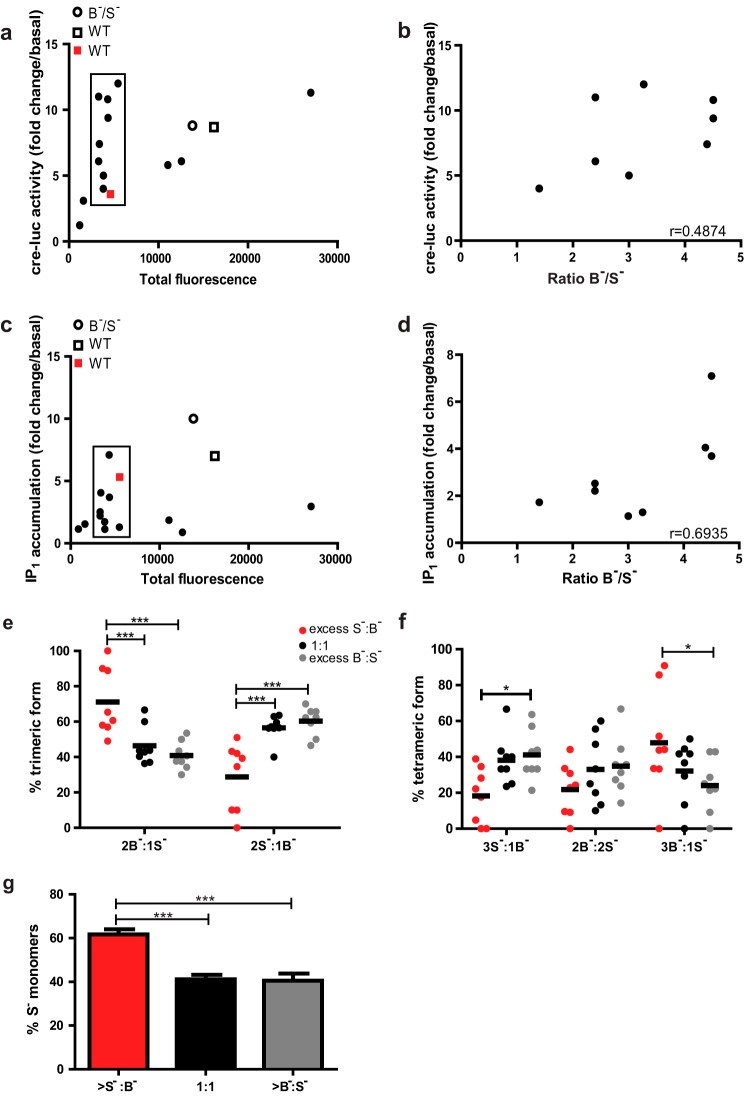
FIGURE 6.
Ratiometric molecular composition of LHR Bu2212 to LHR Su2212 impacts signal sensitivity and oligomeric composition. Comparison of hCG-dependent cre-luc activity ( a ) and IP 1 accumulation ( b ) in c...
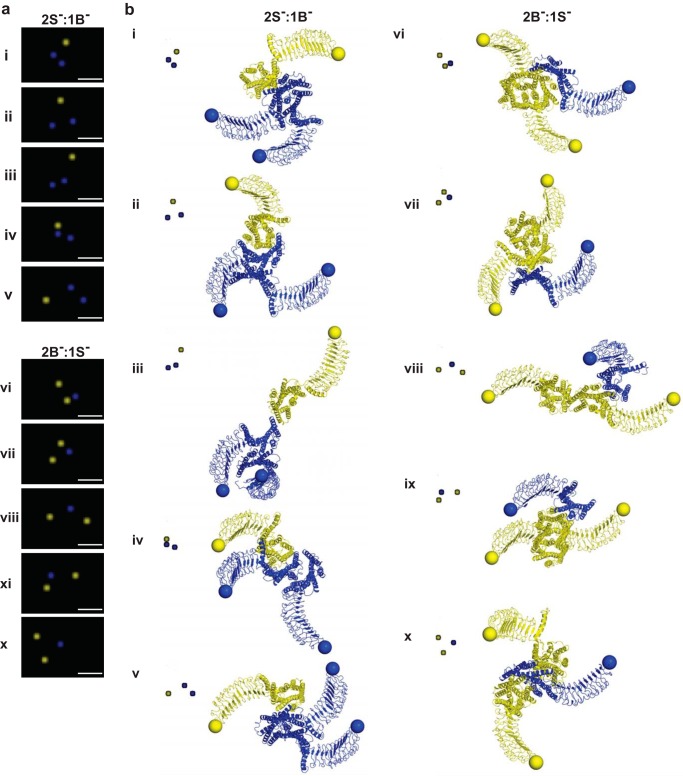
FIGURE 7.
PD-PALM imaging and structural modeling of functionally asymmetric trimeric complexes. a, representative PD-PALM images showing spatial arrangements of LHR Bu2212 ( yellow ) and LHR Su2212 ( blue ); s...
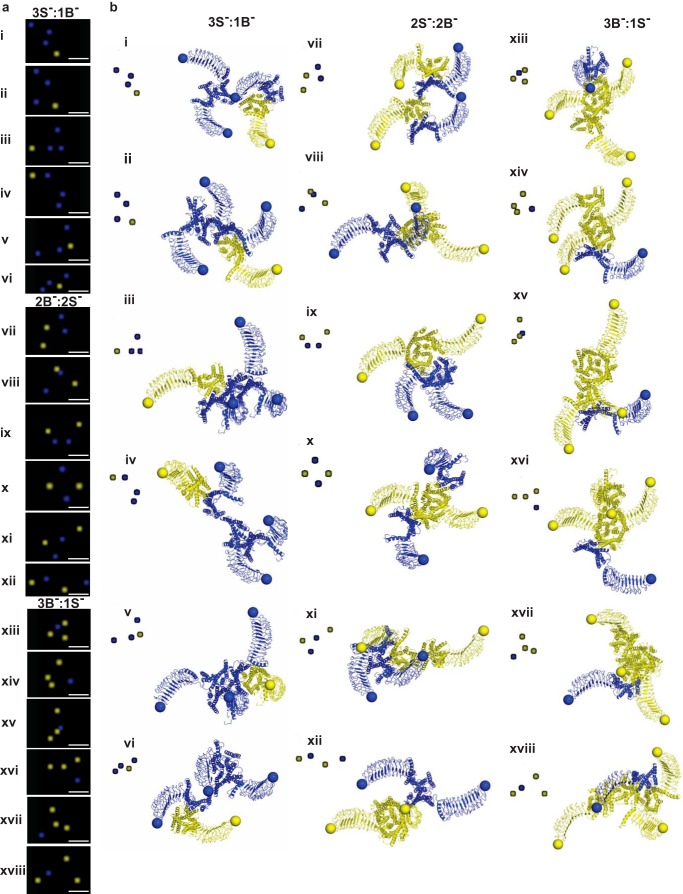
FIGURE 8.
PD-PALM imaging and structural modeling of functionally asymmetric tetrameric complexes. a, representative PD-PALM images showing spatial arrangements of LHR Bu2212 and LHR Su2212 . Scale bars, 50 nm....
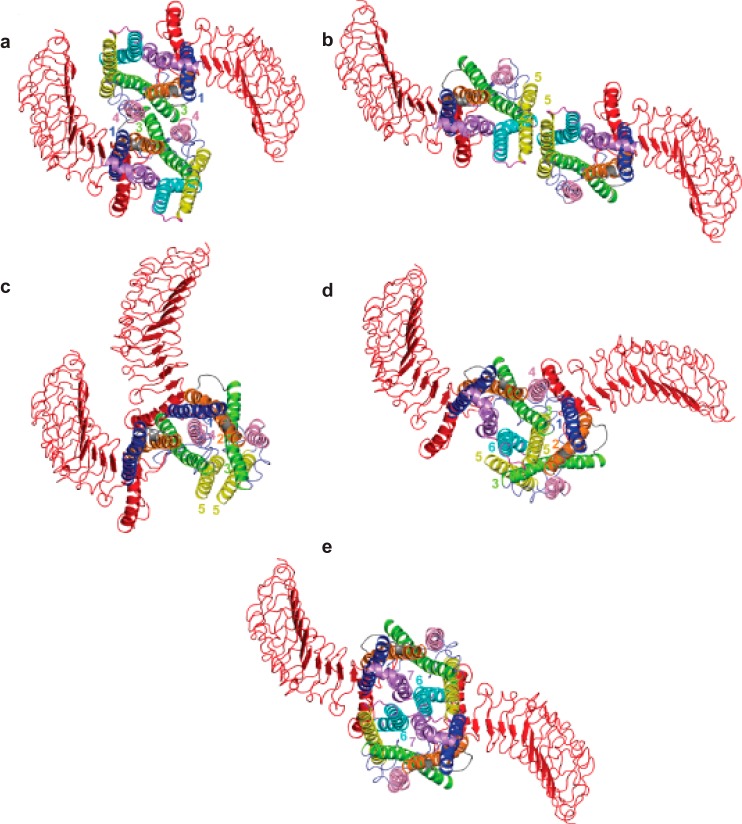
FIGURE 9.
Multiple interfaces mediate LHR di/oligomeric formation. Computational modeling demonstrating potential homo- and heterodimer interfaces, with interfaces in H4-H1 and H3 ( a ) and H5 contacts ( b ), c...
Figure images are served from the NIH/NLM PubMed Central Open Access Subset or Europe PMC; copyright remains with the publishers and authors.
💬 Discussion
0 commentsNo comments yet. Be the first to start a discussion!
Leave a Comment