Abstract
Many lines of evidence suggest that memory in the mammalian brain is stored with distinct spatiotemporal patterns. Despite recent progresses in identifying neuronal populations involved in memory coding, the synapse-level mechanism is still poorly understood. Computational models and electrophysiological data have shown that functional clustering of synapses along dendritic branches leads to nonlinear summation of synaptic inputs and greatly expands the computing power of a neural network. However, whether neighbouring synapses are involved in encoding similar memory and how task-specific cortical networks develop during learning remain elusive. Using transcranial two-photon microscopy, we followed apical dendrites of layer 5 pyramidal neurons in the motor cortex while mice practised novel forelimb skills. Here we show that a third of new dendritic spines (postsynaptic structures of most excitatory synapses) formed during the acquisition phase of learning emerge in clusters, and that most such clusters are neighbouring spine pairs. These clustered new spines are more likely to persist throughout prolonged learning sessions, and even long after training stops, than non-clustered counterparts. Moreover, formation of new spine clusters requires repetition of the same motor task, and the emergence of succedent new spine(s) accompanies the strengthening of the first new spine in the cluster. We also show that under control conditions new spines appear to avoid existing stable spines, rather than being uniformly added along dendrites. However, succedent new spines in clusters overcome such a spatial constraint and form in close vicinity to neighbouring stable spines. Our findings suggest that clustering of new synapses along dendrites is induced by repetitive activation of the cortical circuitry during learning, providing a structural basis for spatial coding of motor memory in the mammalian brain.
🔬 Techniques
💻 Software
✨ Fluorophores
💻 Software Details
💾 Data Repositories
🏛️ Research Organizations (ROR)
Affiliated research institutions:
📋 Methods
SUMMARY YFP-H line mice 14 expressing yellow fluorescent protein in a small subset of cortical neurons were used in all the experiments. Mice of both sexes were trained with different motor skill tasks or housed in a motor enriched environment, starting at one month of age (see Methods). The procedure for transcranial two-photon imaging and quantification of spine dynamics have been described previously 11 , 15 . ImageJ was used to measure spine head size, as well as inter-spine distances. Simulation was performed with custom-written codes in Matlab (MathWorks, Natick, MA) and statistical analyses were performed using GraphPad Prism 5 (GraphPad Software Inc., La Jolla, CA) (see Methods). All data were presented as mean ± standard error of mean (s.e.m.). P -values were calculated using the Mann-Whitney U test for independent samples, and the Wilcoxon signed-rank test for paired samples.
METHODS
Experimental animals Thy1 -YFP-H line mice were obtained from the Jackson Laboratory. Mice were group-housed and bred in the UCSC animal facility, with all experiments performed in accordance with approved animal protocols. Motor skill training and motor enrichment Both the mouse single-seed reaching task and capellini-handling task protocols have been previously described 15 . “Motor enriched” mice were reared in groups of 8–12 in large cages (90 cm×25 cm×15 cm) containing various toys, such as ropes, ladders, chains, hanging mesh/bars and etc ., all of which require substantial motor coordination. The nature of toys was changed on a daily basis. Control mice were housed in standard mouse cages, with up to 5 mice per cage.
Show full methods section
SUMMARY YFP-H line mice 14 expressing yellow fluorescent protein in a small subset of cortical neurons were used in all the experiments. Mice of both sexes were trained with different motor skill tasks or housed in a motor enriched environment, starting at one month of age (see Methods). The procedure for transcranial two-photon imaging and quantification of spine dynamics have been described previously 11 , 15 . ImageJ was used to measure spine head size, as well as inter-spine distances. Simulation was performed with custom-written codes in Matlab (MathWorks, Natick, MA) and statistical analyses were performed using GraphPad Prism 5 (GraphPad Software Inc., La Jolla, CA) (see Methods). All data were presented as mean ± standard error of mean (s.e.m.). P -values were calculated using the Mann-Whitney U test for independent samples, and the Wilcoxon signed-rank test for paired samples.
METHODS
Experimental animals Thy1 -YFP-H line mice were obtained from the Jackson Laboratory. Mice were group-housed and bred in the UCSC animal facility, with all experiments performed in accordance with approved animal protocols. Motor skill training and motor enrichment Both the mouse single-seed reaching task and capellini-handling task protocols have been previously described 15 . “Motor enriched” mice were reared in groups of 8–12 in large cages (90 cm×25 cm×15 cm) containing various toys, such as ropes, ladders, chains, hanging mesh/bars and etc ., all of which require substantial motor coordination. The nature of toys was changed on a daily basis. Control mice were housed in standard mouse cages, with up to 5 mice per cage.
Surgical procedure for in vivo transcranial imaging
The procedure for transcranial two-photon imaging has been described previously 11 , 31 . Trained mice were imaged immediately following each training session.
Data quantification
All analyses of spine dynamics were done using ImageJ software, blinded with regard to experimental conditions. Quantification criteria of dendritic spines have been described previously 15 . All dendritic protrusions were tracked manually in 3D stacks to ensure the consistency of protrusion identification across imaging sessions, despite possible tissue movement or rotation. The number and location of dendritic protrusions (defined as protrusion length larger than 1/3 of dendritic shaft diameter) were identified in each view. Filopodia were identified as long thin structures with the ratio of head diameter to neck diameter being smaller than 1.2 and the ratio of length to neck diameter being larger than 3. The remaining protrusions were classified as spines. Formation and elimination of spines and filopodia were determined by comparing images collected at two different time points. Spines or filopodia were considered identical between the two images, if they were within 0.7 μm of their expected positions, based on their spatial relationship to adjacent landmarks and/or their positions relative to immediately adjacent spines. A stable spine is defined as a spine that was present in both images. A new spine is a spine that appeared in a subsequent image but was absent from the initial image. Percentages of formed and eliminated spines (or dendritic protrusions) were normalized to the number of spines (or dendritic protrusions) in the initial image. Spine diameter analyses have been previously described 11 . Because imaging and animal conditions varied over time, the ratio of the spine head diameter to the adjacent dendritic shaft diameter was used as the normalized spine head diameter. Measurement of spine head intensity, as described previously 32 , was also performed to confirm these spine size results. Briefly, we determined the signal intensity (defined as the sum intensity of all pixels composing the spine in the best focal plane) and subtracted the background intensity (defined as the sum intensity of a region composed of the same number of pixels as the spine but with no YFP-labeled structure). The difference was then divided by the mean intensity of the adjacent dendritic shaft (defined similarly as the difference between the mean signal intensity of the shaft and the mean background intensity) in order to correct for varying imaging conditions. The final value is termed “integrated spine brightness.” All distance measurements were done in ImageJ. In order to simulate spine formation, we first obtained the relative location of stable spines by measuring inter-spine distances along traced dendrites in 7 control animals, and concatenated dendritic segments from each animal into a single “synthetic dendrite.” We then used custom-written Matlab codes to simulate the addition of new spines. As we observed, two spines can extend from the same linear location along the dendritic segment and point towards different directions, given the cylindrical shape of dendrites. In our analysis and simulation, we made the simplifying approximation that the dendritic segment is one-dimensional rather than a tube. Therefore, zero inter-spine distance in our analysis represents two spines overlapping in linear position but actually located at different sites around the circumference of the dendritic segment. In each round of simulation, the same number of new spines as observed in experiments were generated independently and uniformly along synthetic dendrites. The distance between each new spine and its nearest stable spine (D n-s ) was calculated. The simulation was repeated 1,000 times and the resultant data were pooled together to compute the simulated sample median and the cumulative probability curve. All data were presented as mean ± standard error of mean (s.e.m.). P -values were calculated using the Mann-Whitney U test for independent samples, and the Wilcoxon signed-rank test for paired samples.
Experimental animals Thy1 -YFP-H line mice were obtained from the Jackson Laboratory. Mice were group-housed and bred in the UCSC animal facility, with all experiments performed in accordance with approved animal protocols.
Surgical procedure for in vivo transcranial imaging
The procedure for transcranial two-photon imaging has been described previously 11 , 31 . Trained mice were imaged immediately following each training session.
Supplementary Material 1
📊 Figures
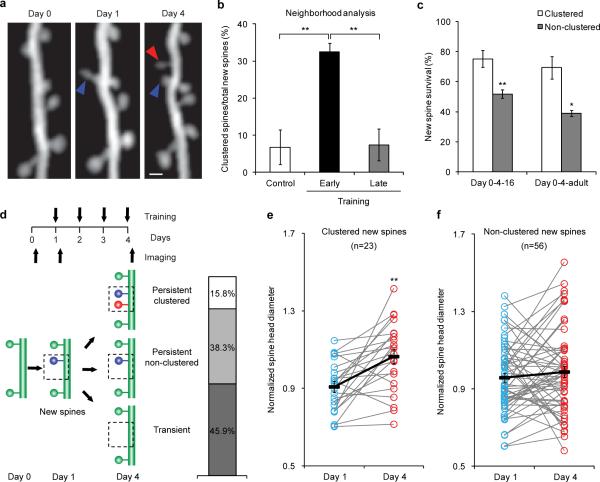
Figure 1
Acquisition of a novel motor skill induces formation of spine clusters
a , Repeated imaging of the same dendritic branch during motor learning reveals that a second new spine that formed between days 1 and 4 (red arrowhead) is located next to a stabilized new spine that ...
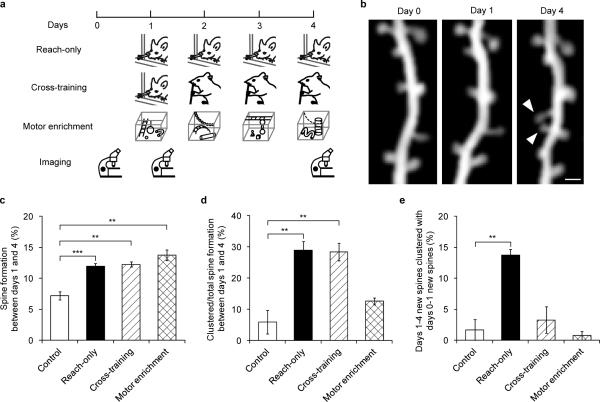
Figure 2
Clustered new spines form over multiple training sessions of the same, but not different, motor tasks
a , Timelines of reach-only, cross-training and motor enrichment experiments. b , Repeated imaging of the same dendritic branch revealed that two neighboring new spines (arrowhead) formed between days...
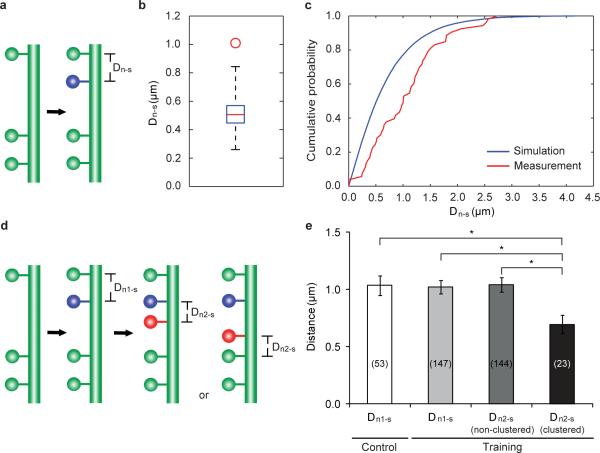
Figure 3
The spatial distribution of new spines along dendrites
a , A schematic illustrating the measurement of D n-s . b , The median of measured D n-s s (the red circle) is significantly larger than that of simulated D n-s s (box plot of results from 1000 simula...
Figure images are served from the NIH/NLM PubMed Central Open Access Subset or Europe PMC; copyright remains with the publishers and authors.
💬 Discussion
0 commentsNo comments yet. Be the first to start a discussion!
Leave a Comment