Abstract
Mitochondria play a key role in oncogenesis and constitute one of the most important targets for cancer treatments. Although the most effective way to deliver drugs to mitochondria is by covalently linking them to a lipophilic cation, the in vivo delivery of free drugs still constitutes a critical bottleneck. Herein, we report the design of a mitochondria-targeted metal-organic framework (MOF) that greatly increases the efficacy of a model cancer drug, reducing the required dose to less than 1% compared to the free drug and ca. 10% compared to the nontargeted MOF. The performance of the system is evaluated using a holistic approach ranging from microscopy to transcriptomics. Super-resolution microscopy of MCF-7 cells treated with the targeted MOF system reveals important mitochondrial morphology changes that are clearly associated with cell death as soon as 30 min after incubation. Whole transcriptome analysis of cells indicates widespread changes in gene expression when treated with the MOF system, specifically in biological processes that have a profound effect on cell physiology and that are related to cell death. We show how targeting MOFs toward mitochondria represents a valuable strategy for the development of new drug delivery systems.
🔬 Techniques
🔭 Microscopes
💻 Software
✨ Fluorophores
🧪 Sample Preparation
🔬 Cell Lines
🏭 Microscope Brands
🧪 Reagent Suppliers
🔴 Lasers
📷 Detectors
🔎 Objectives
💻 Software Details
🏛️ Research Organizations (ROR)
Affiliated research institutions:
📋 Methods
Materials ZrCl 4 (99.5%) and terephthalic acid (BDC, 98%) were purchased from Alfa Aesar (U.K.). Dichloroacetic acid (≥99%), HCl (37%), 4-carboxybutyl triphenylphosphonium bromide (98%), 3-(diphenylphosphino)propionic acid (97%), 1-bromopyrene (96%), acetic acid (≥99%), dimethylformamide (DMF, 99.8%), methanol (99.9%), and acetone (99.9%) were purchased from Sigma-Aldrich (U.K.). Dulbecco’s modified Eagle’s medium (DMEM), fetal bovine serum (FBS), l -glutamine, penicillin, streptomycin, and CellLight Mitochondria-GFP BacMam 2.0 were purchased from Invitrogen (U.K.). The DRAQ5 stain was purchased from Abcam. Phosphate-buffered saline (PBS), trypsin–EDTA, and Lysotracker-Deep Red were purchased from Life Technologies (U.K.). CellTiter 96 AQueous One Solution Cell Proliferation Assay (MTS) and Caspase-Glow 3/7, 8, and 9 Assay Systems were obtained from Promega (U.K.). All chemicals and biochemicals used were of analytical grade. MCF-7 (ECACC 86012803) and HEK293 (ECACC 85120602) cells were obtained from the ECACC. Synthesis of DCA 5 -TPP 5 -UiO-66 A 10 mL portion of a DMF solution containing BDC (149.6 mg, 0.9 mmol) and TPP (1995 mg, 4.5 mmol) was added to 10 mL of a DMF solution containing ZrCl 4 (209.6 mg, 0.9 mmol) in a 25 mL glass vial. HCl (80 μL, 0.9 mmol) and DCA (275 μL, 4.5 mmol) were added to the mixture. Next, the vials were sealed and put in an oven at 120 °C for 24 h. The resulting powders were collected by centrifugation (5500 rpm, 15 min) and redispersed in 10 mL of DMF, followed by another centrifugation cycle. This two-step washing process was repeated two more times with DMF to remove the unreacted BDC, followed by two washes with methanol to remove the DMF. The collected UiO-66 particles were finally dried at room temperature under a vacuum overnight. The amounts of DCA and TPP incorporated in the structure were determined by ICP-OES.
Show full methods section
Materials ZrCl 4 (99.5%) and terephthalic acid (BDC, 98%) were purchased from Alfa Aesar (U.K.). Dichloroacetic acid (≥99%), HCl (37%), 4-carboxybutyl triphenylphosphonium bromide (98%), 3-(diphenylphosphino)propionic acid (97%), 1-bromopyrene (96%), acetic acid (≥99%), dimethylformamide (DMF, 99.8%), methanol (99.9%), and acetone (99.9%) were purchased from Sigma-Aldrich (U.K.). Dulbecco’s modified Eagle’s medium (DMEM), fetal bovine serum (FBS), l -glutamine, penicillin, streptomycin, and CellLight Mitochondria-GFP BacMam 2.0 were purchased from Invitrogen (U.K.). The DRAQ5 stain was purchased from Abcam. Phosphate-buffered saline (PBS), trypsin–EDTA, and Lysotracker-Deep Red were purchased from Life Technologies (U.K.). CellTiter 96 AQueous One Solution Cell Proliferation Assay (MTS) and Caspase-Glow 3/7, 8, and 9 Assay Systems were obtained from Promega (U.K.). All chemicals and biochemicals used were of analytical grade. MCF-7 (ECACC 86012803) and HEK293 (ECACC 85120602) cells were obtained from the ECACC. Synthesis of DCA 5 -TPP 5 -UiO-66 A 10 mL portion of a DMF solution containing BDC (149.6 mg, 0.9 mmol) and TPP (1995 mg, 4.5 mmol) was added to 10 mL of a DMF solution containing ZrCl 4 (209.6 mg, 0.9 mmol) in a 25 mL glass vial. HCl (80 μL, 0.9 mmol) and DCA (275 μL, 4.5 mmol) were added to the mixture. Next, the vials were sealed and put in an oven at 120 °C for 24 h. The resulting powders were collected by centrifugation (5500 rpm, 15 min) and redispersed in 10 mL of DMF, followed by another centrifugation cycle. This two-step washing process was repeated two more times with DMF to remove the unreacted BDC, followed by two washes with methanol to remove the DMF. The collected UiO-66 particles were finally dried at room temperature under a vacuum overnight. The amounts of DCA and TPP incorporated in the structure were determined by ICP-OES.
Synthesis of fTPP
Synthesis of fTPP was done according to a previously published protocol. 37 1-Bromopyrene (1744 mg, 5.92 mmol) and 3-(diphenylphosphino)propionic acid (2296 mg, 8.88 mmol) were dissolved in 64 mL of toluene and were then left to reflux overnight. The resulting yellow precipitate was hot-filtered, washed once with methanol, and then left to dry in a rotary evaporator, giving rise to a pale yellow solid (3.223 g, 98%). Postsynthetic Attachment of TPP to UiO-66-DCA A 40 mg portion of UiO-66-DCA was dispersed in 20 mL of methanol and sonicated for 5 min. Separately, 40 mg of either 4-carboxybutyl-TPP or fTPP was dissolved in 20 mL of MeOH, and 0.2 mL of triethylamine was added to the mixture. The two solutions were then mixed and left to stir at room temperature overnight. The nanoparticles were collected by centrifugation, washed (×2) with methanol to wash off unattached TPP, and left to dry under a vacuum at room temperature overnight. Powder X-ray Diffraction (PXRD) PXRD measurements were carried out at 298 K using a PANalytical X’Pert PRO diffractometer (λ(Cu Kα) = 1.5418 Å) on a mounted bracket sample stage. Data were collected over the range 5–45°. Thermogravimetric Analysis (TGA) Measurements were carried out using a TA Instruments Q500 Thermogravimetric Analyzer. Measurements were collected from room temperature to 800 °C with a heating rate of 10 °C/min under an air atmosphere. Dynamic Light Scattering Colloidal analysis was performed by dynamic light scattering (DLS) with a Zetasizer Nano ZS potential analyzer equipped with NonInvasive Backscatter optics (NIBS) and a 50 mW laser at 633 nm. ICP-OES Zirconium, chlorine, and phosphorus quantification was performed on a Thermo Scientific iCAP 7400 ICP-OES analyzer against 1 and 10 ppm standards. Nuclear Magnetic Resonance (NMR) Spectroscopy NMR spectra were recorded on either a Bruker AVIII 400 MHz spectrometer or a Bruker AVI 500 MHz spectrometer and referenced to residual solvent peaks. UV–vis/Fluorescence Spectroscopy UV–vis and fluorescence spectra were recorded using a Tecan Spark Multimode Microplate Reader. Scanning Electron Microscopy (SEM) The powder samples were coated with Pd for 150 s using a Polaron SC7640 sputter coater and imaged using a Carl Zeiss Sigma Variable Pressure Analytical SEM with Oxford Microanalysis. Transmission Electron Microscopy (TEM) TEM measurements were carried out on a FEI TECNAI F20 instrument with an acceleration voltage of 200 kV. Samples were prepared by dropcasting a sonicated methanolic suspension on a 400 mesh Cu grid. X-ray Photoelectron Spectra (XPS) Measurements were performed with a K-ALPHA spectrometer (Thermo Fisher Scientific, Waltham, MA, USA) operated in the constant energy mode with survey pass energies of 200 eV and narrow scan energies of 50 eV, to measure the whole energy band as well as selectively measure particular elements. XPS spectra were acquired using Al Kα radiation (1486.6 eV) with a twin monochromator, yielding a focused X-ray spot at 3 mA × 12 kV. Charge compensation was attained with the system flood gun, which provides low energy electrons and low energy argon ions from a single source. For the reference binding energy, the C 1s core level was used, located at 284.6 eV.
Confocal Microscopy
Measurements were carried out using a Leica TCS SP5 confocal microscope. The microscope was equipped with 405 diode, argon, and HeNe lasers. Leica LAS AF software was used to analyze the images.
Super-Resolution Microscopy
Measurements were carried out using a custom-built three-color structured illumination microscopy (SIM) setup that has been described previously. 57 The structured illumination patterns were generated by a spatial light modulator (SLM: SXGA-3DM, Forth Dimension Displays). A 60×/1.2 NA water immersion lens (UPLSAPO 60XW, Olympus) focused the structure illumination pattern onto the sample. This lens also captured the fluorescence emission from the sample, which was imaged onto a sCMOS camera ( C11440 Hamamatsu). Laser excitation wavelengths used were 488 nm (iBEAM-SMART-488, Toptica), 561 nm (OBIS 561, Coherent), and 640 nm (MLD 640, Cobolt), to excite the fluorescence emission of MOF, mitochondria, and DNA, respectively. Images were acquired using custom SIM software previously published. 57 Nine raw images were collected at each plane and recombined using a custom implementation of the fairSIM algorithm. 58 Cell Culture MCF-7 cells were cultured at 37 °C with 5% CO 2 in highly rich glucose (4500 mg/L) DMEM with phenol red supplemented with 10% ( v / v ) FBS, 2 mM l -glutamine, 100 units/mL penicillin, and 100 μg/mL streptomycin. This was named complete DMEM (cDMEM). The cells were passaged three times a week, whenever the cells reached 70–80% confluency.
Cytotoxicity Assays
MCF-7 cells were seed in 96-well plates at a density of 7500 cells/well and were cultured at 37 °C with 5% CO 2 for 24 h.
MTS Viability Assay
The concentration- and time-dependent viability of cells in the presence of DCA x -UiO-66, DCA 5 -TPP 5 -UiO-66, TPP@(DCA x -UiO-66), TPP, and DCA was investigated using the CellTiter 96 Aqueous Non-Radioactive Cell Proliferation Assay (Promega, U.K.). The day after seeding the cells, the different MOFs and drugs were dispersed in complete medium and a range of concentrations was prepared (0–1 mg/mL), of which 100 μL were added to each well and incubated for 4–72 h at 37 °C with 5% CO 2 . At the end of the incubation period, the treatment solutions were removed. The cells were washed once with PBS, and then, 100 μL of fresh growth media was added to each well. To measure the toxicity, 20 μL of MTS solution was added to each well. The plate was then covered with aluminum foil and placed at 37 °C and 5% CO 2 for 75 min. Then, 100 μL of solution from each well was transferred to a new 96-well plate. The plate was read by UV/vis spectroscopy. Caspase Activity Caspase 3/7, 8, and 9 activity in the presence of DCA 5 -UiO-66, TPP@(DCA 5 -UiO-66), and DCA 5 -TPP 5 -UiO-66 was assessed using the Caspase-Glow assay system (Promega, U.K.). Cells were incubated in the presence of varying concentrations of MOF at 4 and 8 h. Caspase activity was then assessed according to the manufacturer’s instructions using a TECAN Spark microplate reader. Experiments were done in quintuplicate. Co-Localization with Mitochondria Cells were seeded at 100,000 cells/well in a four-well chambered cell culture cover glass and left to grow for 24 h. They were then transfected with CellLight Mitochondria-GFP BacMam 2.0 and left to incubate overnight. The cells were then incubated with fTPP@(DCA 5 -UiO-66) for 2 h, after which the media was removed, and the wells washed twice with PBS. Five μM of DRAQ5 solution in media was added to the cells and left to incubate at room temperature in the dark for 5–30 min. The cells were then analyzed directly without further washing using a TCS SP5 inverted laser scanning microscope (Leica, Germany). An argon laser was used to visualize GFP-stained mitochondria (excitation at 488 nm and emission filter set at 505–555 nm). To visualize the stained nucleus, a helium–neon laser was used (excitation at 633 nm and emission filter set at 650–700 nm). fTPP@(DCA 5 -UiO-66) was excited using a diode laser emitting at 405 nm. Images were taken sequentially. Fluorescent images of cells were acquired as described above. Images were then merged and converted to 8-bit RGB format using ImageJ software. Mitochondrial Morphology Study Cells were seeded at 100,000 cells/well in a four-well chambered cell culture cover glass and left to grow for 24 h. They were then transfected with CellLight Mitochondria-GFP BacMam 2.0 and left to incubate overnight. The cells were then incubated with cal@(DCA 5 -UiO-66) or cal-TPP@(DCA 5 -UiO-66) for 30 min and 8 h, after which the media was removed, and the wells washed twice with PBS. Five μM of DRAQ5 solution in media was added to the cells and left to incubate at room temperature in the dark for 5–30 min. The cells were then analyzed directly without further washing using the three-color structured illumination microscope (SIM) setup described above. Mitochondria eccentricity was assessed using a custom-designed pipeline for Cell Profiler. 59 Briefly, the tool performed the following actions: Extract the mitochondria channel from the central slice of the reconstructed SIM image; apply a median filter window size of 7 to remove elements of noise; run the “IdentifyPrimaryObjects” plugin to extract mitochondria as objects from the image; run the “MeasureObjectSizeShape” plugin to gather statistics on detected objects; filter objects with an area less than 20 pixels (34 μm 2 ); export filtered mitochondria objects to a spreadsheet. The eccentricity column was exported from the spreadsheet for further statistical analysis. The one-way ANOVA test was performed using GraphPad Prism version 7.04 for Windows to assess the statistical difference of mitochondria eccentricity between different experimental conditions.
Materials ZrCl 4 (99.5%) and terephthalic acid (BDC, 98%) were purchased from Alfa Aesar (U.K.). Dichloroacetic acid (≥99%), HCl (37%), 4-carboxybutyl triphenylphosphonium bromide (98%), 3-(diphenylphosphino)propionic acid (97%), 1-bromopyrene (96%), acetic acid (≥99%), dimethylformamide (DMF, 99.8%), methanol (99.9%), and acetone (99.9%) were purchased from Sigma-Aldrich (U.K.). Dulbecco’s modified Eagle’s medium (DMEM), fetal bovine serum (FBS), l -glutamine, penicillin, streptomycin, and CellLight Mitochondria-GFP BacMam 2.0 were purchased from Invitrogen (U.K.). The DRAQ5 stain was purchased from Abcam. Phosphate-buffered saline (PBS), trypsin–EDTA, and Lysotracker-Deep Red were purchased from Life Technologies (U.K.). CellTiter 96 AQueous One Solution Cell Proliferation Assay (MTS) and Caspase-Glow 3/7, 8, and 9 Assay Systems were obtained from Promega (U.K.). All chemicals and biochemicals used were of analytical grade. MCF-7 (ECACC 86012803) and HEK293 (ECACC 85120602) cells were obtained from the ECACC.
Supplementary Material ja0c00188_si_001.pdf
📊 Figures
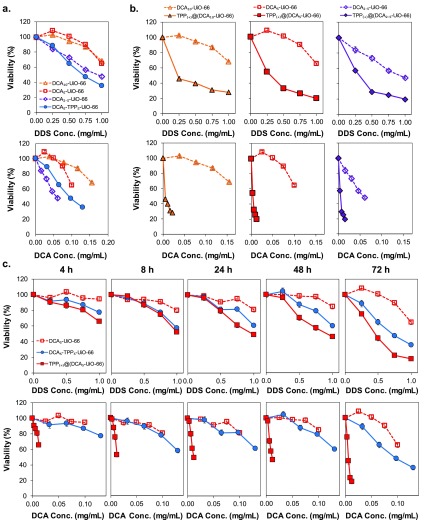
Figure 1
MTS viability assay ofnMCF-7 cells after incubation with differentnsystems. (a) Cell viability as a function of DDS (top) and equivalentnDCA concentration (bottom) after incubation for 72 h with diffe...
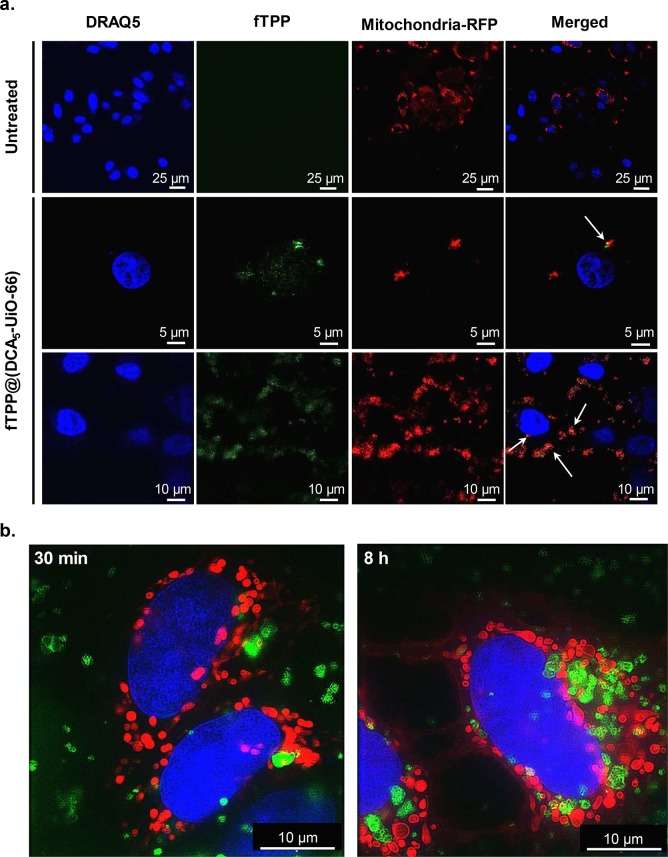
Figure 2
Microscopy imaging ofnMCF-7 cells. (a) Confocal microscopy imagesnof cells incubated for 2 h with fTPP@(DCA 5 -UiO-66). (b)nSIM images of cells incubated for 30 min (left) and 8 h (right) withncal-TPP...
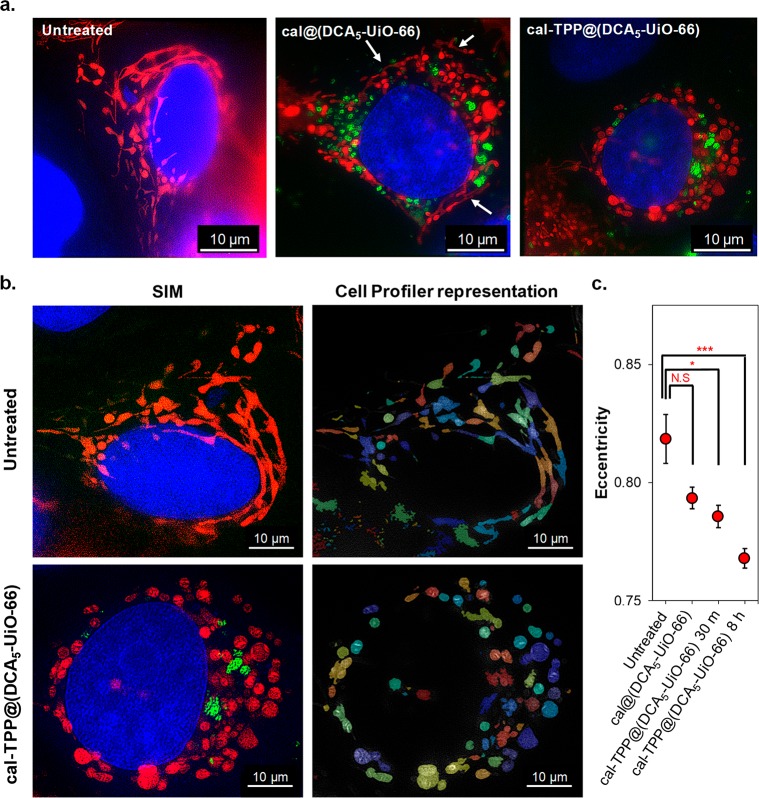
Figure 3
SIM imaging of MCF-7 cells. (a) Images of untreated cells and cellsntreated with cal@(DCA 5 -UiO-66) and cal-TPP@(DCA 5 -UiO-66) for 8 h; mitochondria are colored in red, MOFs in green,nand nuclei in ...
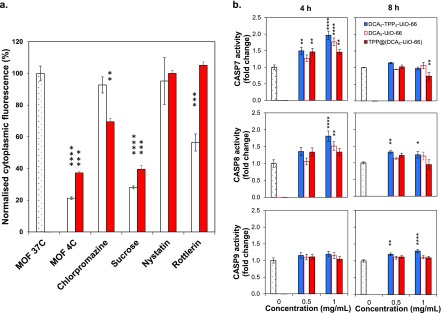
Figure 4
Final fate of MOF nanoparticlesnin MCF-7 cells. (a) Effects ofnpharmacological endocytosis inhibitors on the uptake of cal@(DCA 5 -UiO-66) (white bars) and cal-TPP@(DCA 5 -UiO-66)n(red bars) by MCF-7 ...
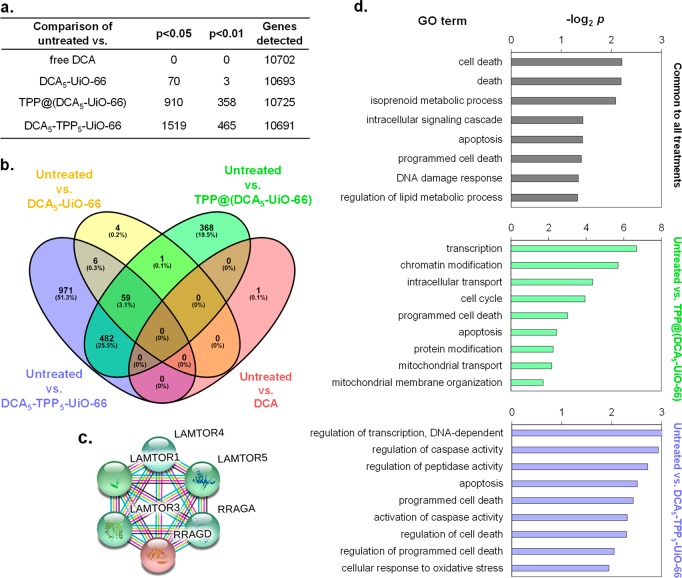
Figure 5
Biochemical effects ofndifferent treatments on MCF-7 cells. (a)nNumber of differentially expressed genes between cells treated withndifferent conditions. (b) Venn diagram analysis of differentiallynex...
Figure images are served from the NIH/NLM PubMed Central Open Access Subset or Europe PMC; copyright remains with the publishers and authors.
💬 Discussion
0 commentsNo comments yet. Be the first to start a discussion!
Leave a Comment