Abstract
The 5-HT3A serotonin receptor1, a cationic pentameric ligand-gated ion channel (pLGIC), is the clinical target for management of nausea and vomiting associated with radiation and chemotherapies2. Upon binding, serotonin induces a global conformational change that encompasses the ligand-binding extracellular domain (ECD), the transmembrane domain (TMD) and the intracellular domain (ICD), the molecular details of which are unclear. Here we present two serotonin-bound structures of the full-length 5-HT3A receptor in distinct conformations at 3.32 Å and 3.89 Å resolution that reveal the mechanism underlying channel activation. In comparison to the apo 5-HT3A receptor, serotonin-bound states underwent a large twisting motion in the ECD and TMD, leading to the opening of a 165 Å permeation pathway. Notably, this motion results in the creation of lateral portals for ion permeation at the interface of the TMD and ICD. Combined with molecular dynamics simulations, these structures provide novel insights into conformational coupling across domains and functional modulation.
🔬 Techniques
🔭 Microscopes
🧬 Organisms
🧪 Sample Preparation
🏭 Microscope Brands
🧪 Reagent Suppliers
📷 Detectors
💻 Software Details
💾 Data Repositories
🏛️ Research Organizations (ROR)
Affiliated research institutions:
📋 Methods
Cloning and functional measurements in oocytes The gene encoding 5-HT 3A R (purchased from GenScript USA Inc) was inserted into the pTLN vector for Xenopus laevis oocyte expression and confirmed by DNA sequencing. The DNA linearization was carried out by incubation with the Mlu1 restriction enzyme overnight at 37 º C. The mRNA synthesis was done using the mMessage mMachine kit (Ambion) as per manufacturer’s instruction. The eluted mRNA was purified with RNAeasy (Qiagen), and injected (3–10 ng) into Xenopus laevis oocytes (stages V-VI). As a control to verify no endogenous currents were present, oocytes were injected with the same volume of water. The oocytes used in this study were kindly provided by Dr. Walter F. Boron. Female Xenopus laevis were purchased from Nasco. All animal experimental procedures were approved by Institutional Animal Care and Use Committee (IACUC) of Case Western Reserve University. Oocytes were maintained at 18 º C in OR3 media (GIBCO BRL Leibovitz media containing glutamate, 500 units each of penicillin and streptomycin, pH adjusted to 7.5, osmolarity adjusted to 197 mOsm). Two electrode voltage-clamp experiments were performed at room temperature 2–5 days post injection on a Warner Instruments Oocyte clamp OC-725. The currents were sampled and digitized at 500 Hz with a Digidata 1332A and analyzed by Clampfit 10.2 (Molecular Devices). Oocytes were clamped at a holding potential of −60 mV, and currents were recorded in response to serotonin application. Solutions were changed using a syringe pump perfusion system flowing at a rate of 6 ml/min. The electrophysiological solutions contained 96 mM NaCl, 2 mM KCl, 1.8 mM CaCl 2 , 1 mM MgCl 2, and 5 mM HEPES (pH 7.4, osmolarity adjusted to 195 mOsm). All chemical reagents were purchased from Sigma-Aldrich. For wt and mutants, the current decay was assessed by the ratio of the current measured at time =20 sec (from the start of ligand application) over peak current amplitude.
Show full methods section
Cloning and functional measurements in oocytes The gene encoding 5-HT 3A R (purchased from GenScript USA Inc) was inserted into the pTLN vector for Xenopus laevis oocyte expression and confirmed by DNA sequencing. The DNA linearization was carried out by incubation with the Mlu1 restriction enzyme overnight at 37 º C. The mRNA synthesis was done using the mMessage mMachine kit (Ambion) as per manufacturer’s instruction. The eluted mRNA was purified with RNAeasy (Qiagen), and injected (3–10 ng) into Xenopus laevis oocytes (stages V-VI). As a control to verify no endogenous currents were present, oocytes were injected with the same volume of water. The oocytes used in this study were kindly provided by Dr. Walter F. Boron. Female Xenopus laevis were purchased from Nasco. All animal experimental procedures were approved by Institutional Animal Care and Use Committee (IACUC) of Case Western Reserve University. Oocytes were maintained at 18 º C in OR3 media (GIBCO BRL Leibovitz media containing glutamate, 500 units each of penicillin and streptomycin, pH adjusted to 7.5, osmolarity adjusted to 197 mOsm). Two electrode voltage-clamp experiments were performed at room temperature 2–5 days post injection on a Warner Instruments Oocyte clamp OC-725. The currents were sampled and digitized at 500 Hz with a Digidata 1332A and analyzed by Clampfit 10.2 (Molecular Devices). Oocytes were clamped at a holding potential of −60 mV, and currents were recorded in response to serotonin application. Solutions were changed using a syringe pump perfusion system flowing at a rate of 6 ml/min. The electrophysiological solutions contained 96 mM NaCl, 2 mM KCl, 1.8 mM CaCl 2 , 1 mM MgCl 2, and 5 mM HEPES (pH 7.4, osmolarity adjusted to 195 mOsm). All chemical reagents were purchased from Sigma-Aldrich. For wt and mutants, the current decay was assessed by the ratio of the current measured at time =20 sec (from the start of ligand application) over peak current amplitude.
Cloning and transfection
Codon optimized mouse 5-HT 3A R gene (NCBI Reference Sequence: NM_001099644.1 ) was purchased from GenScript USA Inc and subcloned into pFastBac1 vector. The pFastBac1 vector includes four Strep-tags (WSHPQFEK) at the N-terminus, followed by a linker sequence (GGGSGGGSGGGS) and a TEV-cleavage sequence (ENLYFQG). The construct also includes a C-terminal 1D4-tag 32 . Spodoptera frugiperda cells (Sf9, Invitrogen) were cultured in ESF921 medium (Expression System) in the absence of antibiotics and incubated at 28 ˚C without CO 2 exchange. Sub-confluent cells were transfected with recombinant bacmid DNA using Cellfectin II transfection reagent (Invitrogen) per manufacturer instructions. The cell culture supernatants were collected and centrifuged at 1,000 × g for 5 min to remove cell debris to obtain progeny 1 (P1) recombinant baculovirus 72 hr post-transfection. P2 viruses were obtained through consecutive round of Sf9 cells infection with P1 viruses. The supernatants (P2) were used to infect Sf9 cells, thus generating P3 viruses. These viruses (P3) were used for recombinant protein production.
Expression and purification of recombinant protein
Recombinant protein production was performed by infection of approximately 2.5×10 6 per ml Sf9 cells with P3 recombinant viruses. After 72 h post-infection, the cell media were harvested and centrifuged at 8,000 × g for 20 min at 4 o C to separate the supernatant from the pellet. The cell pellet was then resuspended in 20 mM Tris-HCl, pH 7.5, 36.5 mM sucrose, and 1% protease inhibitor cocktail. Cells were disrupted by sonication on ice and non-lysed cells were removed by centrifugation (3000 × g for 15 min). The membrane fraction was separated by ultracentrifugation (167,000 × g for 1 hr) and solubilized with 1% C 12 E 9 in a buffer containing 500 mM NaCl, 50 mM Tris pH 7.4, 10% glycerol, and 0.5% protease inhibitor by rotating for 2h at 4 °C. Non-solubilized material was removed by ultracentrifugation (167,000 × g for 15 min). The supernatant was collected and bound with 1D4 beads pre-equilibrated with 150 mM NaCl, 20 mM HEPES pH 8.0, and 0.01% C 12 E 9 for 2 hrs at 4 °C. The beads were then washed with 100 column volumes of 150 mM NaCl, 20 mM HEPES pH 8.0, and 0.01% C 12 E 9 (Buffer A). The protein was then eluted with Buffer A supplemented with 3mg/ml 1D4 peptide (NH 2 - TETSQVAPA-CO 2 H). Eluted protein was then concentrated and deglycosylated with PNGase F (NEB) by incubating 5 units of the enzyme per 1μg of the protein for 2 h at 37 °C under gentle agitation. Deglycosylated protein was then applied to a Superose 6 column (GE healthcare) equilibrated with Buffer A. The peak fractions around 13.9 ml were pooled and concentrated to 2–3 mg/ml using 50 kDa MWCO Millipore filters (Amicon) and used subsequently for cryo-EM studies.
Sample preparation and Cryo-EM data acquisition
Functional characterization shows that serotonin-induced 5-HT 3A R currents saturate at 30 μM and beyond 11 , 33 , 34 . Therefore, the 5-HT 3A R protein (~2.5 mg/mL) was filtered and first incubated with 100 μM serotonin for 30 min. After which, 3 mM Fluorinated Fos-choline 8 (Anatrace) was added and the sample was incubated until blotting 35 . The sample was blotted twice with 3.5 μL sample each time onto Cu 300 mesh Quantifoil 1.2/1.3 grids (Quantifoil Micro Tools), and immediately after the second blot, the grid was plunge frozen into liquid ethane using a Vitrobot (FEI). The grids were imaged using a 300 kV FEI Titan Krios microscope equipped with a Gatan K2-Summit direct detector camera. Movies containing 40-frames were collected at 130,000x magnification (set on microscope) in super-resolution mode with a physical pixel size of 0.532 Å/pix, dose rate of 3.754 electrons/pix/s, and a total exposure time of 12 seconds. Defocus values of the images ranged from −1.0 to −2.5 µm (input range setting for data collection) as per the automated imaging software Latitute S (Gatan Co.).
Image processing
Beam-induced motion was corrected using MotionCor 36 with a B-factor of 150 pix 2 . Super-resolution counting images were binned (2 X 2) in Fourier space, making a final pixel size of 1.064 Å. All subsequent data processing was conducted in RELION 2.1 37 . The defocus values of the motion-corrected micrographs were estimated using Gctf software 38 . Approximately, 3000 particles were manually picked from the 2810 micrographs and sorted into two-dimensional (2D) classes. The best of these classes were then used as templates for automated particle picking. A loose auto-picking threshold was selected to ensure no good particles were missed at this stage. This resulted in ~749,970 auto-picked particles that were subjected to 2D classification to remove suboptimal particles. An initial 3D model was generated from the Apo-5-HT 3A R cryo-EM structure (PDB code: 6BE1) and low-pass filtered to 60 Å using EMAN2 39 . Multiple rounds of 3D auto-refinements and 3D classifications generated 5 good classes. Among them two classes (containing total of 115,992 particles) belonged to State 1 and the other three classes (containing a total of 25,547 particles) represented the State 2 conformation. Subsequent 3D re-classifications, auto-refinement, imposing C 5 symmetry, and post-processing yielded State 1 and State 2 5-HT 3A R structures with final total particles of 103,698 and 18,839, respectively. In the post-processing step in RELION, a soft mask was calculated and applied to the two half-maps before the Fourier shell coefficient (FSC) was calculated. The B-factor estimation and map sharpening were performed in the post processing step. An overall resolution of State 1 and State 2 was calculated to 3.32 Å and 3.89 Å, respectively (based on the gold-standard Fourier shell coefficient (FSC) = 0.143 criterion). Local resolutions were estimated using the RESMAP software 40 . 5-HT 3A R model building The map for State 1 and State 2 contained density for the entire ECD, TMD and a large region of the ICD. The final refined models comprised of residues Thr8-Ile332, Leu397-Ser461. The missing region (333–396) is of the unstructured MX loop that links the amphipathic MX helix 6 and the MA (membrane-associated) helix 21 . The Apo-5-HT 3A R cryo-EM structure (PDB-ID: 6BE1) was used as an initial model and aligned to the 5-HT 3A R cryo-EM map calculated with RELION 2.1. Cryo-EM map was converted to the mtz format using mapmask and sfall tools in CCP4i software 41 . The mtz map was then used for manual model building in COOT 42 . After initial model building, the State 1 and State 2 models were refined against their respective EM-derived maps using the phenix.real_space_refinement tool from the PHENIX software package 43 , employing rigid body, local grid, NCS, and gradient minimization. The models were then subjected to additional rounds of manual model fitting and refinement, resulting in good final models to map cross-correlation ( Extended Data Table 1 ). Stereochemical properties of the model were evaluated by Molprobity 44 . Protein surface area and interfaces were analyzed by using PDBePISA server ( http://www.ebi.ac.uk/pdbe/pisa/ ). To compare the Apo, State 1, and State 2 structures all ligands, ions, and water molecules were removed from the PDB files. Additional residues in the Apo-5-HT 3A R structure were also removed before analysis so that surface area comparisons were made between identical construct lengths. Electrostatic surface potential calculations were carried out using the APBS tools plug-in PyMOL 45 . The pore profile was calculated using the HOLE program 46 . All the tunnels were calculated using Caver3.0 PyMOL plug-in with minimal tunnel radius of 2.8 Å 47 . Figures were prepared using PyMOL (The PyMOL Molecular Graphics System, version 2.0.4 Schrödinger, LLC) Molecular dynamics simulations Each simulation cell (of approximate dimensions 13.5 × 13.5 × 19.5 nm 3 ) contains the full-length receptor structure embedded in a phospholipid (POPC, i.e., 1-palmitoyl-2-oleoyl- sn -glycero-3-phosphocholine) bilayer, with an aqueous solution of Na + and Cl - ions on either side. The protein-bilayer systems were assembled and equilibrated following a previously established protocol 48 and the TIP4P water model 49 was employed. Simulations were performed with GROMACS version 5.1 50 , 51 , using the OPLS all-atom protein force field with united-atom lipids 52 , and at an integration time-step of 2 fs. A Verlet cut-off scheme was applied, and long-range electrostatic interactions were measured using the Particle Mesh Ewald method 53 . The temperature and pressure were maintained at 37 °C and 1 bar, respectively, using the velocity-rescale thermostat 54 in combination with a semi-isotropic Parrinello and Rahman barostat 55 , with coupling constants of τ T = 0.1 ps and τ P = 1 ps. Bonds were constrained through the LINCS algorithm 56 , and an additional harmonic restraint at a force constant of 1000 kJ mol −1 nm −2 was placed on the protein backbone atoms to preserve the original conformational state of the cryo-EM structure. For water free energy estimation, three 50 ns simulation replicates were each initiated from an independently assembled receptor-membrane system, containing NaCl at a concentration of 0.15 M. Using the Channel Annotation Package ( www.channotation.org ), the equilibrium density of water molecules at successive positions along the central pore axis was measured, and free energy profiles were derived through an inverse Boltzmann calculation-based method 57 . For monitoring ion permeation events, a separate set of simulations, each of 100 ns duration and with 0.7 M NaCl included in the simulation cell, were conducted in the presence of a 0.2 V transmembrane potential difference. This was applied by imposing an external, uniform electric field across the simulation cell along the membrane normal direction. The field strength was of magnitude 0.05 V nm −1 , with the cytoplasmic side having either negative or positive potential in different simulation runs.
Supplementary Material 1 2 Supp Video 1
📊 Figures
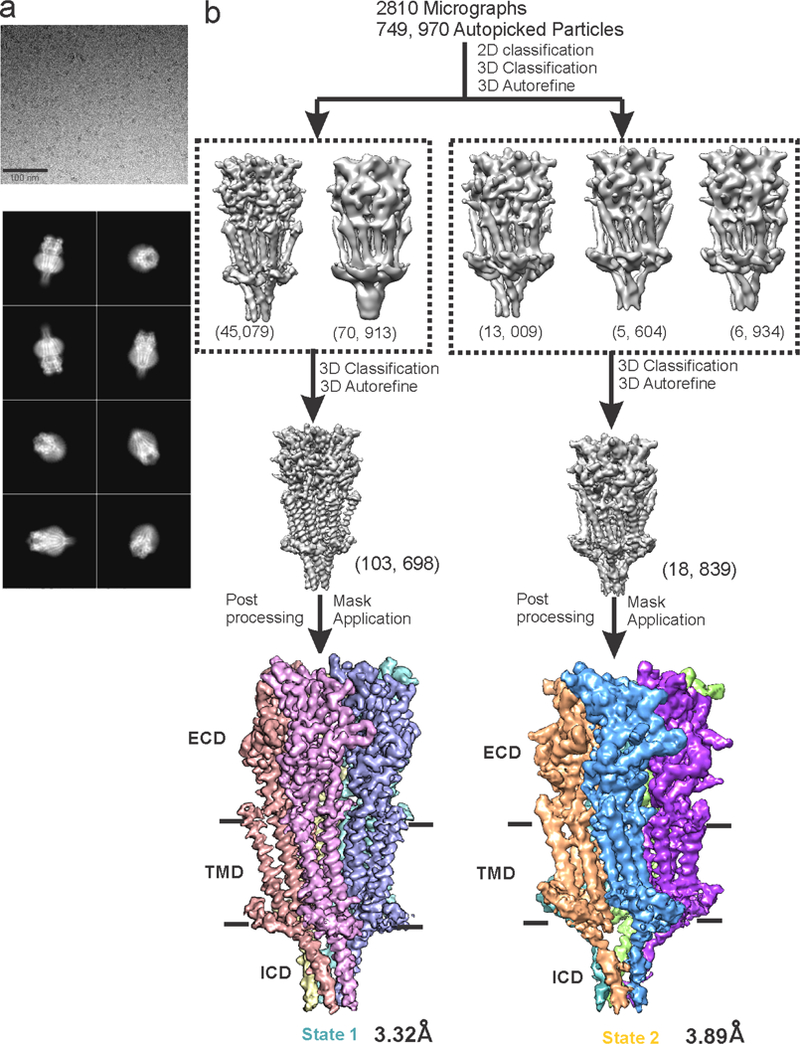
Extended Data Figure 1.
Data processing workflow.
a , A representative micrograph of 5-HT 3A R incubated with 100 u03bcM serotonin in vitreous ice (top). Selected 2D classes showing various orientations (bottom). b, A schematic representation of the ...
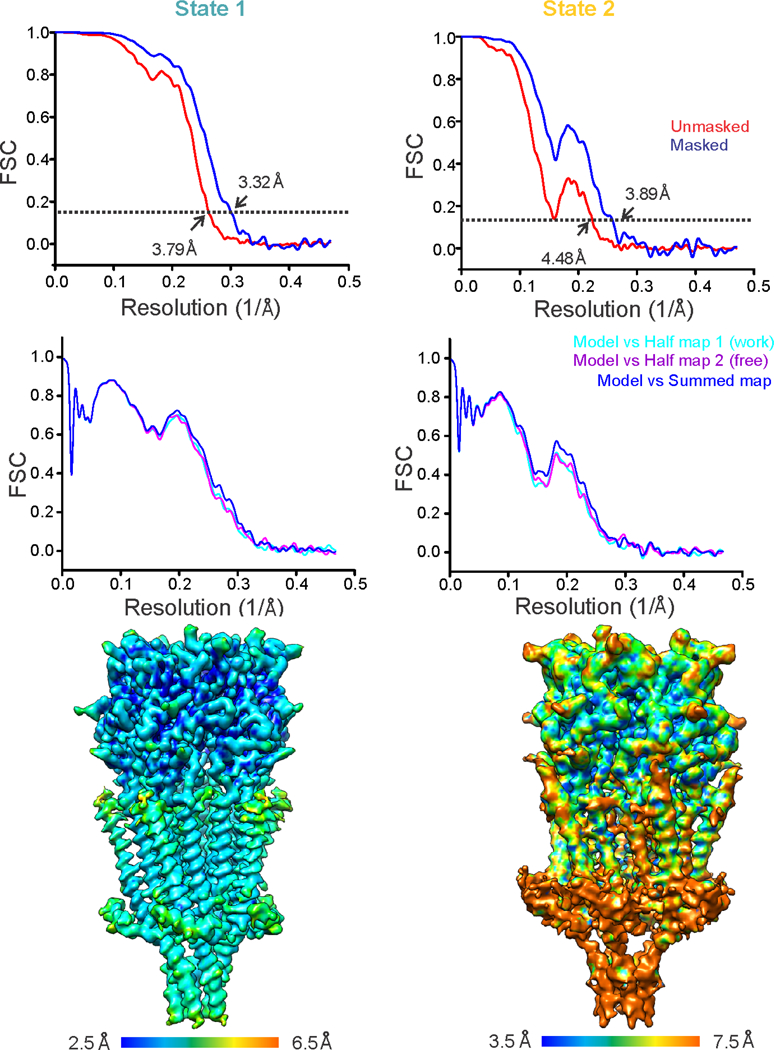
Extended Data Figure 2.
Estimation of resolution and validation of the models.
a , Fourier shell correlation (FSC) curves before (red) and after (blue) the application of soft mask in RELION for State 1 (left) and State 2 (right). The dashed line represents FSC of 0.143. b , For...
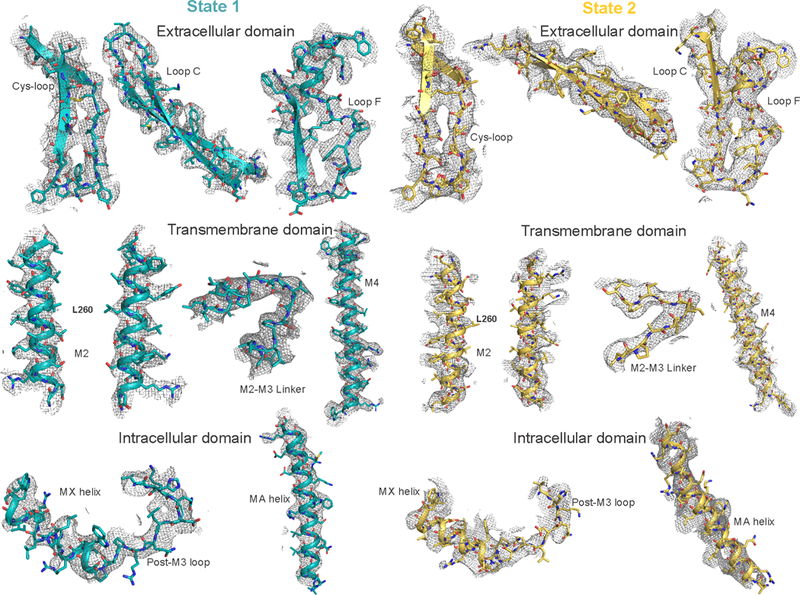
Extended Data Figure 3.
Map correlation of State 1 and State 2.
Various regions of the model (shown as a cartoon) and corresponding density map (mesh) around the residues are shown to validate the final model. Residues are depicted as sticks. The depicted regions ...
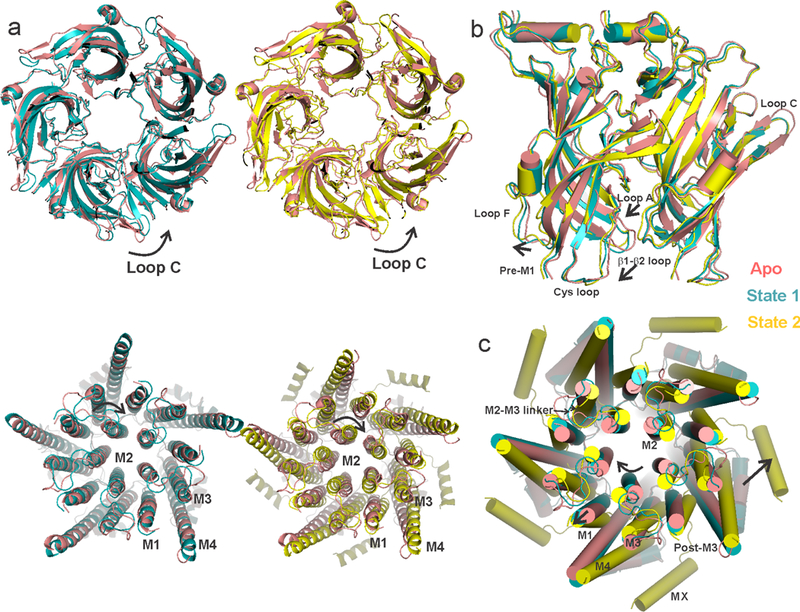
Extended Data Figure 4.
Serotonin-induced conformational changes in the ECD and TMD.
a , A global alignment of the Apo structure with State 1 (left) and State 2 (right). The top panel shows the ECD and the bottom panel shows the TMD, both viewed from the extracellular end. The arrows ...
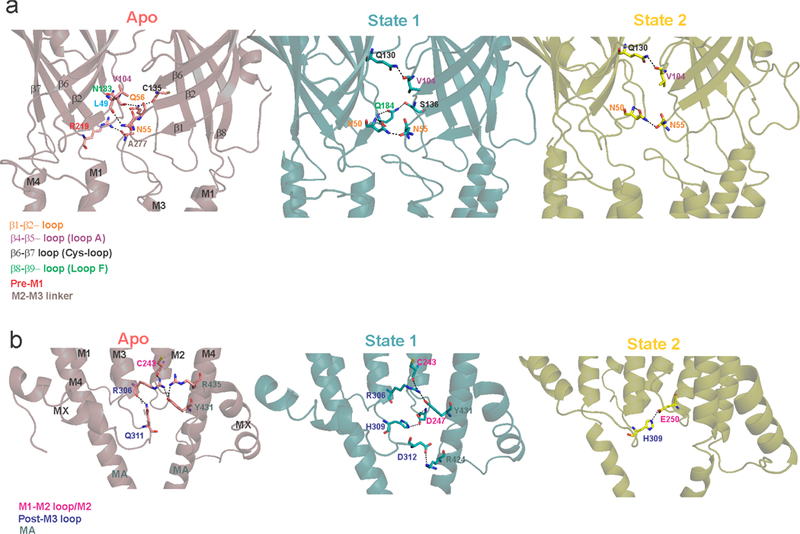
Extended Data Figure 5.
Inter-subunit interaction at the ECD-TMD-ICD interface.
a , Inter-subunit interactions at the ECD-TMD interface in Apo, State 1 and State 2. b , Inter-subunit interactions at the TMD-ICD interface in the three states. The potential interactions were predic...
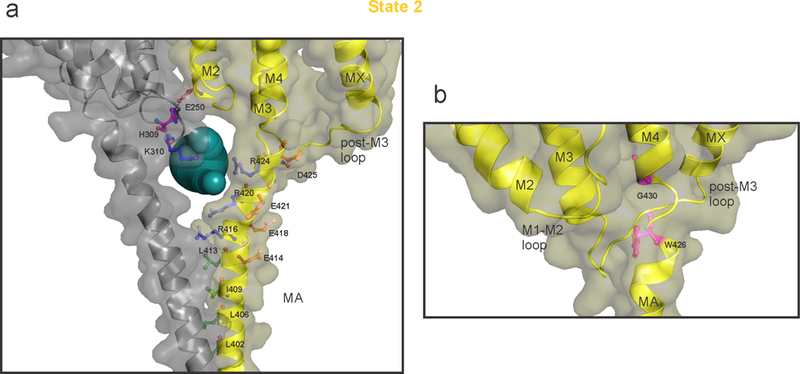
Extended Data Figure 6.
The intracellular domain of State 2.
a, A detailed view of the ICD with key residues shown in stick representation. Only two adjacent subunits are shown for clarity. The solvent-accessible vestibule in the ICD calculated using Caver3.0 4...
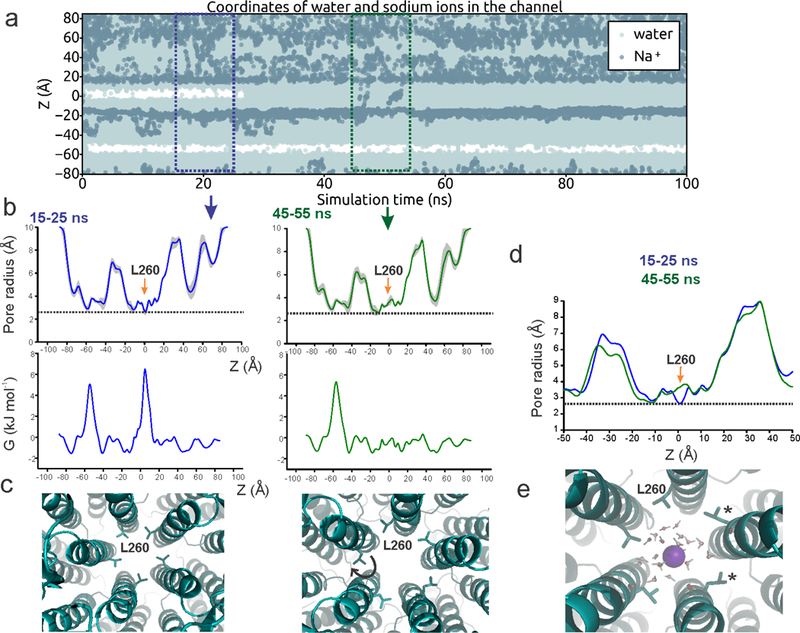
Extended Data Figure 7.
Molecular dynamics simulations of State 1.
a , Trajectories of water and Na + ion coordinates within 5 u00c5 of the channel axis inside the pore over 100 ns with a 0.2 V transmembrane potential difference, with the cytoplasmic side having a po...
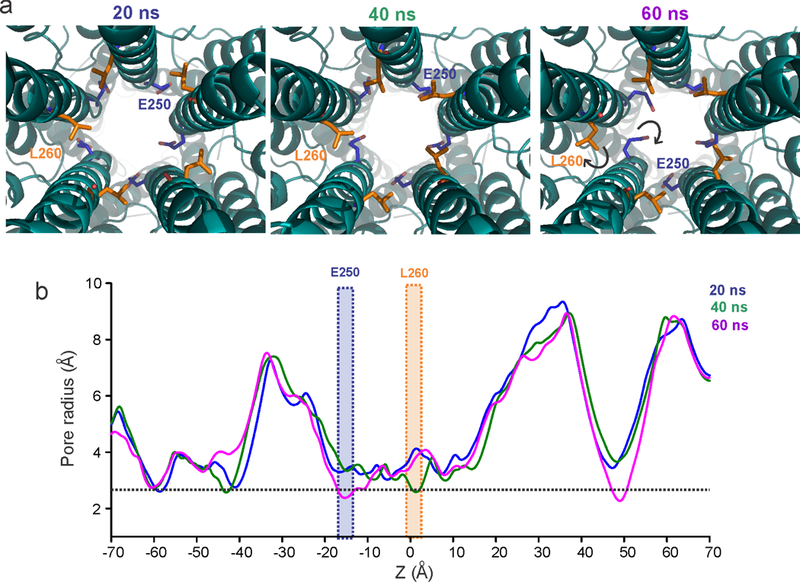
Extended Data Figure 8.
Snapshots of the State 1 pore conformation from the MD simulation.
a , Sidechain orientations of Leu260 and Glu250 during different time points (indicated above) in the simulation. b , The corresponding pore radii profiles. The positions of Glu250 and Leu260 are high...
Extended Data Figure 9.
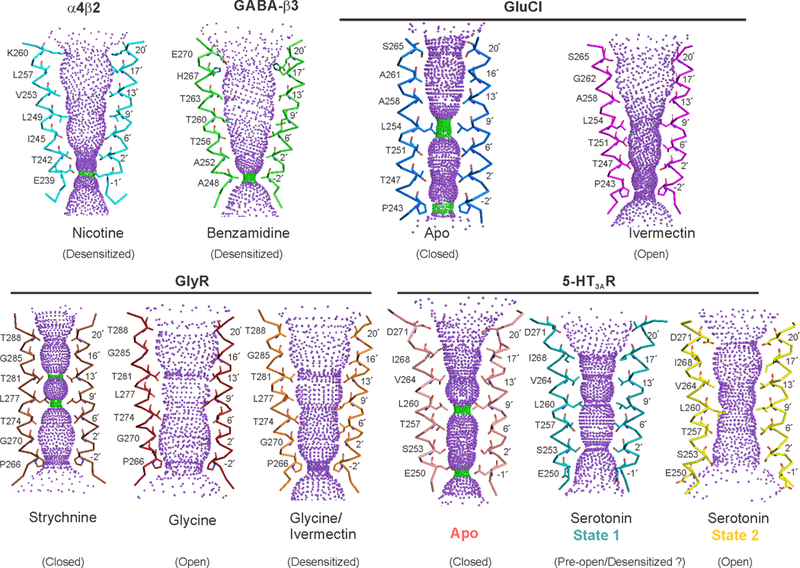
Comparison of pLGIC pore profiles.
Pore profiles calculated using the HOLE program 46 for the M2 region of nAChR (PDB ID: 5KXI) 4 , u03b23-GABA receptor (PDB ID: 4COF) 7 , GluCl (Apo- PDB ID: 4TNV 59 and ivermectin-bound- PDB ID: 3RHW ...
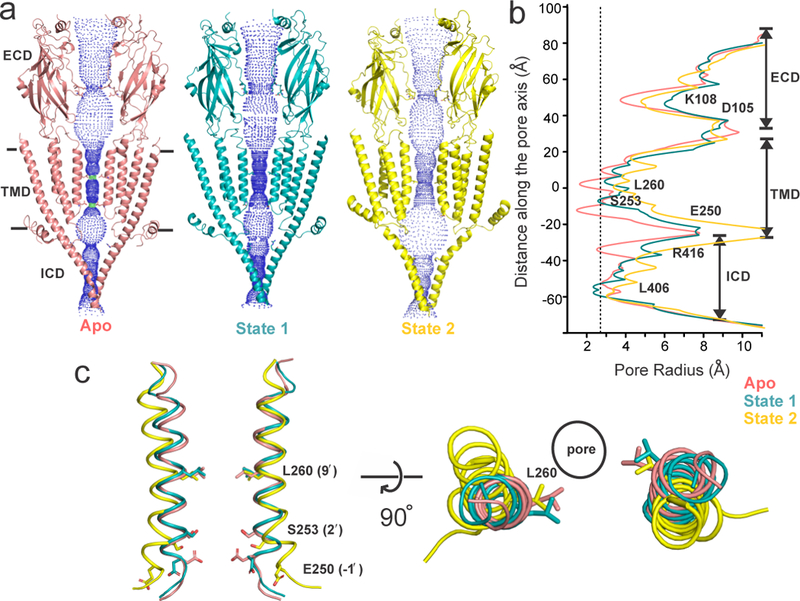
Figure 1.
Ion permeation pathway.
a , The profile of ion permeation pathway for the full-length 5-HT 3A R in the Apo state (salmon red) and in the two serotonin-bound conformations, State 1 (teal) and State 2 (yellow). For clarity, th...
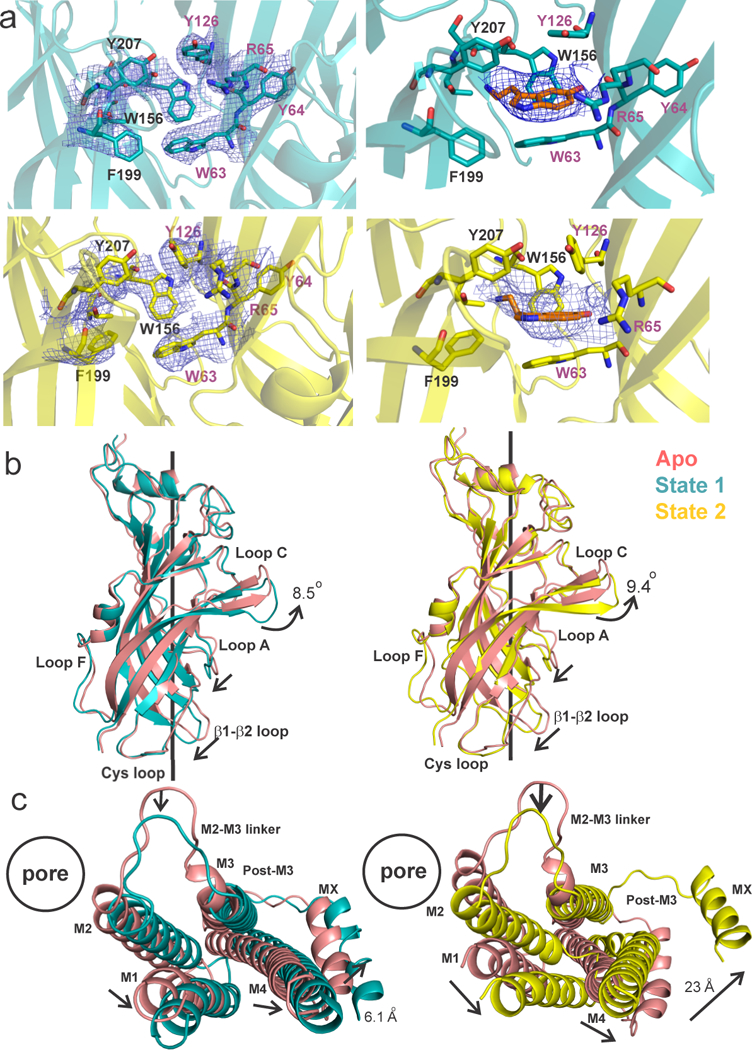
Figure 2.
The serotonin-binding site and global conformational differences between the Apo and serotonin-bound states.
a , Top, the State 1 map (contoured at 10u03c3) is shown around the side chain of residues at the subunit interface that constitute the serotonin-binding site (left). The density map (7.5 u03c3) for s...
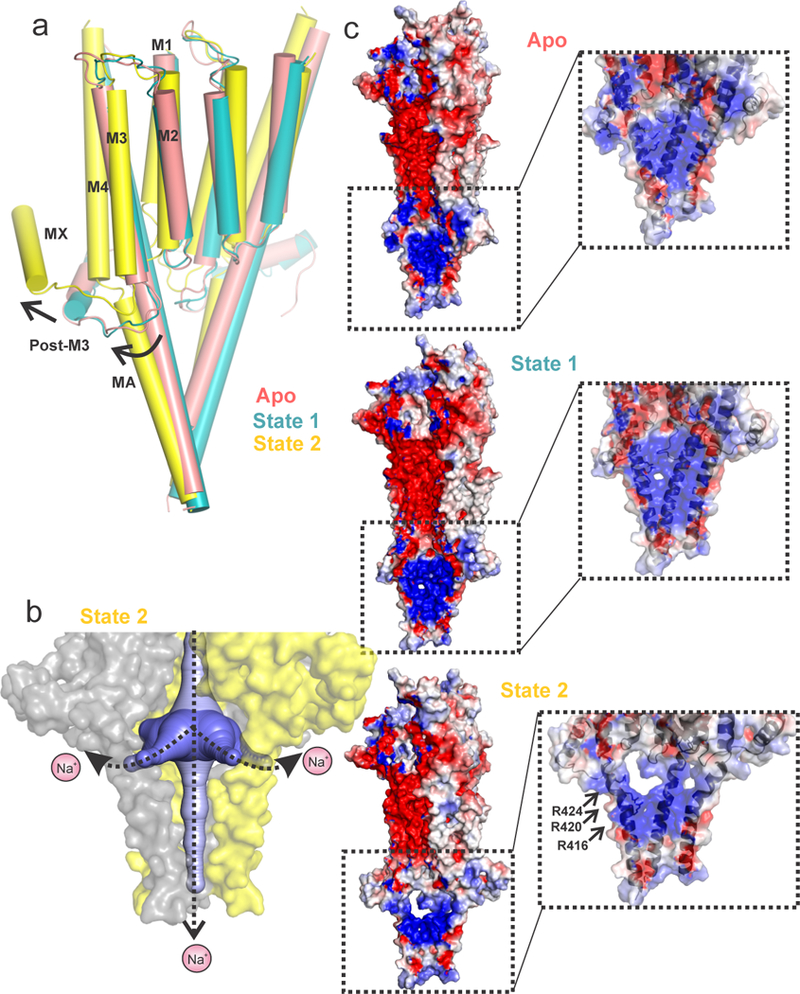
Figure 3.
Opening of the lateral portal for ion exit.
a , An alignment of Apo, State 1 and State 2 structures. The TMD and ICD are shown for two adjacent subunits. The arrows show the direction of relative movements of the helices. b , The solvent-access...
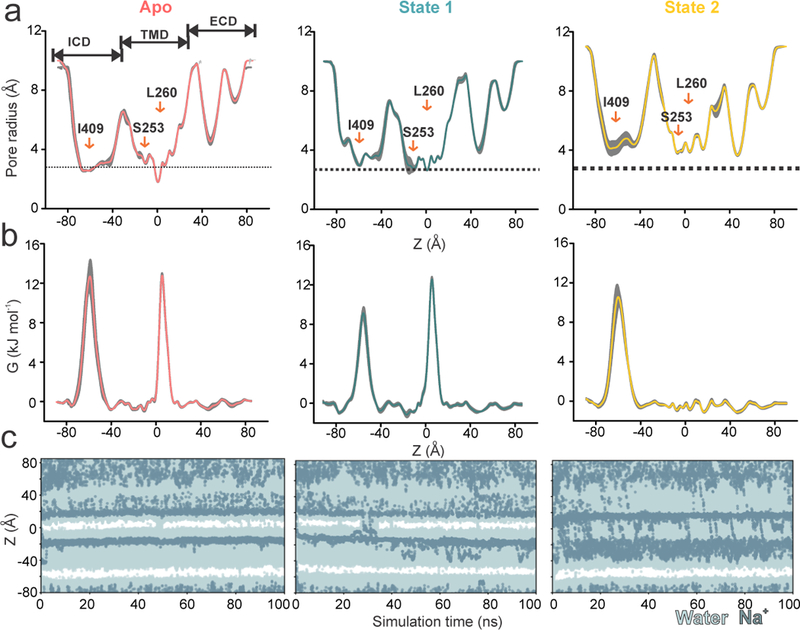
Figure 4.
Molecular dynamics simulations of Apo, State 1, and State 2 structures.
Each structure was subjected to three 50 ns equilibrium simulations, with the replicates initiated from separately assembled protein-membrane systems. Radius and energy profiles were calculated for ea...
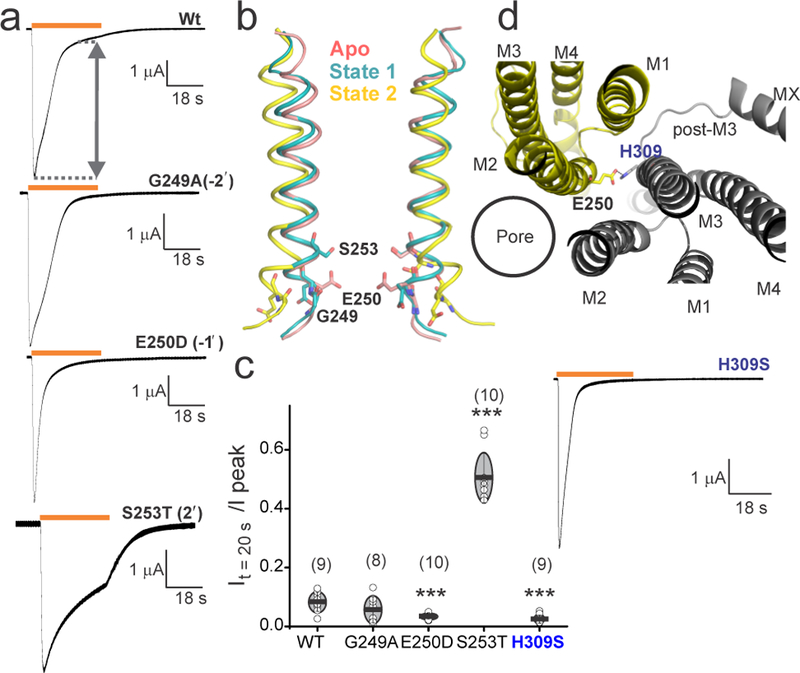
Figure 5.
Functional characterization of mutations at the pore-lining positions.
a , Two electrode voltage-clamp (TEVC) recording (at u221260mV) of wt 5-HT 3A R, G249A, E250D and S253T mutants expressed in oocytes. Currents were elicited in response to application of 10 u00b5M ser...
Figure images are served from the NIH/NLM PubMed Central Open Access Subset or Europe PMC; copyright remains with the publishers and authors.
💬 Discussion
0 commentsNo comments yet. Be the first to start a discussion!
Leave a Comment