Abstract
Laser based transfection methods have proven to be an efficient and gentle alternative to established molecule delivery methods like lipofection or electroporation. Among the laser based methods, gold nanoparticle mediated laser transfection bears the major advantage of high throughput and easy usability. This approach uses plasmon resonances on gold nanoparticles unspecifically attached to the cell membrane to evoke transient and spatially defined cell membrane permeabilization. In this study, we explore the parameter regime for gold nanoparticle mediated laser transfection for the delivery of molecules into cell lines and prove its suitability for siRNA mediated gene knock down. The developed setup allows easy usage and safe laser operation in a normal lab environment. We applied a 532 nm Nd:YAG microchip laser emitting 850 ps pulses at a repetition rate of 20.25 kHz. Scanning velocities of the laser spot over the sample of up to 200 mm/s were tested without a decline in perforation efficiency. This velocity leads to a process speed of ∼8 s per well of a 96 well plate. The optimal particle density was determined to be ∼6 particles per cell using environmental scanning electron microscopy. Applying the optimized parameters transfection efficiencies of 88% were achieved in canine pleomorphic adenoma ZMTH3 cells using a fluorescent labeled siRNA while maintaining a high cell viability of >90%. Gene knock down of d2-EGFP was demonstrated and validated by fluorescence repression and western blot analysis. On basis of our findings and established mathematical models we suppose a mixed transfection mechanism consisting of thermal and multiphoton near field effects. Our findings emphasize that gold nanoparticle mediated laser transfection provides an excellent tool for molecular delivery for both, high throughput purposes and the transfection of sensitive cells types.
🔬 Techniques
✨ Fluorophores
🧪 Sample Preparation
🏭 Microscope Brands
🧪 Reagent Suppliers
💻 Software Details
🏛️ Research Organizations (ROR)
Affiliated research institutions:
📋 Methods
Experimental Setup
The optical transfection setup utilized a 532 nm Nd:YAG microchip laser (Horus Laser, Limoges, France) emitting 850 ps pulses at a repetition rate of 20.25 kHz. The beam diameter was adjusted using a telescope. The laser power was reduced by a combination of a half-wave plate and a polarizing beam-splitter (Thorlabs, Newton, USA). A galvanometer scanner (Müller Elektronik, Spaichingen, Germany) allowed scanning of the laser spot over the sample. A motorized stage (Carl Zeiss, Jena, Germany) allowed positioning of the sample and automated sequential selection of single wells within a multiwell plate by a self-developed, LabView based software.
Cell preparation and GNOME laser transfection Canine pleomorphic adenoma
ZMTH3 cells [30] were cultured routinely in RPMI 1640 supplemented with 10% FCS and 1% Penicillin/Streptomycin (all Biochrom AG, Berlin, Germany). For parameter evaluation 2,5×10 4 ZMTH3 cells per well of a black wall/clear bottom 96 well plate (BD Bioscience, Heidelberg, Germany) were seeded 24 h before transfection. The cells were incubated with 200 nm AuNP (Kisker Biotech, Steinfurt, Germany) solved in culture medium for 3 h at 37°C, then the molecule to be delivered (2 mg/ml 10 kDa FITC-dextran; Sigma-Aldrich, Steinheim, Germany) was added in fresh culture medium and the samples were laser-treated ( Fig. 2 ). Afterwards cells were incubated for 30 min at 37°C and washed three times. In order to determine the viability, 10% (v/v) of the QBlue viability assay kit (BioChain, Newark, USA), a resazurin based, fluorometric metabolism assay, were added to the culture medium and incubated for one hour. Delivery was monitored in a plate reader (Infinite 200 pro, Tecan, Männedorf, Switzerland) at EX488/EM520 nm, the viability was measured at EX570/EM600 nm. The normalized efficiency was calculated by subtracting the fluorescent background from each well and normalizing the values corresponding to the highest value of the dataset. 10.1371/journal.pone.0058604.g002 Figure 2 Experimental procedure for GNOME laser transfection. Cells are incubated with AuNP (1), the molecule to be delivered is added (2) and the sample is irradiated to permeabelize the cell membrane (3). Drawings are not true to scale. To evaluate the transfection efficiencies the cells were prepared and incubated with particles as described above. Then 100 µM siRNA labeled with AlexaFluor488 (Qiagen, Hilden, Germany) was added to the samples and the cells were laser-treated. Dead cells were stained with ToPro3 (Invitrogen, Carlsbad, USA). The transfection efficiency was measured by flow cytometry (FACS Calibur, BD Bioscience, Heidelberg, Germany). siRNA mediated knock down For EGFP knock down ZMTH3 cells stably transfected with pd2-EGFP-N1 (Clontech Laboratories, Mountain View, USA) were laser-transfected with anti-GFP siRNA (Qiagen, Hilden, Germany). After 24 h EGFP fluorescence was measured at EX475/EM511 nm and viability assessed as described above. To account for possible cell losses, knock down efficiencies were calculated as (1) (2) with corF = corrected fluorescence, F s = fluorescence of the sample, F b = fluorescence of the blank (empty well), V s = viability of the sample, KD = knock down in % and F c = fluorescence of untreated control cells. Western blot analysis 48 h after GNOME laser transfection with anti-GFP siRNA all samples and controls were lysed in 40 µl lysis buffer (150 mM NaCl, 1% Triton X-100, 50 mM Tris, pH 8.0, Roche cOmplete ultra protease inhibitor) per well. Protein contents were determined using the Roti Quant universal Kit (Carl Roth, Karlsruhe, Germany). After electrophoresis and blotting GFP was detected by a 1∶4,000 dilution of the Living Colors A.v. Monoclonal Antibody (Clontech Laboratories) and a 1∶1,000 dilution of an anti-mouse-HRP conjugate (dianova, Hamburg, Germany). β-Actin was detected by a 1∶20,000 dilution by a directly HRP linked antibody (dianova). Toxicity testings To assess the viability after laser treatment for longer time scales 5×10 3 cells per well were seeded and then laser treated as described above. To measure the impact of AuNP incubation, cells were incubated with 0.5 or 5 µg/cm 2 for 3 or 24 h, respectively. Viability was measured using the QBlue viability assay kit. Afterwards the staining solution was replaced by culture medium and cells were further incubated until the next time point. Cells treated with 12 µg/ml Digitonin (Sigma-Aldrich) served as negative control. ESEM Imaging For ESEM imaging, the cells were grown on cover slides (diameter 12 mm) in a 24 well plate and treated with the indicated concentrations of AuNP for 3 h. The culture medium was removed and the samples were fixed in 4% paraformaldehyde and 2.5% glutaraldehyde (Sigma-Aldrich) for 10 min at room temperature. The samples were carefully rinsed with distilled water and imaged in an electron microscope (Quanta 400 F, FEI, Eindhoven, Netherlands) in wet mode. Images were taken after two purge cycles between 6 and 13 mbar at 2°C, 6 mbar and a high voltage of 15 kV. The cell surface area and particle count were analyzed using ImageJ [31] . UV/VIS spectra 200 nm AuNP were solved in a concentration of 10 µg/ml in RPMI without phenol red supplied with 10% FCS. For each sample 200 µl AuNP suspension were irradiated in a 96 well. The absorbance was acquired in a UV/VIS spectrometer (UV 1650-PC, Shimadzu, Duisburg, Germany) against RPMI without AuNP.
Show full methods section
Experimental Setup
The optical transfection setup utilized a 532 nm Nd:YAG microchip laser (Horus Laser, Limoges, France) emitting 850 ps pulses at a repetition rate of 20.25 kHz. The beam diameter was adjusted using a telescope. The laser power was reduced by a combination of a half-wave plate and a polarizing beam-splitter (Thorlabs, Newton, USA). A galvanometer scanner (Müller Elektronik, Spaichingen, Germany) allowed scanning of the laser spot over the sample. A motorized stage (Carl Zeiss, Jena, Germany) allowed positioning of the sample and automated sequential selection of single wells within a multiwell plate by a self-developed, LabView based software.
Cell preparation and GNOME laser transfection Canine pleomorphic adenoma
ZMTH3 cells [30] were cultured routinely in RPMI 1640 supplemented with 10% FCS and 1% Penicillin/Streptomycin (all Biochrom AG, Berlin, Germany). For parameter evaluation 2,5×10 4 ZMTH3 cells per well of a black wall/clear bottom 96 well plate (BD Bioscience, Heidelberg, Germany) were seeded 24 h before transfection. The cells were incubated with 200 nm AuNP (Kisker Biotech, Steinfurt, Germany) solved in culture medium for 3 h at 37°C, then the molecule to be delivered (2 mg/ml 10 kDa FITC-dextran; Sigma-Aldrich, Steinheim, Germany) was added in fresh culture medium and the samples were laser-treated ( Fig. 2 ). Afterwards cells were incubated for 30 min at 37°C and washed three times. In order to determine the viability, 10% (v/v) of the QBlue viability assay kit (BioChain, Newark, USA), a resazurin based, fluorometric metabolism assay, were added to the culture medium and incubated for one hour. Delivery was monitored in a plate reader (Infinite 200 pro, Tecan, Männedorf, Switzerland) at EX488/EM520 nm, the viability was measured at EX570/EM600 nm. The normalized efficiency was calculated by subtracting the fluorescent background from each well and normalizing the values corresponding to the highest value of the dataset. 10.1371/journal.pone.0058604.g002 Figure 2 Experimental procedure for GNOME laser transfection. Cells are incubated with AuNP (1), the molecule to be delivered is added (2) and the sample is irradiated to permeabelize the cell membrane (3). Drawings are not true to scale. To evaluate the transfection efficiencies the cells were prepared and incubated with particles as described above. Then 100 µM siRNA labeled with AlexaFluor488 (Qiagen, Hilden, Germany) was added to the samples and the cells were laser-treated. Dead cells were stained with ToPro3 (Invitrogen, Carlsbad, USA). The transfection efficiency was measured by flow cytometry (FACS Calibur, BD Bioscience, Heidelberg, Germany). siRNA mediated knock down For EGFP knock down ZMTH3 cells stably transfected with pd2-EGFP-N1 (Clontech Laboratories, Mountain View, USA) were laser-transfected with anti-GFP siRNA (Qiagen, Hilden, Germany). After 24 h EGFP fluorescence was measured at EX475/EM511 nm and viability assessed as described above. To account for possible cell losses, knock down efficiencies were calculated as (1) (2) with corF = corrected fluorescence, F s = fluorescence of the sample, F b = fluorescence of the blank (empty well), V s = viability of the sample, KD = knock down in % and F c = fluorescence of untreated control cells. Western blot analysis 48 h after GNOME laser transfection with anti-GFP siRNA all samples and controls were lysed in 40 µl lysis buffer (150 mM NaCl, 1% Triton X-100, 50 mM Tris, pH 8.0, Roche cOmplete ultra protease inhibitor) per well. Protein contents were determined using the Roti Quant universal Kit (Carl Roth, Karlsruhe, Germany). After electrophoresis and blotting GFP was detected by a 1∶4,000 dilution of the Living Colors A.v. Monoclonal Antibody (Clontech Laboratories) and a 1∶1,000 dilution of an anti-mouse-HRP conjugate (dianova, Hamburg, Germany). β-Actin was detected by a 1∶20,000 dilution by a directly HRP linked antibody (dianova). Toxicity testings To assess the viability after laser treatment for longer time scales 5×10 3 cells per well were seeded and then laser treated as described above. To measure the impact of AuNP incubation, cells were incubated with 0.5 or 5 µg/cm 2 for 3 or 24 h, respectively. Viability was measured using the QBlue viability assay kit. Afterwards the staining solution was replaced by culture medium and cells were further incubated until the next time point. Cells treated with 12 µg/ml Digitonin (Sigma-Aldrich) served as negative control. ESEM Imaging For ESEM imaging, the cells were grown on cover slides (diameter 12 mm) in a 24 well plate and treated with the indicated concentrations of AuNP for 3 h. The culture medium was removed and the samples were fixed in 4% paraformaldehyde and 2.5% glutaraldehyde (Sigma-Aldrich) for 10 min at room temperature. The samples were carefully rinsed with distilled water and imaged in an electron microscope (Quanta 400 F, FEI, Eindhoven, Netherlands) in wet mode. Images were taken after two purge cycles between 6 and 13 mbar at 2°C, 6 mbar and a high voltage of 15 kV. The cell surface area and particle count were analyzed using ImageJ [31] . UV/VIS spectra 200 nm AuNP were solved in a concentration of 10 µg/ml in RPMI without phenol red supplied with 10% FCS. For each sample 200 µl AuNP suspension were irradiated in a 96 well. The absorbance was acquired in a UV/VIS spectrometer (UV 1650-PC, Shimadzu, Duisburg, Germany) against RPMI without AuNP.
Experimental Setup
The optical transfection setup utilized a 532 nm Nd:YAG microchip laser (Horus Laser, Limoges, France) emitting 850 ps pulses at a repetition rate of 20.25 kHz. The beam diameter was adjusted using a telescope. The laser power was reduced by a combination of a half-wave plate and a polarizing beam-splitter (Thorlabs, Newton, USA). A galvanometer scanner (Müller Elektronik, Spaichingen, Germany) allowed scanning of the laser spot over the sample. A motorized stage (Carl Zeiss, Jena, Germany) allowed positioning of the sample and automated sequential selection of single wells within a multiwell plate by a self-developed, LabView based software.
Supporting Information Figure S1 Electron microscopical images of 200 nm gold nanoparticles after irradiation with different radiant exposure. At the highest radiant exposure (70 mJ/cm 2 ) melted clusters of particles occur. A: control, B: 20 mJ/cm 2 , C: 70 mJ/cm 2 . (TIFF) Click here for additional data file. Figure S2 The optimal values for radiant exposure for different scanning velocities were plotted against the pulses per point for the given velocity (see also dotted line in Fig. 3a ). A power function has been fitted to the data. The resulting exponent is b = −0.378. This can be interpreted as a coefficiency of k = 2.65 in the power-law function E N = E 1 *N (−1/k) , where E N = threshold pulse energy for N pulses and E 1 = single pulse threshold energy [48] , [49] . Absorption of three photons at a wavelength of 532 nm would yield an energy of 6.99 eV, which is enough to overcome the ionization energy of water (6.5 eV) [50] , thus this finding supports the appearance of multiphoton ionization described by Kalies and Birr et al. [41] . (TIFF) Click here for additional data file. Figure S3 Calculation of the near field enhancement around a 200 nm gold sphere during irradiation at 532 nm in water. The color scale represents the electric field enhancement |E| 2 /|E 0 | 2 . The calculation was performed using the MATLAB package developed by Dr. Schaefer ( http://www.mathworks.com/matlabcentral/fileexchange/36831-matscat ) [43] . (TIFF) Click here for additional data file.
📊 Figures
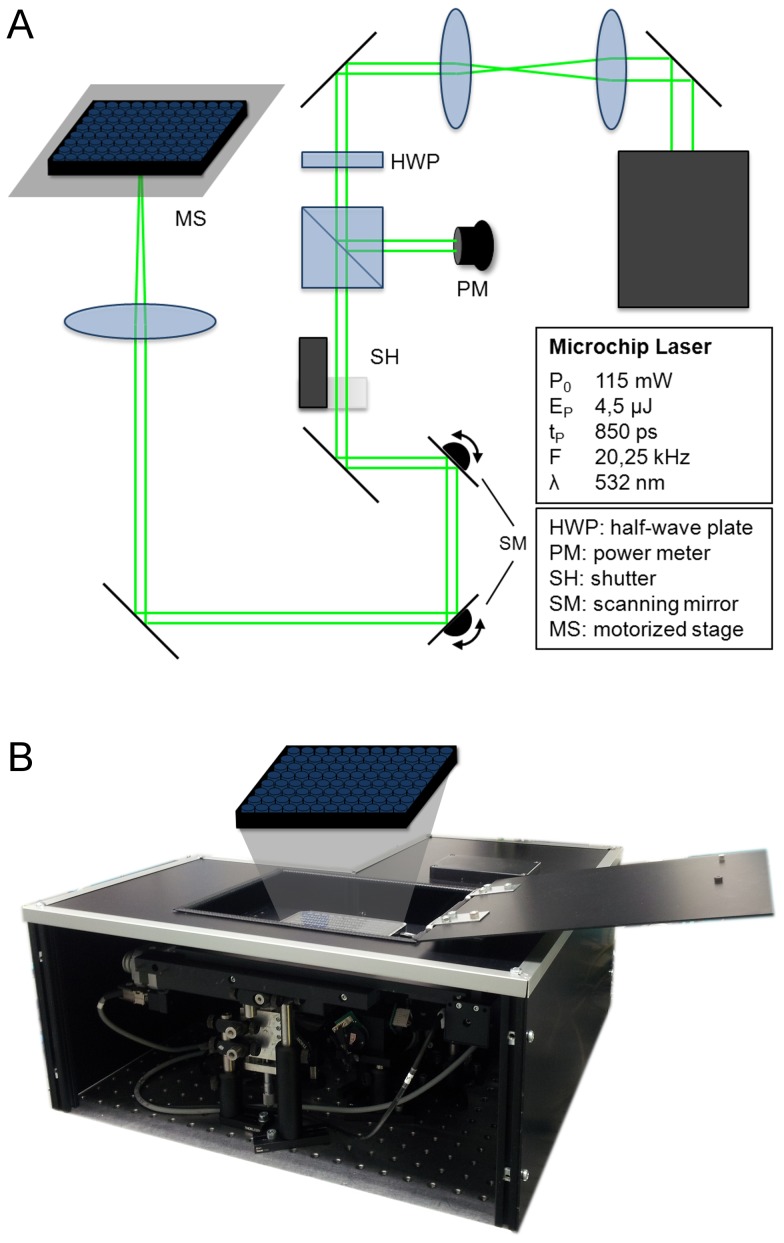
Figure 1
Experimental setup.
A: Schematic drawing and B: photograph of the setup.
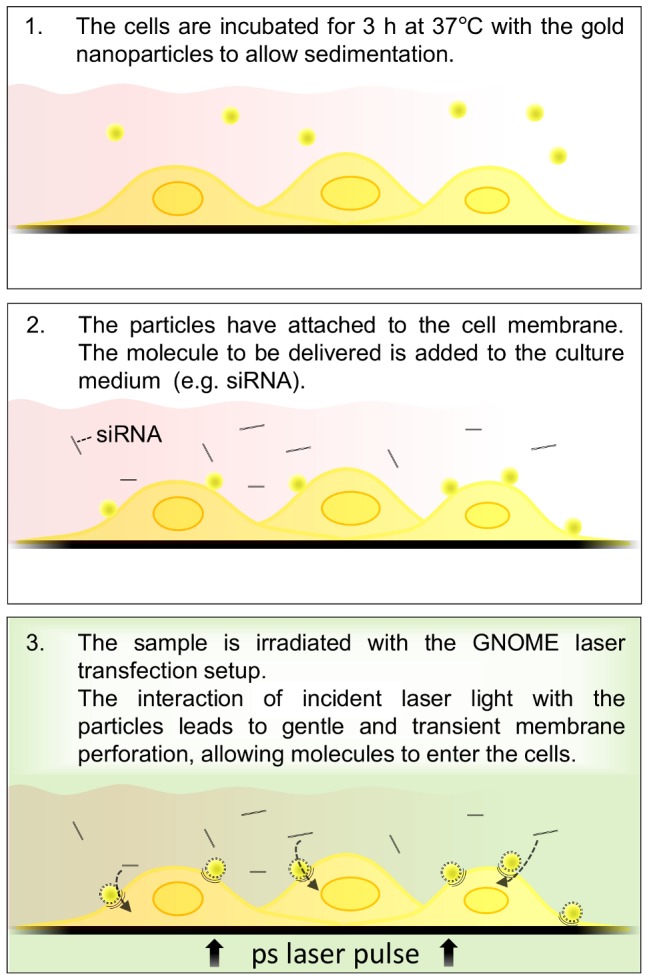
Figure 2
Experimental procedure for GNOME laser transfection.
Cells are incubated with AuNP (1), the molecule to be delivered is added (2) and the sample is irradiated to permeabelize the cell membrane (3). Drawings are not true to scale.
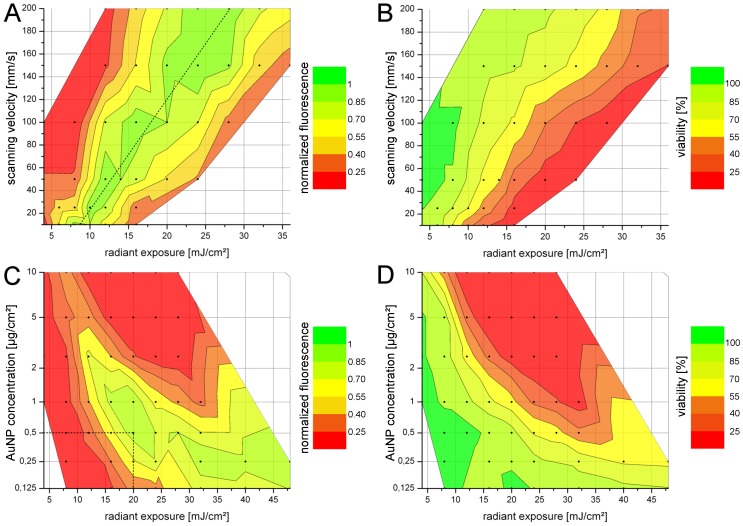
Figure 3
Fluorescence level and viability for different transfection parameters for the delivery of 10 kDa FITC-dextran.
A: Fluorescence for different scanning velocities at a constant AuNP concentration of 5 u00b5g/cm 2 . The scanning velocity was set to values between 10 and 200 mm/s, corresponding to 175 and 9 pulses...
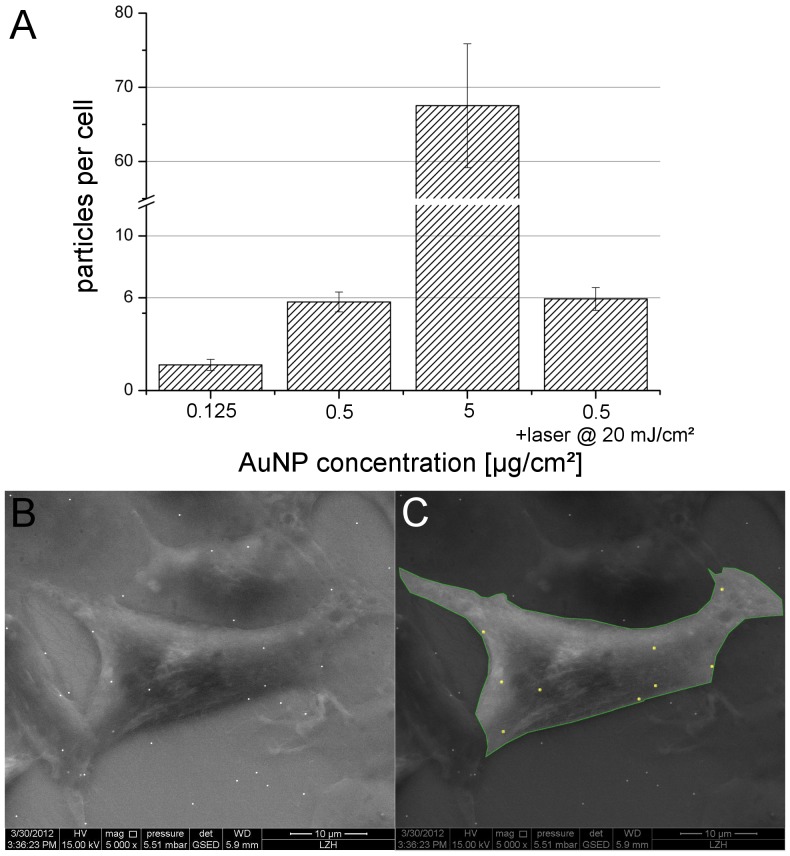
Figure 4
Number of particles per cell.
A: Particle count per cell after 3 hours of incubation with different AuNP concentrations. No significant difference in the particle count was observed after irradiation with 20 mJ/cm 2 (pu200a=u200a0...
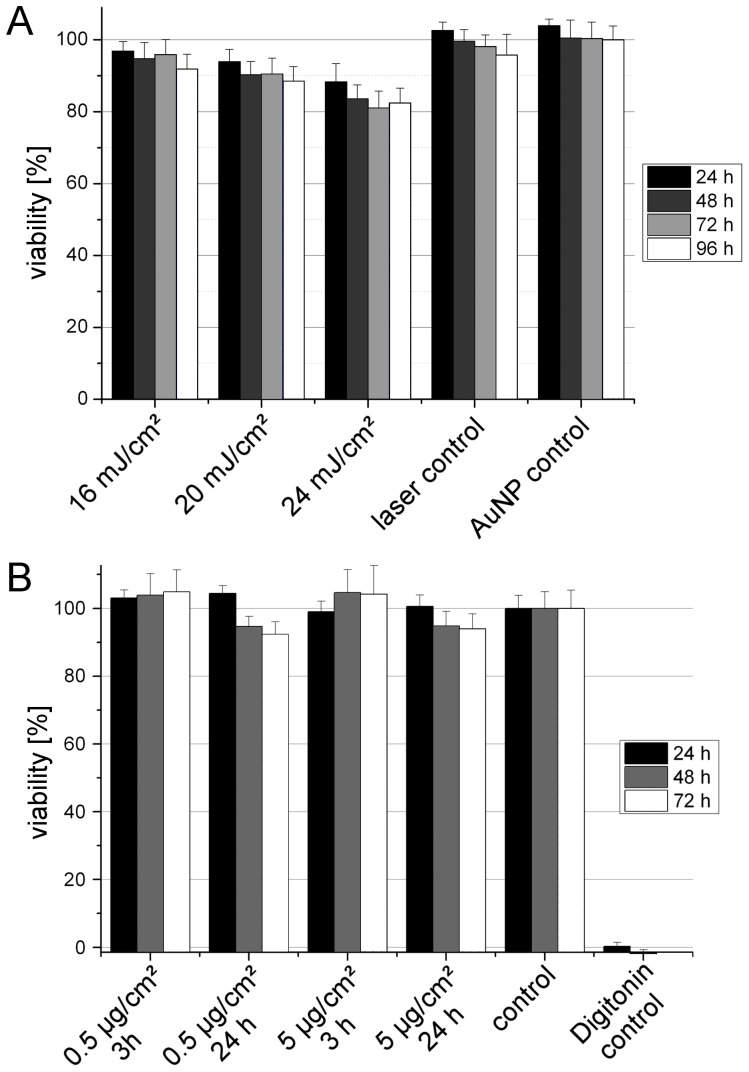
Figure 5
Course of the viability after GNOME laser transfection and AuNP incubation.
A: The cells have been incubated with 0.5 u00b5g/cm 2 200 nm AuNP and were irradiated with different values of radiant exposure. At the indicated time points after laser treatment the cell viability w...
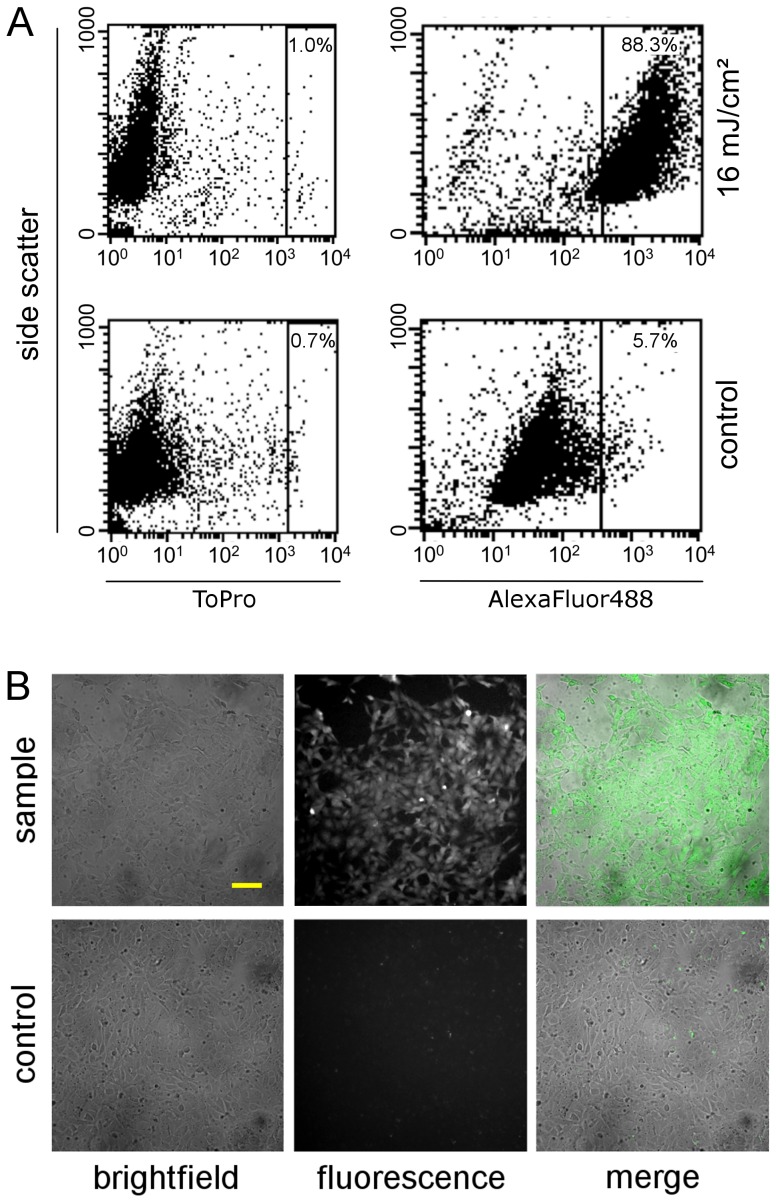
Figure 6
siRNA injection using GNOME laser transfection.
A: Transfection of AlexaFluor488 labeled siRNA into ZMTH3 cells. 88% of the cells stained positive for the siRNA after transfection with the optimized parameters (0.5 u00b5g/cm 2 AuNP, 20 mJ/cm 2 , 50...
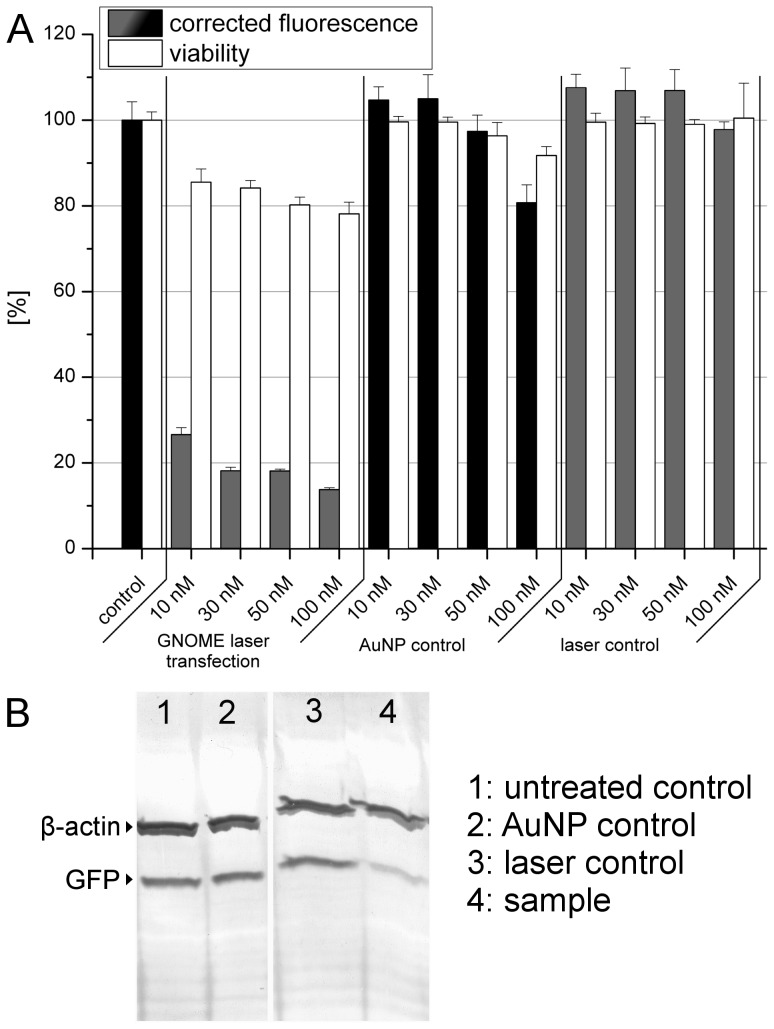
Figure 7
siRNA mediated GFP knock down.
A: GFP Fluorescence depletion after GNOME transfection of different siRNA concentrations. No pronounced knock down was observed in the laser and AuNP controls. Values represent the mean of nu200a=u200...

Figure 8
Absorbance spectra of 200 nm AuNP in RPMI after irradiation with different values of radiant exposure.
Figure images are served from the NIH/NLM PubMed Central Open Access Subset or Europe PMC; copyright remains with the publishers and authors.
💬 Discussion
0 commentsNo comments yet. Be the first to start a discussion!
Leave a Comment