Abstract
MicroED is a recently developed method that uses electron diffraction for structure determination from very small three-dimensional crystals of biological material. Previously we used a series of still diffraction patterns to determine the structure of lysozyme at 2.9 Å resolution with MicroED (<xref ref-type="bibr" rid="bib26">Shi et al., 2013</xref>). Here we present the structure of bovine liver catalase determined from a single crystal at 3.2 Å resolution by MicroED. The data were collected by continuous rotation of the sample under constant exposure and were processed and refined using standard programs for X-ray crystallography. The ability of MicroED to determine the structure of bovine liver catalase, a protein that has long resisted atomic analysis by traditional electron crystallography, demonstrates the potential of this method for structure determination.
🔭 Microscopes
🏭 Microscope Brands
🧪 Reagent Suppliers
💻 Software Details
📋 Protocols
💾 Data Repositories
🏛️ Research Organizations (ROR)
Affiliated research institutions:
📋 Methods
Catalase crystallization and sample preparation
Catalase was recrystallized from a commercial aqueous suspension of catalase (C100; Sigma–Aldrich, St. Louis, MO) by first centrifuging the crystalline suspension and dissolving the pellet in 1.7 M NaCl. The solubilized catalase was then centrifuged and the supernatant was dialyzed against 50 mM sodium phosphate pH 6.3 overnight at 4°C. Crystals were removed from dialysis, stored in an Eppendorf tube, and incubated an additional 24 hr at 4°C. Catalase crystals were stored at 4°C and were washed with water prior to sample preparation. To prepare samples for the TEM, crystals were resuspended and the undiluted catalase crystal suspension was applied, blotted and vitrified in liquid ethane as described previously ( Shi et al., 2013 ).
Collection of electron diffraction data
All electron diffraction was performed on a FEI Tecnai F20 TEM operated at 200 kV with a selected area aperture (6 μm in diameter at the specimen) and data were collected with 4k × 4k TVIPS F416 CMOS cameras (15.6 μm pixel size). Diffraction data were collected with a frame rate of 1 frame per 6 s as the sample was continuously rotated from high to low tilt angle at ∼0.09° s −1 (0.54°/frame) as described previously ( Nannenga et al., 2014 ). A data set of approximately 61° was collected from a single crystal. Crystal thickness was estimated by measuring the intensity of the crystal (I) relative to the intensity of a hole in the carbon film (I 0 ) from an image and using Beer's law: l n I I 0 = − ε c t where ε is the molar absorptivity, c is the molar concentration, and t is the crystal thickness. As an approximation, the value of εc for catalase was assumed to be the same as those for calculated for lysozyme. The lysozyme coefficients were determined using images of lysozyme microcrystals with a known thickness as described previously ( Nannenga et al., 2014 ).
Show full methods section
Catalase crystallization and sample preparation
Catalase was recrystallized from a commercial aqueous suspension of catalase (C100; Sigma–Aldrich, St. Louis, MO) by first centrifuging the crystalline suspension and dissolving the pellet in 1.7 M NaCl. The solubilized catalase was then centrifuged and the supernatant was dialyzed against 50 mM sodium phosphate pH 6.3 overnight at 4°C. Crystals were removed from dialysis, stored in an Eppendorf tube, and incubated an additional 24 hr at 4°C. Catalase crystals were stored at 4°C and were washed with water prior to sample preparation. To prepare samples for the TEM, crystals were resuspended and the undiluted catalase crystal suspension was applied, blotted and vitrified in liquid ethane as described previously ( Shi et al., 2013 ).
Collection of electron diffraction data
All electron diffraction was performed on a FEI Tecnai F20 TEM operated at 200 kV with a selected area aperture (6 μm in diameter at the specimen) and data were collected with 4k × 4k TVIPS F416 CMOS cameras (15.6 μm pixel size). Diffraction data were collected with a frame rate of 1 frame per 6 s as the sample was continuously rotated from high to low tilt angle at ∼0.09° s −1 (0.54°/frame) as described previously ( Nannenga et al., 2014 ). A data set of approximately 61° was collected from a single crystal. Crystal thickness was estimated by measuring the intensity of the crystal (I) relative to the intensity of a hole in the carbon film (I 0 ) from an image and using Beer's law: l n I I 0 = − ε c t where ε is the molar absorptivity, c is the molar concentration, and t is the crystal thickness. As an approximation, the value of εc for catalase was assumed to be the same as those for calculated for lysozyme. The lysozyme coefficients were determined using images of lysozyme microcrystals with a known thickness as described previously ( Nannenga et al., 2014 ).
Data processing and structure refinement Raw
TEM diffraction data were converted and processed using MOSFLM v7.1.0 ( Leslie and Powell, 2007 ) and it's graphical interface iMOSFLM v1.0.7 ( Battye et al., 2011 ), POINTLESS ( Evans, 2006 ), and AIMLESS ( Evans and Murshudov, 2013 ) as described in previous work ( Nannenga et al., 2014 ). MOLREP ( Vagin and Teplyakov, 1997 ) was used to perform molecular replacement using catalase PDB ID: 3NWL ( Foroughi et al., 2011 ) as a search model (MOLREP contrast score = 40.8), and the molecular replacement solution was refined in PHENIX ( Adams et al., 2010 ) and REFMAC ( Murshudov et al., 1997 ) using a 5% free data set. Maps in Figure 3E,F,G and H were calculated using BUSTER-TNT ( Blanc et al., 2004 ). Maps and models were displayed using the UCSF Chimera package ( Pettersen et al., 2004 ).
Additional files Major dataset
The following previously published datasets were used: Foroughi LM , Kang YN , Matzger AJ , 2011 , The crystal structure of the P212121 form of bovine liver catalase previously characterized by electron microscopy , http://www.pdb.org/pdb/explore/explore.do?structureId=3nwl , Publicly available at RCSB Protein Data Bank. Ko TP , Day J , Malkin AJ , McPherson A , 1999 , The structure of orthorhombic crystals of beef liver catalase , http://www.pdb.org/pdb/explore/explore.do?structureId=4blc , Publicly available at RCSB Protein Data Bank. Purwar N , McGarry JM , Kostera J , Pacheco AA , Schmidt M , 2011 , Structural and kinetic analysis of the beef liver catalase complexed with nitric oxide , http://www.pdb.org/pdb/explore/explore.do?structureId=3rgp , Publicly available at RCSB Protein Data Bank.
📊 Figures
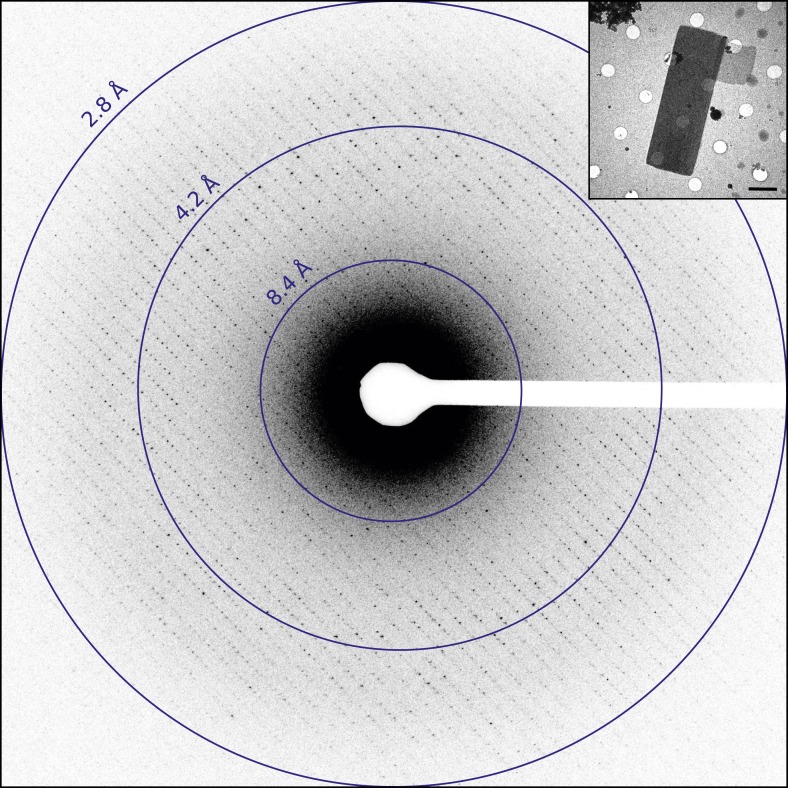
Figure 1.
Diffraction from catalase microcrystals.
Representative untilted still diffraction pattern of a catalase microcrystal that shows sharp reflections extending to approximately 3.0 u00c5. Crystals of this quality were used to collect a data set...
Video 1.
Catalase diffraction data set collected by continuous rotation.
Diffraction data was recorded at an exposure time of 6 s per frame from a single crystal as the stage was continuously rotating at u223c0.09u00b0 s u22121 . DOI: http://dx.doi.org/10.7554/eLife.03600....
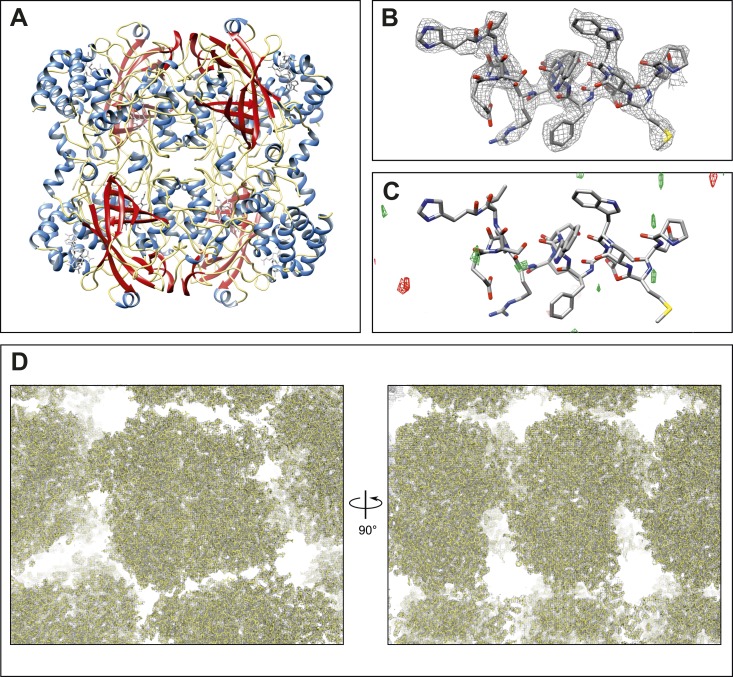
Figure 2.
Final structure of catalase at 3.2 u00c5 resolution determined by MircoED.
( A ) The complete refined catalase structure shown as ribbons. The corresponding 2mF obs -DF calc density map around the complete structure can be seen in Video 2 . ( B ) The density map, contoured a...
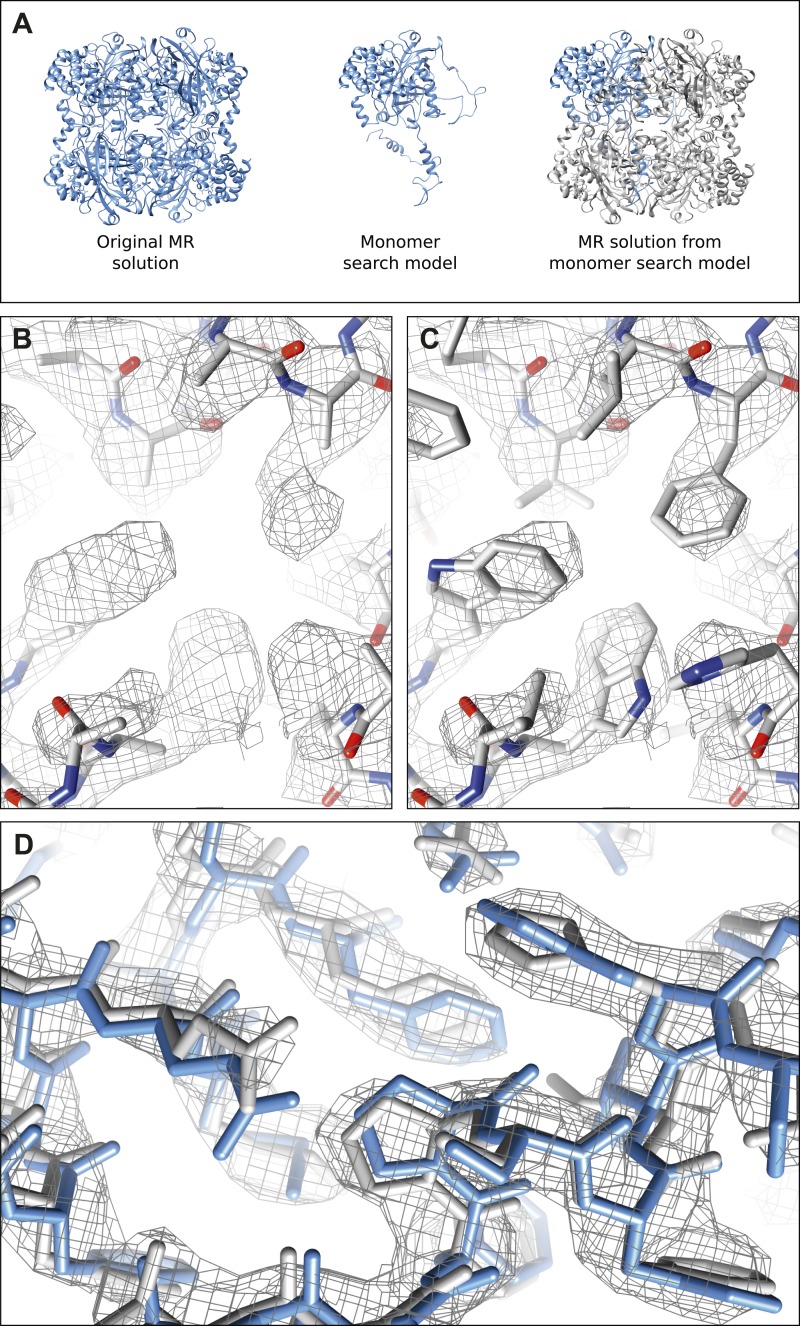
Figure 2u2014figure supplement 1.
Molecular replacement validation tests.
( A ) The results of the single monomer MR show that all four chains of the tetramer could be properly placed. The RMSD between this MR solution and the original MR solution from complete tetramer sea...
Video 2.
Final density map and model of catalase at 3.2 u00c5.
The 2mF obs -DF calc density map contoured at 1.5 u03c3 shows good agreement with the final refined model. DOI: http://dx.doi.org/10.7554/eLife.03600.009
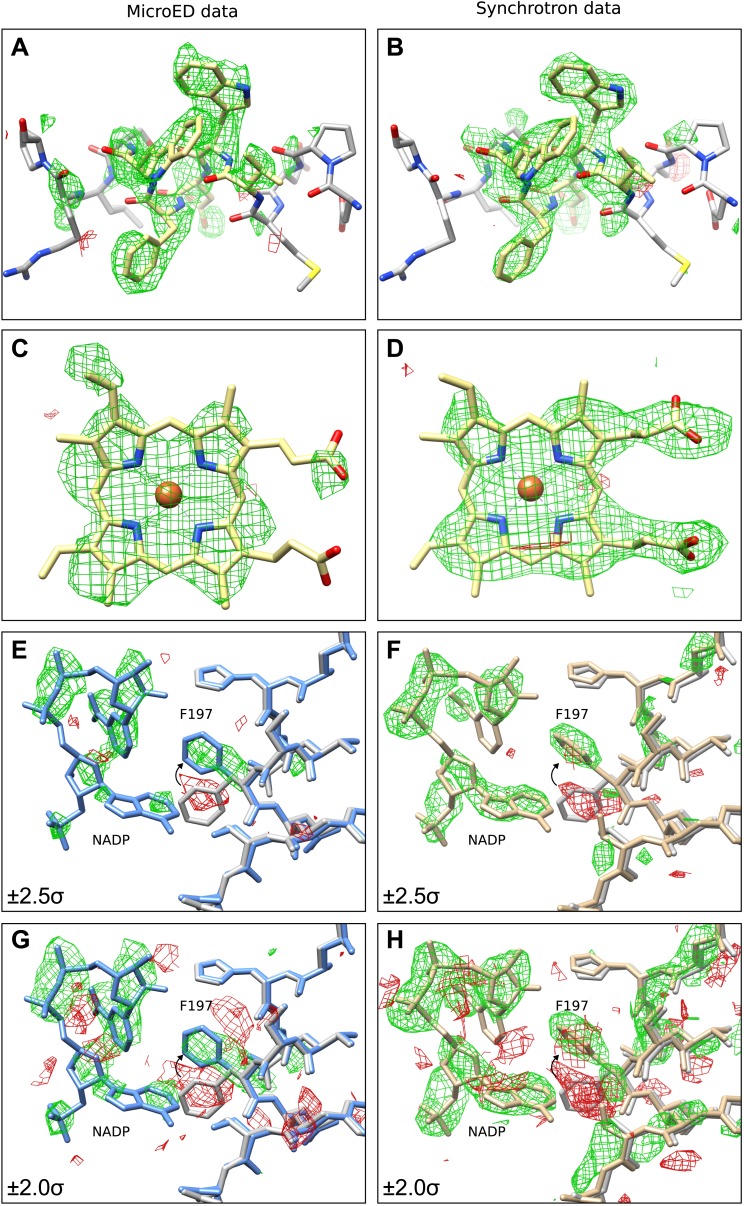
Figure 3.
Final Model validation tests.
( A u2013 D ) To check for model bias in the final MicroED data ( A and C ), and to compare with data obtained from synchrotron X-ray diffraction ( B and D ), residues 181u2013185 ( A u2013 B ) or the...
Figure images are served from the NIH/NLM PubMed Central Open Access Subset or Europe PMC; copyright remains with the publishers and authors.
💬 Discussion
0 commentsNo comments yet. Be the first to start a discussion!
Leave a Comment