Abstract
Abstract Background Glaucoma, the leading cause of irreversible blindness worldwide, is a type of retinal disease characterized by the selective death of retinal ganglion cells (RGCs). However, the pathogenesis of glaucoma has not been fully elucidated. Transient receptor potential vanilloid 4 (TRPV4) is a pressure-sensitive and calcium-permeable cation channel. TRPV4 is widely distributed in the retina and its sustained activation leads to RGC death; indicating that TRPV4 may be a possible target for glaucoma treatment. Here, we investigated the effects of TRPV4 on RGC apoptosis in a rat model of chronic ocular hypertension (COH), then examined the mechanism underlying these effects. Methods The COH model was established by injection of micro-magnetic beads into the anterior chamber of adult male rats. The expression levels of TRPV4, glial fibrillary acidic protein, and inflammatory factors were assessed by immunohistochemistry and immunoblotting. RGC apoptosis and visual dysfunction were evaluated by TUNEL assay and photopic negative response. Functional expression of TRPV4 was examined by electrophysiology and calcium imaging. Real-time polymerase chain reaction and immunoblotting were employed to investigate the molecular mechanism underlying the effects of TRPV4 on tumor necrosis factor-α (TNF-α) release. Results We found that TRPV4 played an essential role in glaucoma, such that high levels of TRPV4 expression were associated with elevated intraocular pressure. Furthermore, TRPV4 activation was involved in glaucoma-induced RGC apoptosis and RGC-related reductions in visual function. Mechanistic investigation demonstrated that TRPV4 activation led to enhanced Müller cell gliosis and TNF-α release via the JAK2/STAT3/NF-kB pathway, while TRPV4 inhibition could reverse these effects. Finally, TRPV4 activation could lead to elevated expression of TNF receptor 1 in RGCs, while inhibition of TNF-α could reduce TRPV4-mediated RGC apoptosis. Conclusions TRPV4 activation induces Müller cell gliosis and TNF-α elevation via the JAK2/STAT3/NF-κB pathway, which may exacerbate RGC apoptosis in glaucoma; these results suggest that TRPV4 can serve as a therapeutic target in glaucoma treatment.
🔬 Techniques
🔭 Microscopes
💻 Software
✨ Fluorophores
🧪 Sample Preparation
🔬 Cell Lines
🏭 Microscope Brands
🧪 Reagent Suppliers
💻 Software Details
🏛️ Research Organizations (ROR)
Affiliated research institutions:
📋 Methods
The COH model was established by injection of micro-magnetic beads into the anterior chamber of adult male rats. The expression levels of TRPV4, glial fibrillary acidic protein, and inflammatory factors were assessed by immunohistochemistry and immunoblotting. RGC apoptosis and visual dysfunction were evaluated by TUNEL assay and photopic negative response. Functional expression of TRPV4 was examined by electrophysiology and calcium imaging. Real-time polymerase chain reaction and immunoblotting were employed to investigate the molecular mechanism underlying the effects of TRPV4 on tumor necrosis factor-α (TNF-α) release.
Methods Animals
All experimental animal procedures were performed in accordance with the National Institutes of Health guidelines for the Care and Use of Laboratory Animals, as well as the guidelines of Fudan University for the ethical use of animals. Wistar rats (weighing 180–200 g) were purchased from SLAC Laboratory Animal Co., Ltd. (Shanghai, China).
Sox2-Cre mice
(B6.Cg-Tg(Sox2-cre)1Amc/J) were crossed with Rosa26 mice (B6. Cg-Gt(ROSA)26Sor tm14(CAG-tdTomato)Hze/J) obtained from Jackson Laboratory Animal Co., Ltd. (USA) to create TdTomato-labeled Müller-transgenic mice. Rat model of COH COH modeling was performed as in our previous studies [ 32 ]. Briefly, rats were anesthetized deeply with a mixture of ketamine (25 mg/kg, im) and xylazine (10 mg/kg, im); eyes were locally anesthetized via topical application of 0.4% oxybuprocaine hydrochloride eyedrops (Benoxil, Santen Pharmaceutical Co. Ltd., Osaka, Japan). Micro-magnetic beads (8 μl, BioMag® Superparamagnetic Iron Oxide, Bangs Laboratories, Inc., Fisher, IN, USA) were injected into the anterior chamber of the right eye. Sham injection (0.9% saline) was performed in a conventional manner in the contralateral eye (left eye); this served as the sham-operated group. IOP was measured using a handheld digital tonometer (Tonolab, TioLat, Finland); measurements were performed in the morning to avoid possible circadian differences. The IOPs of both eyes were recorded before surgery (control); they were also recorded at 1 day, 3 days, 1 week, 2 weeks, and 3 weeks after surgery (Fig. 1 ). Fig. 1 Rat chronic ocular hypertension (COH) model. Mean intraocular pressure (IOP) before (control) and after (≥ 1 day) a single unilateral injection of micro-magnetic beads (8 µl) in rat retinas, showing microbead-induced elevations in IOP (COH). n = 9–47. *** p < 0.001 vs sham-operated treatment at the same timepoint and ### p < 0.001 vs control Intravitreal injection Intravitreal injections were performed as in our previous studies [ 33 ]. The TRPV4 agonist, GSK1016790A (GSK101) (1 µM or 10 µM); TRPV4 antagonist, HC-067047 (HC-067) (10 µM); or inhibitor of soluble TNF-α, R7050 (1 µM), were suspended in 2 μl of 0.9% saline and injected into the vitreous space at a post-limbal location. HC-067 and R7050 were pre-injected 1–2 days before GSK101 injection; samples were collected for analysis at 1 week after injection of GSK101. HC-067 was pre-injected 2 days before initiation of COH modeling; samples were collected for analysis at 2 weeks after COH model establishment. Eyes that received an injection of saline (2 μl) alone in the same manner served as negative controls.
Show full methods section
The COH model was established by injection of micro-magnetic beads into the anterior chamber of adult male rats. The expression levels of TRPV4, glial fibrillary acidic protein, and inflammatory factors were assessed by immunohistochemistry and immunoblotting. RGC apoptosis and visual dysfunction were evaluated by TUNEL assay and photopic negative response. Functional expression of TRPV4 was examined by electrophysiology and calcium imaging. Real-time polymerase chain reaction and immunoblotting were employed to investigate the molecular mechanism underlying the effects of TRPV4 on tumor necrosis factor-α (TNF-α) release.
Methods Animals
All experimental animal procedures were performed in accordance with the National Institutes of Health guidelines for the Care and Use of Laboratory Animals, as well as the guidelines of Fudan University for the ethical use of animals. Wistar rats (weighing 180–200 g) were purchased from SLAC Laboratory Animal Co., Ltd. (Shanghai, China).
Sox2-Cre mice
(B6.Cg-Tg(Sox2-cre)1Amc/J) were crossed with Rosa26 mice (B6. Cg-Gt(ROSA)26Sor tm14(CAG-tdTomato)Hze/J) obtained from Jackson Laboratory Animal Co., Ltd. (USA) to create TdTomato-labeled Müller-transgenic mice. Rat model of COH COH modeling was performed as in our previous studies [ 32 ]. Briefly, rats were anesthetized deeply with a mixture of ketamine (25 mg/kg, im) and xylazine (10 mg/kg, im); eyes were locally anesthetized via topical application of 0.4% oxybuprocaine hydrochloride eyedrops (Benoxil, Santen Pharmaceutical Co. Ltd., Osaka, Japan). Micro-magnetic beads (8 μl, BioMag® Superparamagnetic Iron Oxide, Bangs Laboratories, Inc., Fisher, IN, USA) were injected into the anterior chamber of the right eye. Sham injection (0.9% saline) was performed in a conventional manner in the contralateral eye (left eye); this served as the sham-operated group. IOP was measured using a handheld digital tonometer (Tonolab, TioLat, Finland); measurements were performed in the morning to avoid possible circadian differences. The IOPs of both eyes were recorded before surgery (control); they were also recorded at 1 day, 3 days, 1 week, 2 weeks, and 3 weeks after surgery (Fig. 1 ). Fig. 1 Rat chronic ocular hypertension (COH) model. Mean intraocular pressure (IOP) before (control) and after (≥ 1 day) a single unilateral injection of micro-magnetic beads (8 µl) in rat retinas, showing microbead-induced elevations in IOP (COH). n = 9–47. *** p < 0.001 vs sham-operated treatment at the same timepoint and ### p < 0.001 vs control Intravitreal injection Intravitreal injections were performed as in our previous studies [ 33 ]. The TRPV4 agonist, GSK1016790A (GSK101) (1 µM or 10 µM); TRPV4 antagonist, HC-067047 (HC-067) (10 µM); or inhibitor of soluble TNF-α, R7050 (1 µM), were suspended in 2 μl of 0.9% saline and injected into the vitreous space at a post-limbal location. HC-067 and R7050 were pre-injected 1–2 days before GSK101 injection; samples were collected for analysis at 1 week after injection of GSK101. HC-067 was pre-injected 2 days before initiation of COH modeling; samples were collected for analysis at 2 weeks after COH model establishment. Eyes that received an injection of saline (2 μl) alone in the same manner served as negative controls.
Immunoblotting
Immunoblotting was performed as previously described, using the Wes Simple Western system (ProteinSimple, San Jose, CA, USA) [ 33 ]. For whole-cell protein extraction, retinas were rapidly collected, then homogenized in RIPA lysis buffer that had been supplemented with protease and phosphatase inhibitor cocktails (Roche Applied Science, Mannheim, Germany). Protein concentrations of whole-cell extracts were measured using a standard bicinchoninic acid assay kit (Pierce Biotechnology, Rockford, IL, USA), then analyzed using a Wes Simple Western instrument (ProteinSimple), in accordance with the manufacturer’s instructions. Protein samples were mixed with fluorescent 5X master mix (ProteinSimple), then heated at 95 °C for 5 min. The total quantity of protein used for immunoblotting was 40 ng per sample. The following components were loaded into the Wes plate (Wes 12–230 kDa or 2–40 kDa Pre-filled Plates with Split Buffer, ProteinSimple): boiled samples, biotinylated protein ladder, blocking buffer, primary antibodies, ProteinSimple horseradish peroxidase-conjugated anti-rabbit or anti-mouse secondary antibodies, luminol-peroxide, and wash buffer. Plates and capillary cartridges were loaded into the Wes instrument; protein separation, antibody incubation, and imaging were performed using default parameters.
Compass software
(ProteinSimple) was used to acquire the data, then perform image reconstruction and examine chemiluminescence signal intensity. Protein and phosphorylation levels were expressed as the area of peak chemiluminescence intensity. The following primary antibodies were used: anti-TRPV4 (cat. no. LS- C94498 , 1:20, Labome), anti-GFAP (cat. no. ab7260, 1:500, Abcam, Cambridge, MA, USA), anti-TNF-a (cat. no. PB0270, 1:10, Boster or cat. no. ab6671, 1:10, Abcam), anti-STAT3 (cat. no. ab68153, 1:500, Abcam), anti-phosphorylated STAT3 (cat. no. ab76315, 1:50, Abcam), anti-JAK2 (cat. no. ab32101, 1:50, Abcam), anti-phosphorylated JAK2 (cat. no. mAb3776, 1:10, Cell Signaling Technology, Danvers, MA, USA), anti-NLRP3 (cat. no. ab263899, 1:100, Abcam), anti-caspase 1 (cat. no. AF5418, 1:10, Affinity), anti-TNF receptor 1 (cat. no. ab90463, 1:50, Abcam), and anti-GAPDH (cat. no. D16H11, 1:200, Cell Signaling Technology). Immunoblotting of nuclear protein extracts was performed as previously described [ 34 ]. For nuclear protein extraction, the Nucleus-Cytosol Extraction kit (Applygen Technologies, Inc., Beijing, China) was used, in accordance with the manufacturer’s instructions. The extracted protein samples were separated on an 10% SDS-PAGE gel and electrotransferred to PVDF membranes (Immobilon-P, Millipore, Billerica, MA, USA). The following primary antibodies were used: anti-NF-κB p65 (cat. no. 10745-1-AP, 1:2000, Proteintech) and anti-lamin B receptor (cat. no. ab32535, 1:500, Abcam). The membranes were incubated with donkey anti-mouse, anti-rabbit, or anti-goat IgG HRP (Jackson ImmunoResearch Labs) for 1.5 h at room temperature; they were then incubated with enhanced chemifluorescence reagent (Pierce Biotechnology). The blots were imaged with a digital imager (FluorChem E System, ProteinSimple) and protein bands were quantitatively analyzed with Alpha View software (Cell Biosciences, Inc.).
Immunohistochemistry
Immunohistochemistry was performed as described in previous studies [ 32 , 34 ]. Briefly, Müller cells were cultured on cover slips, then fixed with 4% paraformaldehyde for 20 min. For analysis of rat tissue, retinas were fixed with 4% paraformaldehyde for 2 h and dehydrated with graded sucrose solutions at 4 °C, then vertically sectioned at a thickness of 10 μm (Leica, Nussloch, Germany). After the cultured cells or retinal sections had been washed in PBS, they were blocked for 1.5 h in 10% donkey serum, 3% BSA, and 0.1% Triton X-100. Subsequently, they were incubated with the following primary antibodies at 4 °C overnight: anti-TRPV4 (cat. no. ACC-034, 1:200, Alomone Labs), anti-glutamine synthetase (GS, cat. no. GTX109121, 1:400, GeneTex), anti-GFAP (cat. no. bs-0199R, 1:500, Bioss), and anti-NF-κB p65 (cat. no.sc-372, 1:200, Santa Cruz). As negative controls, TRPV4 and GFAP antibodies were pre-adsorbed with TRPV4 blocking peptide (Alomone Labs) and GFAP blocking peptide (Bioss), respectively. Binding sites of the primary antibody were visualized by incubation with Alexa Fluor 488-conjugated goat anti-mouse IgG (1:500 dilution) and Alexa Fluor 555-conjugated donkey anti-rabbit IgG (1:500 dilution, both secondary antibodies from Invitrogen-Molecular Probes) for 1 h at room temperature. Sections were sealed under coverslips with anti-fade mounting medium containing 4′,6-diamidino-2-phenylindole (DAPI, Vector Laboratories, Burlingame, CA, USA); immunofluorescence images were visualized with a confocal laser scanning microscope (FluoView 1000, Olympus, Tokyo, Japan).
Retinal slices and electrophysiological recordings
Rats were deeply anesthetized; their eyes were enucleated quickly, then immersed in ice-cold artificial cerebrospinal fluid (ACSF) containing (in mM): NaCl 125, KCl 3, NaHCO 3 26, Na 2 HPO 4 1.25, CaCl 2 2, MgCl 2 1, and glucose 15 (pH 7.4), with 95% O 2 and 5% CO 2 bubbled through the solution. Subsequently, retinas were isolated and sliced vertically at a thickness of 200 μm on a Narishige slicer (ST-20-P, Tokyo, Japan). Slices were transferred to a holding chamber, where they were fully submerged in oxygenated ACSF solution and maintained at room temperature (24–25 °C) for 30 min before recording. Whole-cell voltage and current-clamp recordings were performed using standard techniques, as described previously [ 32 ]. Individual slices were transferred to a chamber that was continuously superfused with oxygenated ACSF at a rate of 1–2 ml/min at room temperature. RGCs were identified by their locations and morphologies, then further identified by intracellular injection of Alexa Fluor 488. Cells were detected with a charge-coupled device camera and displayed on a monitor. Patch pipettes were made by pulling BF150-86-10 glass (Sutter Instrument Co., Novato, CA, USA) onto a P-97 Flaming/Brown micro-pipette puller (Sutter Instrument Co.), then fire-polished (Model MF-830, Narishige, Japan) before recording. Pipette resistance was typically 4–8 MΩ after it had been filled with internal solution. The internal solution consisted of (in mM): potassium D-gluconate 120, ethylene glycol-bis (β-aminoethyl ether) N,N,N′,N′-tetraacetic acid (EGTA) 1, 4-(2-hydroxyethyl) piperazine-1-ethanesulfonic acid (HEPES) 10, ATP·Mg 4, GTP·Na 0.3, phosphocreatine 10, CaCl 2 0.1, MgCl 2 1, and Alexa Fluor 488 (pH 7.2), adjusted with KOH, 280–290 mOsm/L. Whole-cell membrane potentials were recorded from Müller cells using a patch amplifier (Axopatch 700B; Molecular Devices, Foster City, CA, USA) with a Digidata 1440A data acquisition board and pClamp 10.2 software. Drugs were delivered by a gravity-driven superfusion system for at least 5 min before assessment of their effects.
Calcium imaging
Müller cells were seeded on glass coverslips for 24 h, loaded with Fura-2AM (4 μg/ml, Thermo, Waltham, MA, USA) for 30 min, and washed with the bath solution containing (in mM): NaCl 125, KCl 3, NaHCO 3 26, Na 2 HPO 4 1.25, CaCl 2 2, MgCl 2 1, and glucose 15 (pH 7.4) for 5–20 min. Excitation was provided via sequential exposure to 340 and 380 nm wavelengths delivered by LAMBDA 10–3 (Sutter Instrument Co.). The images were captured with Cool SNAP HQ2 (Photometrics) and processed with MetaFluor software (Axon). The data were collected as emission ratios for 340 and 380 nm excitations. Electroretinography (ERG) ERG was performed as previously described [ 35 ]; the results were recorded using an Espion Diagnosys System (Diagnosys LLC, Littleton, MA, USA). After the pupils had been dilated with phenylephrine hydrochloride and tropicamide (0.5%), recording electrodes were placed in the center of the cornea. The reference electrode was placed hypodermically on the central forehead and the grounding electrode was attached to the tail. For assessment of photopic negative response (PhNR), light stimulation was performed at 20 cd seconds per meter squared (cd.s/m 2 ) green light–0.5 Hz against a white background of 30 cd.s/m 2 for 4 ms. The PhNR value refers to the amplitude from baseline to trough. For scotopic ERG analysis, rats were adapted in darkness overnight before recording, and white flashes of 1 cd.s/m 2 were applied as flash stimuli. The a-wave (first negative peak) and b-wave (first positive peak) amplitudes were measured and recorded.
Cell apoptosis assay
To detect cell apoptosis, terminal dUTP nick end labeling (TUNEL) assays were performed on whole flat-mounted retinas, using the DeadEnd Fluorometric TUNEL System G3250 kit (Promega, Madison, WI, USA), as described previously [ 36 ]. TUNEL signals were visualized with a confocal laser scanning microscope through a 10X objective (FluoView 1000, Olympus). Each retina was mounted with the ganglion cell layer (GCL) upturned; serial deep scanning was performed only in the GCL, based on the DAPI staining results. All TUNEL-positive signals that merged well with DAPI signals in each retina were counted. Retrograde labeling and enumeration of RGCs Five days before killing, rats were deeply anesthetized. Then, 2 μl of 3% of FluoroGold (Sigma-Aldrich, St. Louis, MO, USA) was injected into the superior colliculus on each side, as previously reported [ 37 ]; notably, FluoroGold is taken up by RGC axon terminals and bilaterally transported in a retrograde manner to the cell somata. At the time of killing, the rats’ eyeballs were enucleated and directly fixed in 4% paraformaldehyde for 1.5 h at room temperature. The retinas were then carefully dissected and prepared as flatmounts. To quantify the densities of labeled RGCs, each retina was divided into four quadrants. Sixteen microscopic fields of each retina were counted: two from the central region (1.5 mm from the optic disc) and two from the peripheral region retina (3 mm from the optic disc) for each quadrant. RGC densities (cells/mm 2 ) were grouped according to retinal eccentricity (central and peripheral) and expressed as means ± standard errors of the mean (means ± SEMs). Cultures of primary retinal Müller cells and RGCs Primary Müller cell cultures were prepared in accordance with established procedures [ 34 ]. Briefly, retinas isolated from newborn Wistar rats (postnatal day 5) were digested with 0.25% trypsin for 5 min at 37 °C. Cell suspensions were cultured in Dulbecco’s modified Eagle medium (DMEM/F12; Gibco, Life Technologies, Rockville, MD, USA), supplemented with 10% fetal bovine serum, 100 U/ml penicillin, and 100 μg/ml streptomycin; they were grown in a humidified atmosphere with 5% CO 2 at 37 °C. Microglia and unattached cells were removed by blowing with a fire-polished Pasteur pipette. Third-generation Müller cells, cultured for up to 21 days, were used for experiments. RGCs were purified and cultured as previously described [ 38 ]. Retinal suspensions were incubated in two anti-rat-macrophage panning plates (Millipore; 15 μl in 7.5 ml of 1 mM Tris buffer, pH 9.5 at 4 °C overnight) at 37 °C for 40 min; each plate was shaken at 20-min intervals. The nonadherent cells were transferred to two anti-rat-Thy1.1 panning plates (Abcam; 15 μl in 7.5 ml of 1 mM Tris buffer, pH 9.5 at 4 °C overnight) at 37 °C for 1 h; each plate was shaken at 20-min intervals. The plates were subsequently washed three times with Dulbecco’s PBS and moderately swirled to dislodge nonadherent cells. Each plate was incubated at 37 °C for 2 min with EBSS media containing 0.25% trypsin (Gibco). Immediately after treatment, DMEM (Gibco) with 30% fetal bovine serum (Gibco) was added to each plate to inactivate the trypsin. After cells had been centrifuged at 200 × g for 5 min, they were seeded on glass coverslips that had been coated with 0.01% poly- d -lysine (Sigma-Aldrich). Purified RGCs were maintained in Neurobasal medium (Gibco) containing supplemental factors and grown at 37 °C in a humidified atmosphere containing 5% CO 2 and 95% air; these cells were used for experiments. Cultured cells were treated with GSK101 (10 μM) for 24 h. For inhibition experiments, the inhibitor HC-067 (10 μM) was added to the medium 30 min before GSK101 treatment. Real-time polymerase chain reaction Total RNA was isolated from cultured Müller cells using RNAiso Plus (Takara Co., Japan). Real-time polymerase chain reaction assays were performed as previously described [ 34 ]. Forward and reverse primer sequences were 5′-ACTGAACTTCGGGGTGATCG-3′ and 5'-GCTTGGTTTGCTACGAC-3′ for TNF-α; 5′-GACTTCACCATGGAACCCGT-3′ and 5'-GGAGACTGCCCATTCTCGAC-3′ for IL-1β; 5′-AGCGATGATGCACTGTCAGA-3′ and 5′-TAGCACACTAGGTTTGCCGA-3′ for IL-6; and 5'-CCGCGAGTACAACCTTCTTG-3′ and 5′-CAGTTGGTGACAATGCCGTG-3′ for β-actin, respectively. The thermal cycling conditions were 95 °C for 2 min, followed by 40 cycles of 45 s at 95 °C, 45 s at 58 °C or 60 °C, and 45 s at 72 °C. The amplification reactions were performed using an amplification device (Eppendorf, realplex 4, GER), which yielded a melting curve. Data were analyzed using the 2 −ΔΔct calculation method.
Statistical analysis
All experiments involving cultured cells were performed at least in triplicate using three separate batches of cultures. Data analysis was performed using Clampfit 10.2 (Molecular Devices), SigmaPlot 14.0 (SyStat, San Jose, CA, USA), GraphPad Prism 6.0 (GraphPad Software, Inc, La Jolla, CA, USA), and Igor 4.0 (WaveMetrics, Lake Oswego, OR, USA). Before any statistical analyses, data were evaluated using the Shapiro–Wilk test or Brown–Forsythe test to determine whether they exhibited normality or homogeneity of variance, respectively. If the Shapiro–Wilk test yielded a p value of < 0.05, the Friedman repeated-rank test and Wilcoxon signed-rank test were used instead of ordinary one-way ANOVA and paired t tests. If the Brown–Forsythe test yielded a p value of < 0.05, the Mann–Whitney U test, Friedman test, and Kruskal–Wallis test were used instead of t tests, repeated-measures one-way ANOVA (RM one-way ANOVA), and ordinary one-way ANOVA, respectively. Data are expressed as means ± SEMs. A value of p < 0.05 was considered statistically significant.
Supplementary Information Additional file 1: Fig. S1. Effects of GSK101 on a-wave and b-wave amplitudes in scotopic ERG. A, Representative scotopic ERG results at 1 week after GSK101 injection. B, Data analyses of a-wave and b-wave amplitudes in scotopic ERG at 1 week after GSK101 injection, n = 4, * p < 0.05.
📊 Figures
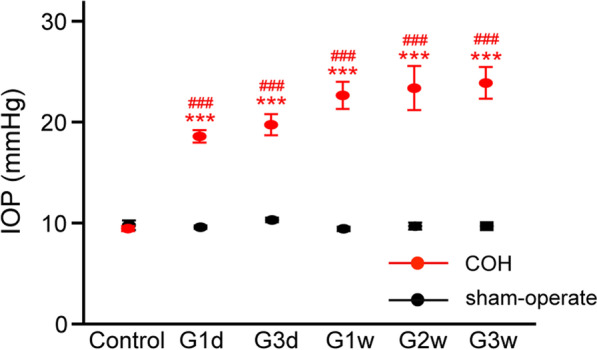
Fig. 1
Rat chronic ocular hypertension (COH) model. Mean intraocular pressure (IOP) before (control) and after (u2265u20091u00a0day) a single unilateral injection of micro-magnetic beads (8u00a0u00b5l) in ra...
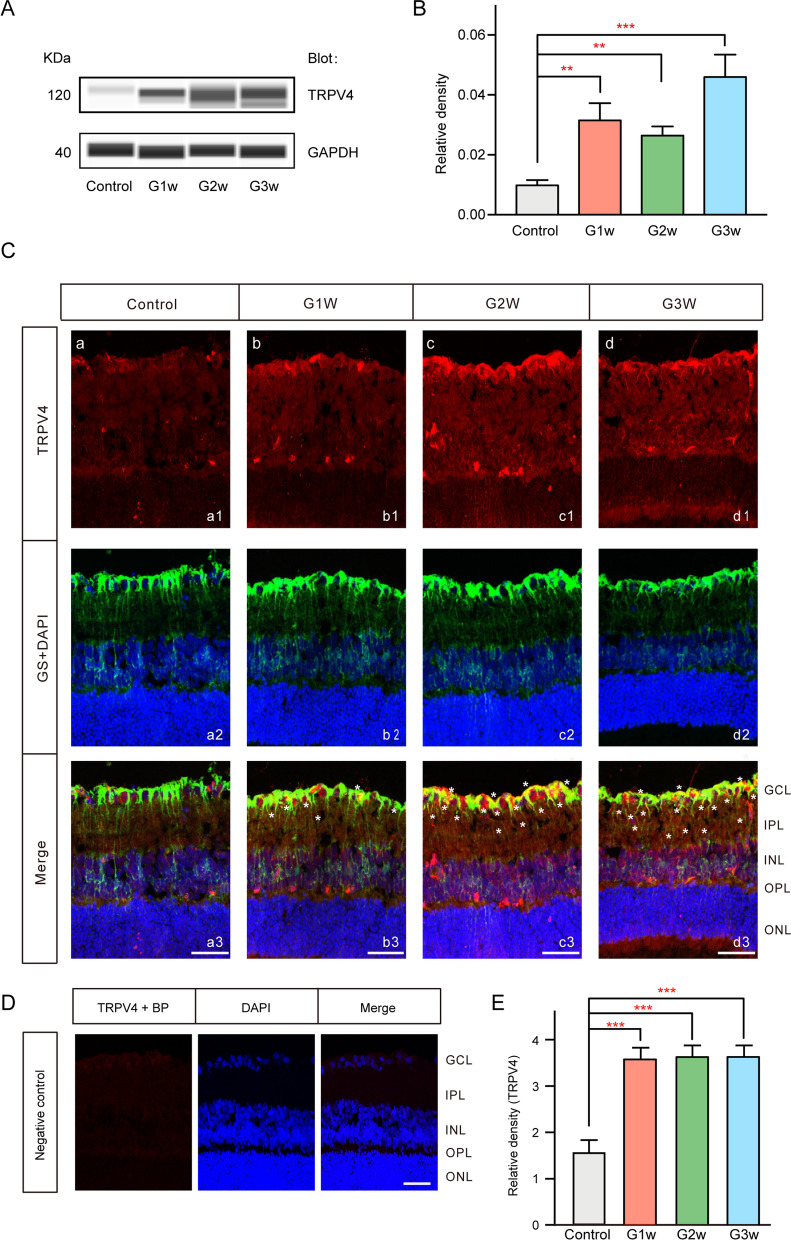
Fig. 2
Changes in TRPV4 protein levels in retinas of rats with COH. A Representative immunoblots showing changes in TRPV4 protein levels in control and COH retinal extracts at different postoperative times (...
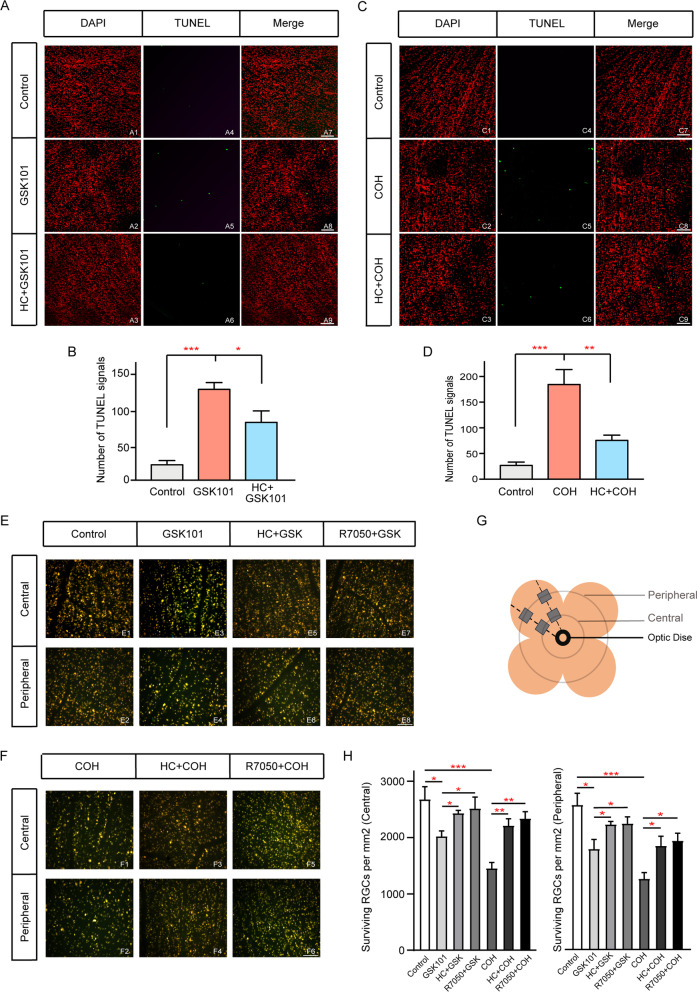
Fig. 3
Effects of GSK101 on retinal ganglion cell (RGC) apoptosis and survival. A TRPV4 activation leads to enhanced RGC apoptosis. A1 u2013 A3 4u2032,6-diamidino-2-phenylindole (DAPI) staining in saline-inj...
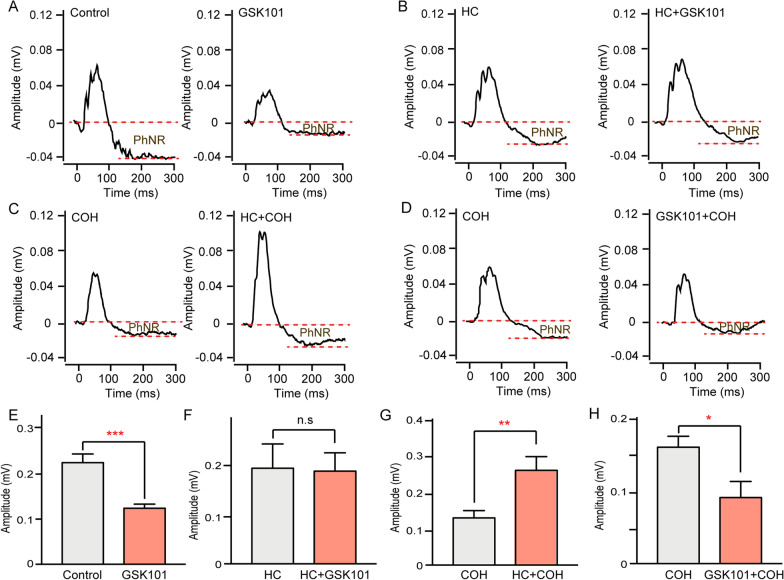
Fig. 4
Effects of GSK101 on retinal ganglion cell (RGC) photopic negative response (PhNR). A Representative PhNR of 1u00a0week retina after saline injection (control) and GSK101 injection (GSK101). B Represe...
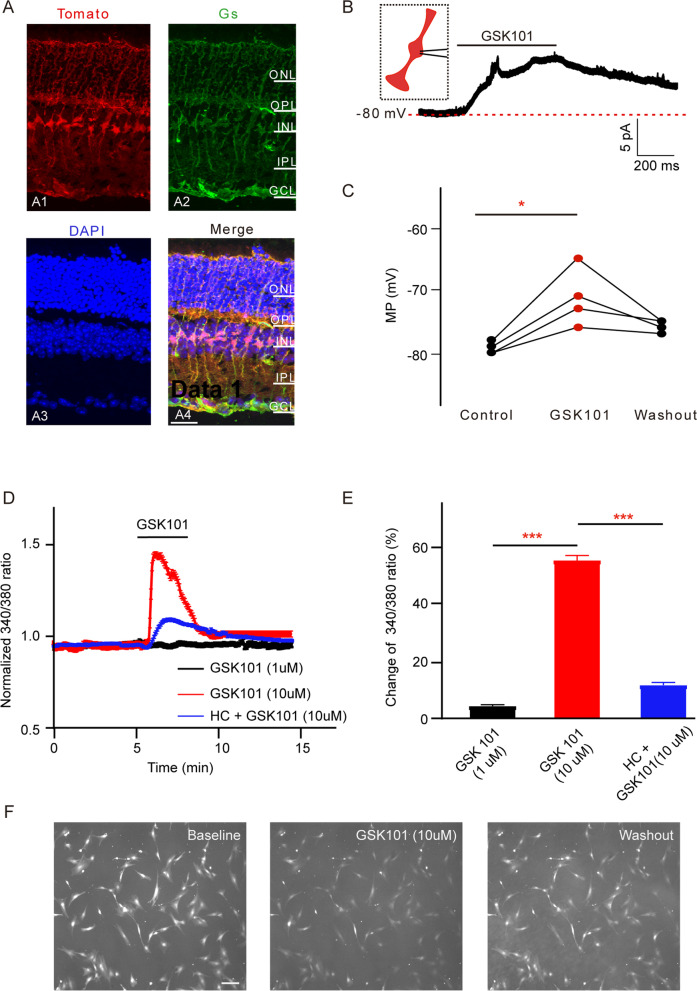
Fig. 5
Mu00fcller cells express functional TRPV4. A Immunofluorescence images show that cells with red autofluorescence are Mu00fcller cells. A1 Immunofluorescence images show cells with red autofluorescence...

Fig. 6
TRPV4 activation enhances the expression of GFAP. A Immunofluorescence images show GFAP protein expression profiles in rat retinal vertical slices acquired from sham-operated retinas (saline-injected;...
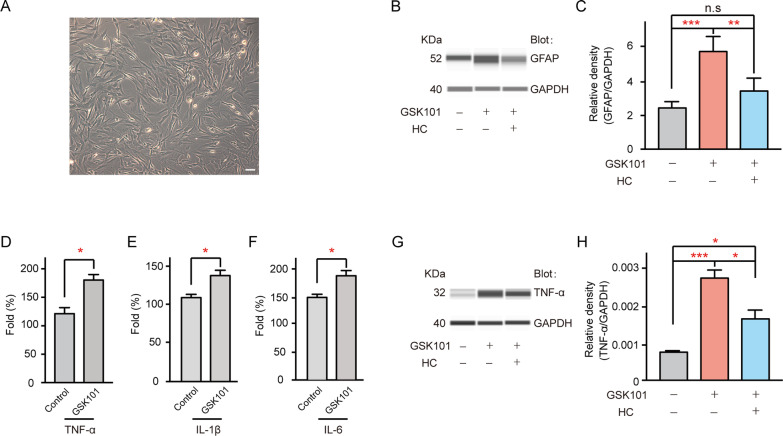
Fig. 7
TRPV4 activation enhances TNF-u03b1 production in cultured Mu00fcller cells. A Morphology of cultured Mu00fcller cells. Scale bar: 50u00a0u00b5m. B GSK101 treatment enhanced GFAP protein levels in cul...

Fig. 8
TRPV4 activation enhances TNF-u03b1 production in retinal tissues. A Cumulative changes in TNF-u03b1 mRNA levels in saline-injected retinas (control) and retinas with GSK101 injection at 1u00a0week. n...
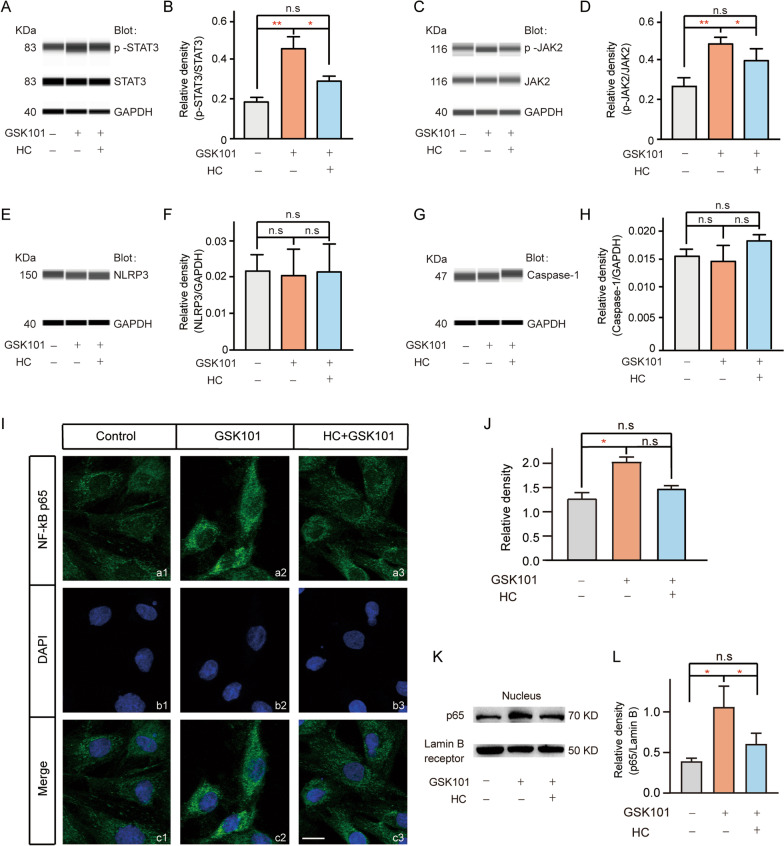
Fig. 9
TRPV4 activation led to increased phosphorylation of JAK2 and STAT3, thereby inducing NF-u03baB p65 translocation from the cytoplasm into the nucleus. A , C Immunoblotting analysis showing that GSK101...

Fig. 10
TRPV4 activation led to enhanced expression of TNF receptor 1 (TNFR1). A Immunoblotting analysis showing that pre-injection of GSK101 enhanced the expression of TNFR1 in the retina, compared with the ...
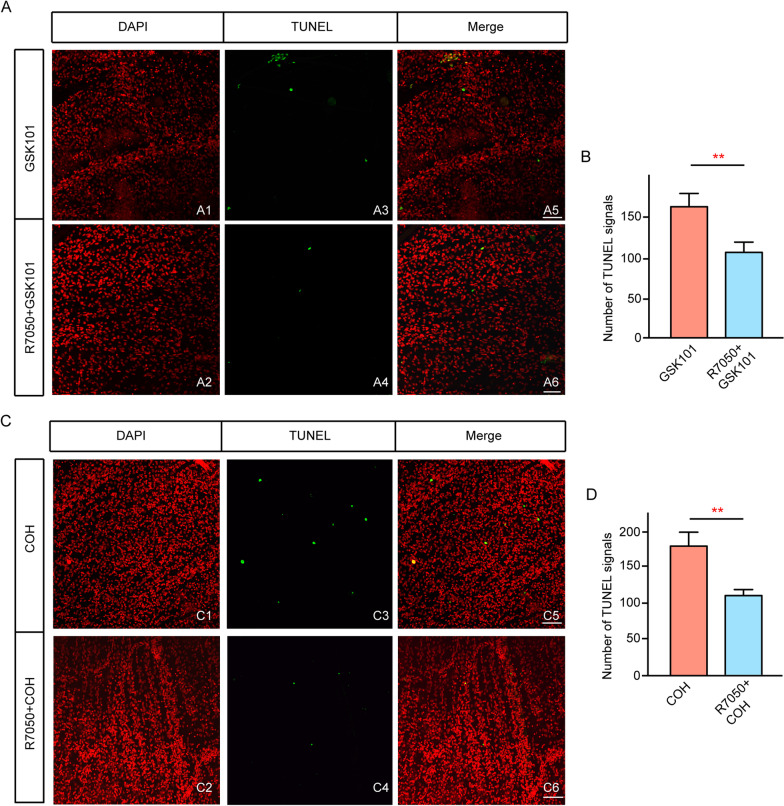
Fig. 11
TNF-u03b1 inhibition reduces TRPV4-mediated retinal cell apoptosis. A1 u2013 A2 DAPI staining in GSK101-injected ( A1 ) and R7050 with GSK101-injected (R7050u2009+u2009GSK101) ( A2 ) whole flat-mounte...

Fig. 12
Schematic diagram showing the signaling pathway involved in TRPV4 activation-mediated TNF-u03b1 production in Mu00fcller cells and RGC apoptosis in COH retinas. NF-u03baB nuclear factor-kappa B, TNF-u...
Figure images are served from the NIH/NLM PubMed Central Open Access Subset or Europe PMC; copyright remains with the publishers and authors.
💬 Discussion
0 commentsNo comments yet. Be the first to start a discussion!
Leave a Comment