Abstract
Multiphoton laser tomography (MPT) combined with fluorescence lifetime imaging (FLIM) is a non-invasive imaging technique, based on the study of fluorescence decay times of naturally occurring fluorescent molecules, enabling a non-invasive investigation of the skin with subcellular resolution. The aim of this retrospective observational ex vivo study, was to characterize melanoma both from a morphologic and a quantitative point of view, attaining an improvement in the diagnostic accuracy with respect to dermoscopy. In the training phase, thirty parameters, comprising both cytological descriptors and architectural aspects, were identified. The training set included 6 melanomas with a mean Breslow thickness±S.D. of 0.89±0.48 mm. In the test phase, these parameters were blindly evaluated on a test data set consisting of 25 melanomas, 50 nevi and 50 basal cell carcinomas. Melanomas in the test phase comprised 8 in situ lesions and had a mean thickness±S.D. of 0.77±1.2 mm. Moreover, quantitative FLIM data were calculated for special areas of interest. Melanoma was characterized by the presence of atypical short lifetime cells and architectural disorder, in contrast to nevi presenting typical cells and a regular histoarchitecture. Sensitivity and specificity values for melanoma diagnosis were 100% and 98%, respectively, whereas dermoscopy achieved the same sensitivity, but a lower specificity (82%). Mean fluorescence lifetime values of melanocytic cells did not vary between melanomas and nevi, but significantly differed from those referring to basal cell carcinoma enabling a differential diagnosis based on quantitative data. Data from prospective preoperative trials are needed to confirm if MPT/FLIM could increase diagnostic specificity and thus reduce unnecessary surgical excisions.
🔬 Techniques
🔭 Microscopes
💻 Software
✨ Fluorophores
🔬 Cell Lines
🏭 Microscope Brands
💻 Software Details
🏛️ Research Organizations (ROR)
Affiliated research institutions:
📋 Methods
Study Design
The study was divided into two parts, a training phase and a test phase. In the former, FLIM images referring to 6 MMs were simultaneously evaluated by 3 observers (SS, CD, PF), for the identification of morphologic descriptors characteristic of MM. Proposed descriptors were discussed and 30 parameters were selected after unanimous approval. In the test phase, the presence/absence of the specified criteria were blindly evaluated on a test data set, by 3 independent observers (SS, FA, CM), who also classified the images into those pertaining to melanoma or "other". Moreover, the mean fluorescence lifetime inside a region of interest corresponding to one representative melanin containing cell of each sample, was calculated on images acquired at an excitation wavelength of 760 nm on 25 MMs, 50 nevi and 50 BCCs samples. The local ethics committee (University of Modena and Reggio Emilia, Modena University Hospital Ethics Committee) granted approval of the study protocol before the start of the study. The patients provided their written informed consent.
Patients and Lesions
The training set included 6 melanomas with a mean Breslow thickness±S.D. of 0.89±0.48 mm. In the test phase ex vivo samples of 25 MMs, 50 nevi and 50 BCCs were considered. MMs, of the superficial spreading type, included 8 in situ lesions and had a mean Breslow thickness (± S.D.) of 0.77 (±1.2) mm (thickness range 0–4.7 mm). No amelanotic and nodular melanomas or lesions showing histological regression were included, but 3 MMs showed a nodular component. Nevi were removed surgically because of equivocal dermoscopic features. BCCs comprised 31 nodular BCCs and 19 superficial BCCs, and one third were pigmented. In all cases, the clinical diagnosis was confirmed by conventional histopathological examination.
Show full methods section
Study Design
The study was divided into two parts, a training phase and a test phase. In the former, FLIM images referring to 6 MMs were simultaneously evaluated by 3 observers (SS, CD, PF), for the identification of morphologic descriptors characteristic of MM. Proposed descriptors were discussed and 30 parameters were selected after unanimous approval. In the test phase, the presence/absence of the specified criteria were blindly evaluated on a test data set, by 3 independent observers (SS, FA, CM), who also classified the images into those pertaining to melanoma or "other". Moreover, the mean fluorescence lifetime inside a region of interest corresponding to one representative melanin containing cell of each sample, was calculated on images acquired at an excitation wavelength of 760 nm on 25 MMs, 50 nevi and 50 BCCs samples. The local ethics committee (University of Modena and Reggio Emilia, Modena University Hospital Ethics Committee) granted approval of the study protocol before the start of the study. The patients provided their written informed consent.
Patients and Lesions
The training set included 6 melanomas with a mean Breslow thickness±S.D. of 0.89±0.48 mm. In the test phase ex vivo samples of 25 MMs, 50 nevi and 50 BCCs were considered. MMs, of the superficial spreading type, included 8 in situ lesions and had a mean Breslow thickness (± S.D.) of 0.77 (±1.2) mm (thickness range 0–4.7 mm). No amelanotic and nodular melanomas or lesions showing histological regression were included, but 3 MMs showed a nodular component. Nevi were removed surgically because of equivocal dermoscopic features. BCCs comprised 31 nodular BCCs and 19 superficial BCCs, and one third were pigmented. In all cases, the clinical diagnosis was confirmed by conventional histopathological examination.
Instrumentation and Elaboration of the Data Multiphoton tomography
In this study we used the MPT DermaInspect® imaging system (Jenlab GmbH, Jena, Germany), which provides intra tissue scanning with subcellular spatial resolution (0.5 µm in lateral direction and 1–2 µm in the axial direction) [8] , [9] , [18] . The instrument has been described in detail elsewhere [19] , [20] .
Fluorescence lifetime imaging
FLIM was implemented in the DermaInspect® system using a TCSPC module with a temporal instrument response function of approximately 250 ps (full-width at half-maximum). Data was collected with time bins separated by 50 ps. A short pass optical filter (Schott BG39) was used to protect the detector (PMH 100-1, Becker & Hickl GmbH, Berlin, Germany) from scattered excitation light. The resulting spectral detection window was ∼ 340 nm –610 nm. The FLIM images were calculated using the software SPCImage (Becker & Hickl GmbH). The raw data was smoothed using a 5 x 5 kernel (corresponding to binning setting 2 in SPCImage) and a single exponential decay was fitted at each pixel. The final image output of the FLIM analysis is a pseudocolor image where the color scale encodes the fluorescence lifetime and image brightness encodes the fluorescence intensity. Images were displayed with a red to blue color scale corresponding to 2 fluorescence lifetime ranges: 0–2000 ps (all figures except Fig. 2c ) and 0–400 ps ( Fig. 2c ). We note that the fluorescence decay recorded in a given single pixel can originate from multiple autofluorescent species that can each have complex multi-exponential decay profiles. Given the relatively small number of photons detected in a single pixel, we chose to fit a single exponential decay model to the data in order to generate an estimate of the mean fluorescence lifetime in that pixel. While more complex multi-exponential decay models can provide additional information, e.g. on relative contributions from different fluorescent species, the use of a single exponential decay model is a straightforward approach enabling fluorescence lifetime contrast to be extracted from the fluorescence decay data. 10.1371/journal.pone.0070682.g002 Figure 2 Multiphoton laser tomography and fluorescence lifetime imaging of melanoma. A, MPT image of upper melanoma layers; B, FLIM image of the same spot displayed by a 0–2000 ps fluorescence lifetime range showing that all cells are melanocytic; C, 0–400 scale, employed to increase contrast for the distinction of cellular details, such as the cytoplasmic halo and the speckling. Dots indicate nuclei with undefined contours; arrows indicate polinucleated cells; asterisks indicate cytoplasmic halo, and triangles speckled melanin. FLIM values do not change, they are only displayed in a different way.
Image Acquisition and Analysis
Ex vivo samples were placed on a cork disc covered by a transparent film and a gauze. For the examination of the samples a drop of water was placed between the skin and the cover glass, which was then attached to a metal coupling ring by circular adhesive tape. The metal coupler was magnetically connected to the MPT system after applying a drop of oil (Immersol™ 518F, Carl Zeiss Ltd, Germany). After finding the correct level, the focus on a specific layer was found by means of the software JLScan_1100. The imaging depth was first pinpointed to the upper layer (stratum corneum). Subsequently, two-dimensional, horizontal images were acquired through optical sectioning parallel to the tissue surface (i.e., in the x–y plane) with an interval of 15 µm. Three-dimensional data sets, called z-stacks, were obtained by sequentially changing the plane of focus (z-level), thus scanning at different tissue depths to a depth of approximately 200 µm. One optical section, consisting of 256×256 pixels, was taken with a scanning time of 25.5 s/frame and an excitation power between 20 and 45 mW. Excitation wavelengths of 760 nm and 820 nm were applied for the assessment of the lesions. When imaging in the dermis, autofluorescence signals from both collagen fibers (SHG signal) and elastin fibers (autofluorescence) can be generated. Separation of these signals was accomplished by an optical filter (Semrock, BLP01-405R-25, ∼0.04% transmission at 415 nm) that can be inserted into the beam path and which excludes the SHG component of the signal when exciting at up to 820 nm. Imaging was accomplished within 30 minutes from biopsy. FLIM images produced by SPCImage were analysed using a custom-written software package to calculate the mean fluorescence lifetime values for selected areas of interest such as single cells on 25 MMs, 50 nevi and 50 BCCs. Dermoscopy Dermoscopic diagnosis was performed on 20-fold and 50-fold magnified images acquired by means of a digital epiluminescence microscope (FotoFinder, TeachScreen software GmbH, Bad Birnbach, Germany) by 3 observers experienced in dermoscopy according to established dermoscopic criteria for MM [22] – [27] . The test data set for dermoscopy comprised the same lesions studied by MPT/FLIM (25 MMs, 50 nevi and 50 BCCs). Images were presented in a mixed order to the observers, who evaluated them blinded to the histopathologic diagnosis and without knowledge of any clinical data of patients and lesions. For each lesion, observers were asked to make the diagnosis of MM vs non MM. In the absence of unanimity, the diagnosis was established when 2 out of the 3 observers agreed.
Statistics
The frequency of each descriptor in MM, nevi and BCC samples was computed. Sensitivity and specificity values of single descriptors and of the MPT/FLIM diagnosis of MM were evaluated as compared with histopathologic diagnosis. Moreover, odds ratios (OD) were calculated for each descriptor. The agreement between ratings made by 3 observers on the diagnosis and specific patterns of MM (inter-rater reliability) was estimated using Cohen kappa statistics with 95% confidence intervals. Finally, mean values and standard deviations of the fluorescence decay in MM, nevus and BCC cells were calculated and differences were assessed by means of the t -test. A p -value
📊 Figures
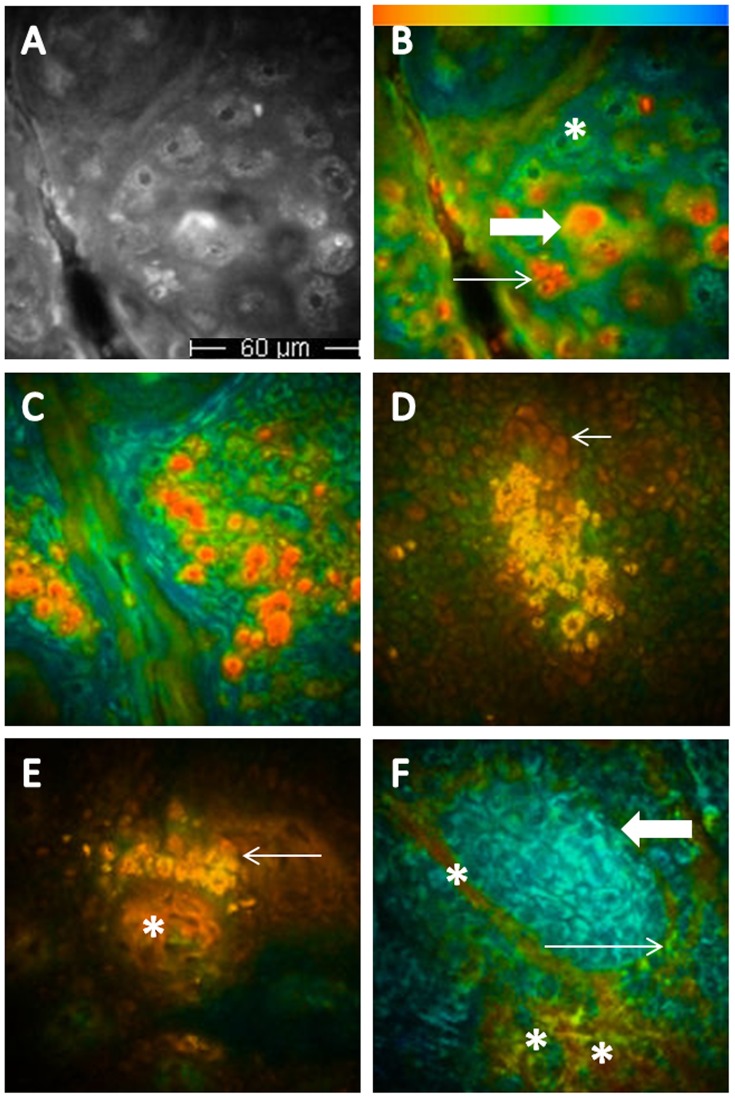
Figure 1
Multiphoton laser tomography and fluorescence lifetime imaging of healthy skin, melanocytic lesions and basal cell carcinoma.
A and B. Images referring to the same epidermal area (healthy skin of a phototype 4 subject); in A, the multiphoton image, in B, the corresponding color coded image, enabling the recognition of green ...
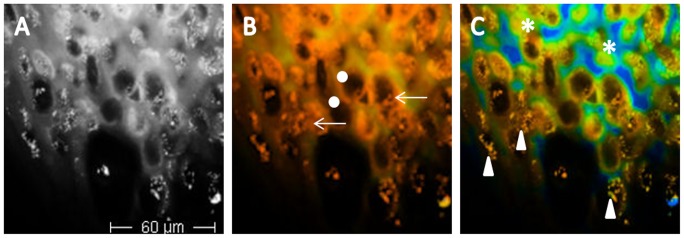
Figure 2
Multiphoton laser tomography and fluorescence lifetime imaging of melanoma.
A, MPT image of upper melanoma layers; B, FLIM image of the same spot displayed by a 0u20132000 ps fluorescence lifetime range showing that all cells are melanocytic; C, 0u2013400 scale, employed to i...
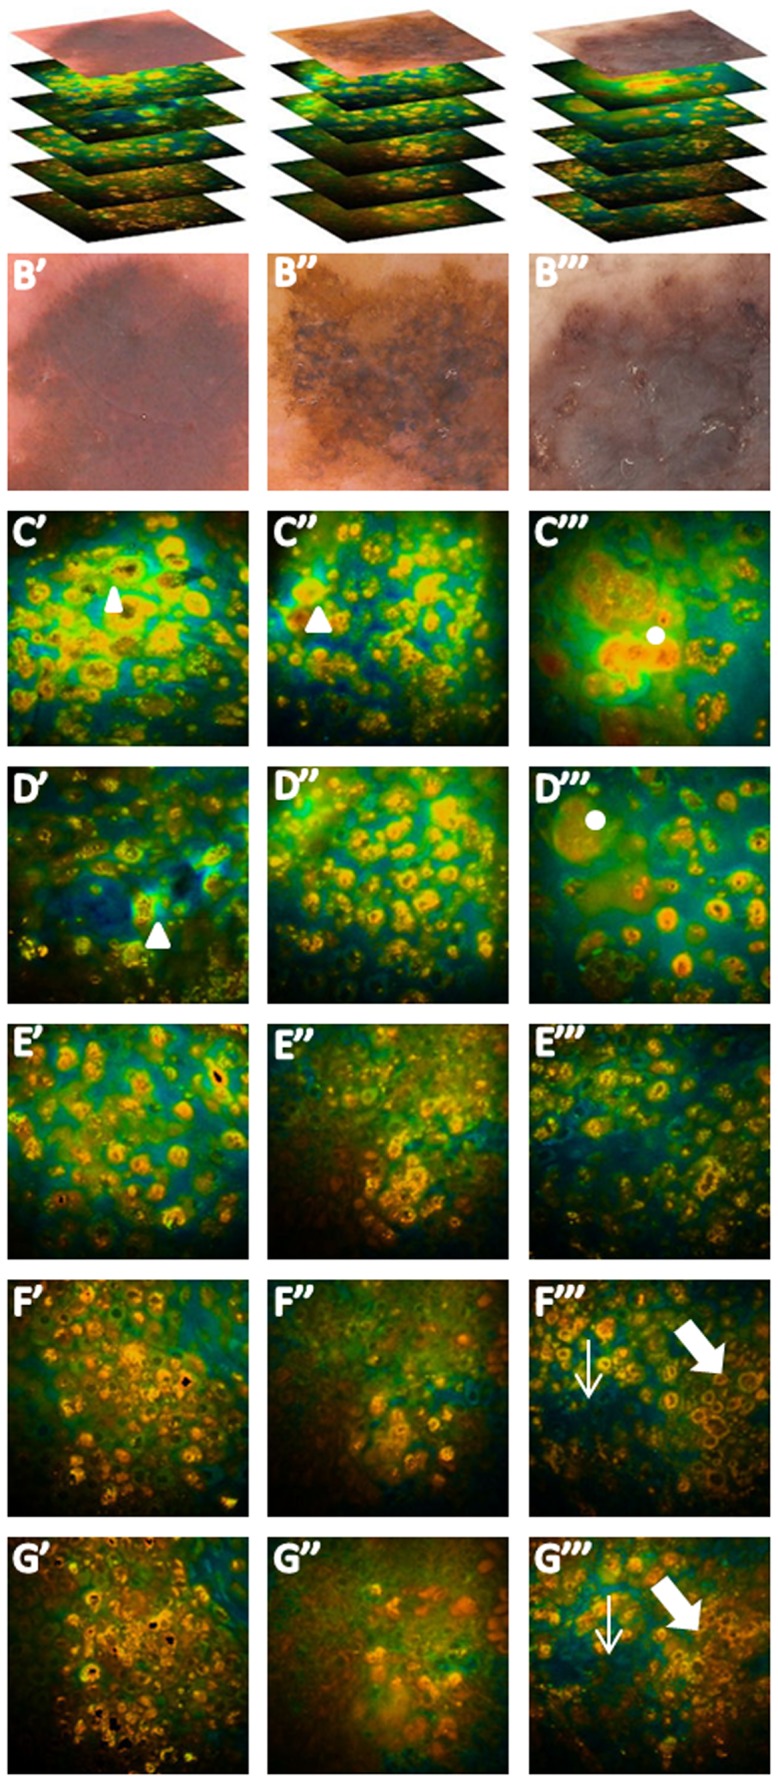
Figure 3
Fluorescence lifetime imaging of melanoma at different depth.
A, dermoscopic images and stacks of 3 melanomas; B, typical dermoscopic features; C, and D, upper melanoma layers, characterized by orange atypical large short-lifetime cells (ASLCs) irregularly distr...
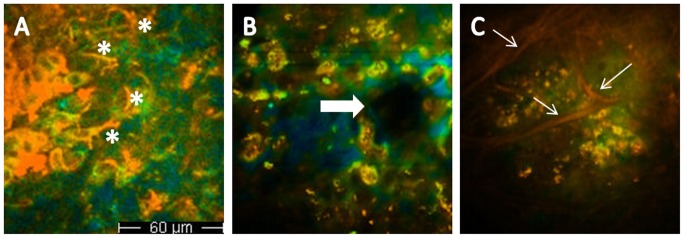
Figure 4
Fluorescence lifetime imaging: different features of melanoma.
A, dendritic cells in upper melanoma layers (asterisks); B, melanoma cells infiltrating a non edged papilla (arrows); C, red collagen fibers surrounding ASLC nests (arrows).
Figure images are served from the NIH/NLM PubMed Central Open Access Subset or Europe PMC; copyright remains with the publishers and authors.
💬 Discussion
0 commentsNo comments yet. Be the first to start a discussion!
Leave a Comment