Abstract
AbstractChromatin undergoes dramatic condensation and decondensation as cells transition between the different phases of the cell cycle. The organization of chromatin in chromosomes is still one of the key challenges in structural biology. Fluorescence lifetime imaging (FLIM), a technique which utilizes a fluorophore’s fluorescence lifetime to probe changes in its environment, was used to investigate variations in chromatin compaction in fixed human chromosomes. Fixed human metaphase and interphase chromosomes were labeled with the DNA minor groove binder, DAPI, followed by measurement and imaging of the fluorescence lifetime using multiphoton excitation. DAPI lifetime variations in metaphase chromosome spreads allowed mapping of the differentially compacted regions of chromatin along the length of the chromosomes. The heteromorphic regions of chromosomes 1, 9, 15, 16 and Y, which consist of highly condensed constitutive heterochromatin, showed statistically significant shorter DAPI lifetime values than the rest of the chromosomes. Differences in the DAPI lifetimes for the heteromorphic regions suggest differences in the structures of these regions. DAPI lifetime variations across interphase nuclei showed variation in chromatin compaction in interphase and the formation of chromosome territories. The successful probing of differences in chromatin compaction suggests that FLIM has enormous potential for application in structural and diagnostic studies.
🔬 Techniques
🔭 Microscopes
💻 Software
✨ Fluorophores
🧪 Sample Preparation
🔬 Cell Lines
🏭 Microscope Brands
🧪 Reagent Suppliers
💻 Software Details
🏛️ Research Organizations (ROR)
Affiliated research institutions:
📋 Methods
DNA Preparation, Cell Culture, and Chromosome Extraction 0.001 mg/mL of calf thymus and micrococcus luteus DNA (Sigma Aldrich, UK) in deionized water were prepared and stained with 4 μM DAPI (Invitrogen, UK). Drops from these solutions were then placed on coverslips for fluorescence lifetime measurements. Chromosomes were prepared from suspension B-lymphocyte cells (GM18507, International HapMap Project, Yoruba male). This cell line was at passage four and prepared according to a previously published protocol 23 . The cells were cultured in a suspension of RPMI-1640 medium (Sigma Aldrich, UK) supplemented with 20% foetal bovine serum (FBS) (Sigma Aldrich, UK) and 1% L-glutamine (Sigma Aldrich, UK) at 37 °C in a 5% CO 2 incubator. For synchronization of the cell cycle, the cells were treated with thymidine (Sigma Aldrich, UK) at a final concentration of 0.3 mg ml −1 for 17 hours. To obtain chromosomes at the mitotic stage, colcemid (Invitrogen, UK) was added to the cells at a final concentration of 0.2 μg ml −1 . The cells were then left for 16 hours before harvesting. This was followed by hypotonic treatment of the cells with 0.075 M potassium chloride for five minutes. Following the hypotonic treatment, the samples were fixed in three changes of 3:1 methanol:acetic acid solution. Chromosomes were also prepared from adherent cervical cancer cells (HeLa) and normal lung fibroblast cells from a healthy female (CCD37LU). The cells were cultured in Dulbecco’s Modified Eagle’s medium (DMEM) (Sigma Aldrich, UK) supplemented with 10% FBS and 1% L-glutamine at 37 °C in a 5% CO 2 incubator. The same procedures above were followed for the synchronization of the cells. After the colcemid treatment, trypsin was added to the cells to detach them from the substrate. The same hypotonic treatment as above was then followed and the resulting samples were fixed in three changes of 3:1 methanol:acetic acid solution. Even though synchronization of cells was performed during the chromosome preparation procedures above, not all chromosomes obtained had reached the metaphase stage. The final chromosome samples fixed in methanol:acetic acid solution still contained some interphase chromosomes. To prepare the chromosome samples for FLIM, the chromosomes were spread on glass slides using the hanging drop method and stained with either 4 μM DAPI or 4 μM Hoechst 33258 for five minutes. The glass slides were washed in a 1x phosphate buffer saline (PBS) solution (Sigma Aldrich, UK) for 5 minutes. The samples were covered with a coverslip, with deionized water as the mounting medium. Chromosome Identification using mFISH In order to identify the chromosomes in the samples measured with FLIM, multiplex fluorescence in-situ hybridization (mFISH) was performed using a 24XCyte mFISH probe kit (MetaSystems, Germany) following the recommended procedure of the manufacturer and according to a previously published protocol 24 . The kit consists of 24 painting probes specific for the 24 different human chromosomes. Each probe is labeled with up to five different fluorophores in a combinatorial labeling format to provide 24 distinct colors. The hybridization of the probe with the DNA sites was visualized by fluorescence microscopy using a Z2 Zeiss fluorescence microscope. mFISH images were then analyzed using the ISIS software from MetaSystems.
Show full methods section
DNA Preparation, Cell Culture, and Chromosome Extraction 0.001 mg/mL of calf thymus and micrococcus luteus DNA (Sigma Aldrich, UK) in deionized water were prepared and stained with 4 μM DAPI (Invitrogen, UK). Drops from these solutions were then placed on coverslips for fluorescence lifetime measurements. Chromosomes were prepared from suspension B-lymphocyte cells (GM18507, International HapMap Project, Yoruba male). This cell line was at passage four and prepared according to a previously published protocol 23 . The cells were cultured in a suspension of RPMI-1640 medium (Sigma Aldrich, UK) supplemented with 20% foetal bovine serum (FBS) (Sigma Aldrich, UK) and 1% L-glutamine (Sigma Aldrich, UK) at 37 °C in a 5% CO 2 incubator. For synchronization of the cell cycle, the cells were treated with thymidine (Sigma Aldrich, UK) at a final concentration of 0.3 mg ml −1 for 17 hours. To obtain chromosomes at the mitotic stage, colcemid (Invitrogen, UK) was added to the cells at a final concentration of 0.2 μg ml −1 . The cells were then left for 16 hours before harvesting. This was followed by hypotonic treatment of the cells with 0.075 M potassium chloride for five minutes. Following the hypotonic treatment, the samples were fixed in three changes of 3:1 methanol:acetic acid solution. Chromosomes were also prepared from adherent cervical cancer cells (HeLa) and normal lung fibroblast cells from a healthy female (CCD37LU). The cells were cultured in Dulbecco’s Modified Eagle’s medium (DMEM) (Sigma Aldrich, UK) supplemented with 10% FBS and 1% L-glutamine at 37 °C in a 5% CO 2 incubator. The same procedures above were followed for the synchronization of the cells. After the colcemid treatment, trypsin was added to the cells to detach them from the substrate. The same hypotonic treatment as above was then followed and the resulting samples were fixed in three changes of 3:1 methanol:acetic acid solution. Even though synchronization of cells was performed during the chromosome preparation procedures above, not all chromosomes obtained had reached the metaphase stage. The final chromosome samples fixed in methanol:acetic acid solution still contained some interphase chromosomes. To prepare the chromosome samples for FLIM, the chromosomes were spread on glass slides using the hanging drop method and stained with either 4 μM DAPI or 4 μM Hoechst 33258 for five minutes. The glass slides were washed in a 1x phosphate buffer saline (PBS) solution (Sigma Aldrich, UK) for 5 minutes. The samples were covered with a coverslip, with deionized water as the mounting medium. Chromosome Identification using mFISH In order to identify the chromosomes in the samples measured with FLIM, multiplex fluorescence in-situ hybridization (mFISH) was performed using a 24XCyte mFISH probe kit (MetaSystems, Germany) following the recommended procedure of the manufacturer and according to a previously published protocol 24 . The kit consists of 24 painting probes specific for the 24 different human chromosomes. Each probe is labeled with up to five different fluorophores in a combinatorial labeling format to provide 24 distinct colors. The hybridization of the probe with the DNA sites was visualized by fluorescence microscopy using a Z2 Zeiss fluorescence microscope. mFISH images were then analyzed using the ISIS software from MetaSystems.
Fluorescence Lifetime Measurements of the DNA and Chromosome Samples
Multiphoton fluorescence lifetime measurements of the chromosome samples were performed at the Central Laser Facility (CLF) located at the Research Complex at Harwell, UK. The custom set up has been previously described 25 . Briefly, a femtosecond Ti-sapphire laser operating at 76 MHz, 200 fs pulse lengths was tuned to a wavelength of 760 nm for two-photon excitation of DAPI and Hoechst 33258 fluorescence. The use of multiphoton excitation here allowed for instrument response function (IRF) of less than 45 ps together with a micro-channel plate (MCP) photomultiplier tube (R3809U, Hamamatsu) as the detector. This was necessary to detect small variations in the lifetime measurements without the need for significant deconvolution of the data from the IRF. The samples were placed on a Nikon TE2000 sample stage attached to a modified Nikon EC2 confocal microscope and were raster-scanned with the laser through a x60 NA 1.2 water immersion objective. The fluorescence from the sample was collected by the same objective but bypassing the confocal optics and detected by a fast MCP-photomultiplier tube detector through a short-pass filter (BG39, Comar, UK). A time-correlated single photon counting (TCSPC) FLIM module (SPCM-830) from Becker & Hickl was used to record the arrival time of the photons at each x, y scan position in a time-tagging, first-in first-out mode. The same set-up was used for the measurement of the DNA samples. However, since the samples were in solution, raster scanning was not performed and a single point collection mode was selected. One DAPI fluorescence decay curve was obtained for every DNA sample measured.
Data Analysis of Lifetime Images
The acquired fluorescence lifetime images (up to 512 × 512 pixels) were analyzed using the SPCImage software (version 4.0.6). Each pixel of the acquired images contains a fluorescence decay function of the DAPI lifetime. The measured decay function ( Eq. 1 ) is a convolution of the true decay function with the IRF. The software uses a model function ( Eq. 2 ), which can be a single or multi-exponential function, to define the fluorescence decay function f(t) and convolutes it with the IRF. The result is compared with the measured decay function. The parameters of the model function are varied until the best fit with the measured decay function is obtained. The lifetime is then extracted from the fitted function thus resulting in an image with a lifetime value per image pixel. where f m (t) is the measured fluorescence decay function, f(t) is the true fluorescence decay function, R is the instrument response function, t s is the time shift between the response function and the fluorescence, a i is the relative amplitude of the exponential component i, τ i is the lifetime of the exponential component i, and a 0 is a constant offset-correction.
📊 Figures
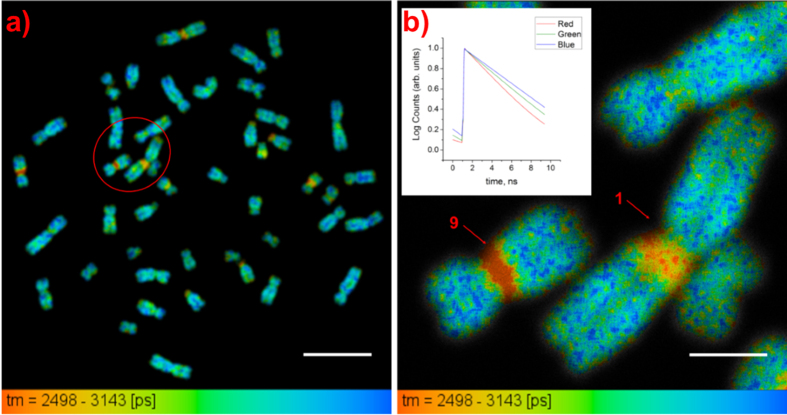
Figure 1
Variations in DAPI lifetime along the length of the chromosomes.
Lifetime images of ( a ) a chromosome spread (scale baru2009=u200910u2009u03bcm) and ( b ) an expanded image of the enclosed region in Fig. 1a taken at a higher pixel resolution showing chromosomes 1 ...
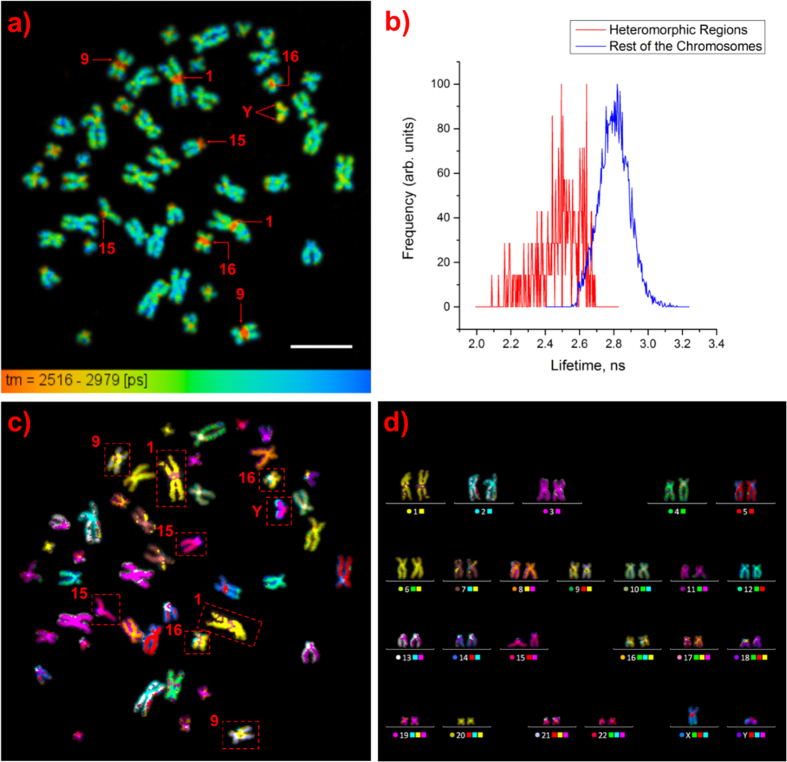
Figure 2
Identification of heteromorphic regions in chromosomes.
( a ) Lifetime image of a chromosome spread with arrows showing the heteromorphic regions (scale baru2009=u200910u2009u03bcm). ( b ) Normalized lifetime distribution curves for the heteromorphic regio...
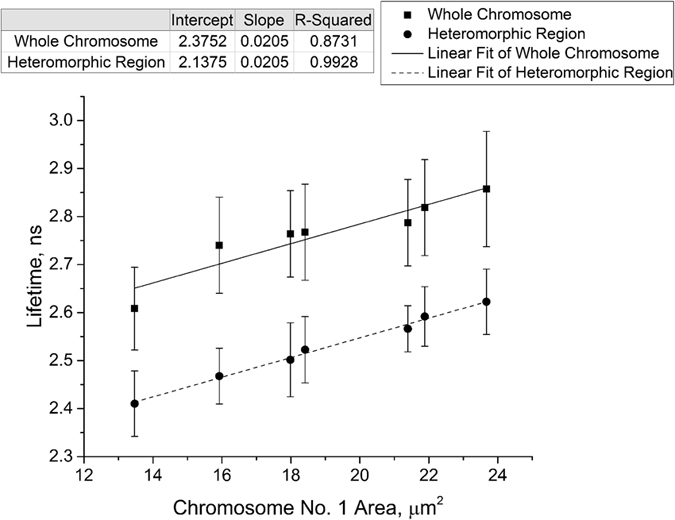
Figure 3
Mean fluorescence lifetime of DAPI for various chromosome 1u2019s and their heteromorphic regions plotted against the area of the chromosomes.
The error bars represent the standard deviation. Thus, DAPI is sensitive to both general chromosome length compactions as well as localized sub-chromosome condensation.
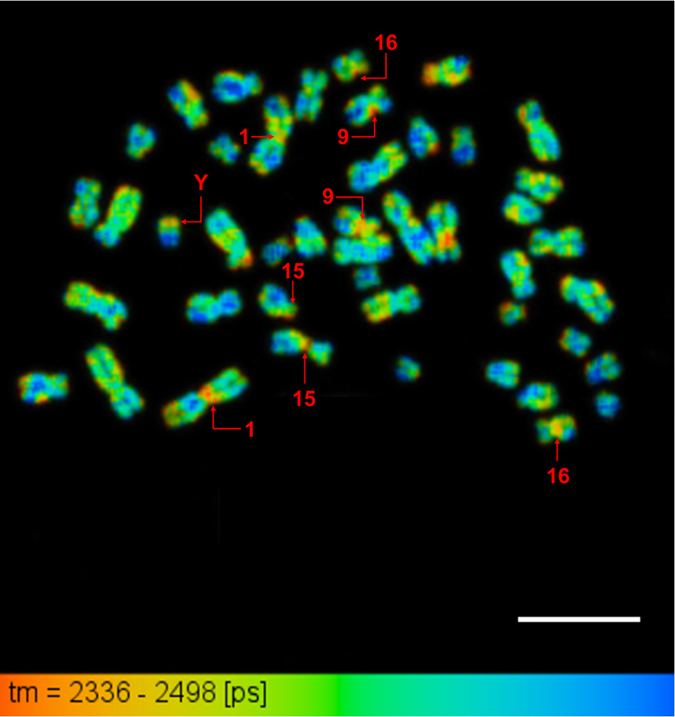
Figure 4
Lifetime image of a chromosome spread stained with Hoechst 33258 with arrows showing the heteromorphic regions (scale baru2009=u200910u2009u03bcm).
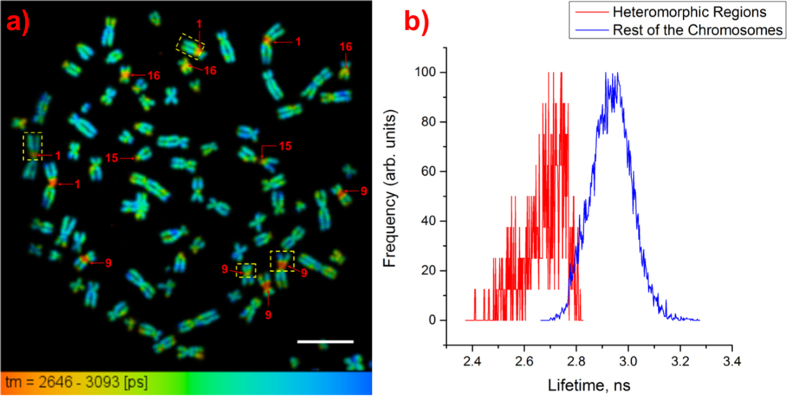
Figure 5
Identification of heteromorphic regions in chromosomes obtained from HeLa cells.
( a ) Lifetime image of a chromosome spread with arrows showing the heteromorphic regions. The chromosomes enclosed in a yellow dashed square are the abnormal chromosomes (scale baru2009=u200910u2009u...
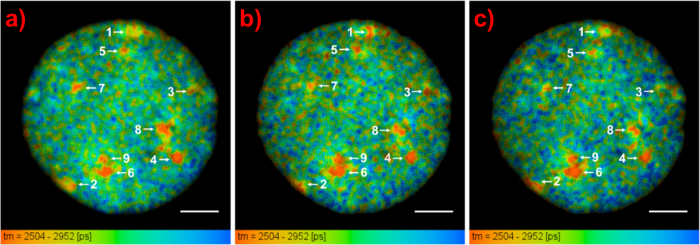
Figure 6
Selected focal planes from the z-stack of the lifetime images of interphase nucleus from GM18507 cells at ( a ) u22120.50u2009u03bcm, ( b ) 0u2009u03bcm, and ( c ) +0.50u2009u03bcm focus (scale barsu2...
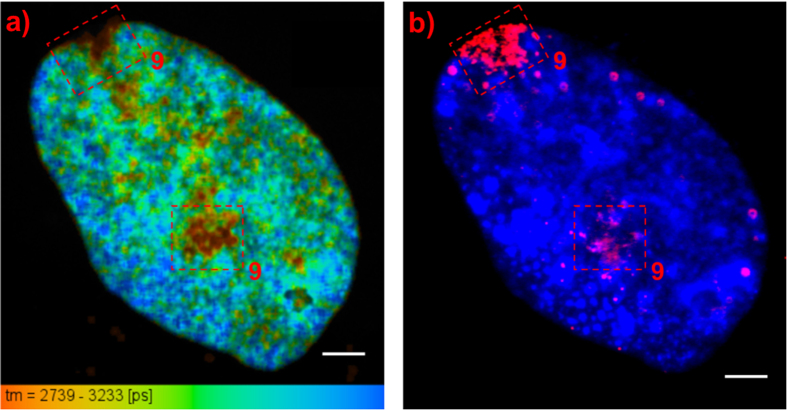
Figure 7
FLIM of interphase nucleus from CCD37LU cells.
( a ) Lifetime image of the nucleus. The short lifetime regions enclosed in a red dashed square were identified as part of chromosome 9 (scale baru2009=u20095u2009u03bcm). ( b ) FISH image of the meas...
Figure images are served from the NIH/NLM PubMed Central Open Access Subset or Europe PMC; copyright remains with the publishers and authors.
💬 Discussion
0 commentsNo comments yet. Be the first to start a discussion!
Leave a Comment