Abstract
The ribosome exit tunnel is an important structure involved in the regulation of translation and other essential functions such as protein folding. By comparing 20 recently obtained cryo-EM and X-ray crystallography structures of the ribosome from all three domains of life, we here characterize the key similarities and differences of the tunnel across species. We first show that a hierarchical clustering of tunnel shapes closely reflects the species phylogeny. Then, by analyzing the ribosomal RNAs and proteins, we explain the observed geometric variations and show direct association between the conservations of the geometry, structure and sequence. We find that the tunnel is more conserved in the upper part close to the polypeptide transferase center, while in the lower part, it is substantially narrower in eukaryotes than in bacteria. Furthermore, we provide evidence for the existence of a second constriction site in eukaryotic exit tunnels. Overall, these results have several evolutionary and functional implications, which explain certain differences between eukaryotes and prokaryotes in their translation mechanisms. In particular, they suggest that major co-translational functions of bacterial tunnels were externalized in eukaryotes, while reducing the tunnel size provided some other advantages, such as facilitating the nascent chain elongation and enabling antibiotic resistance.
🔬 Techniques
🧬 Organisms
💻 Software
✨ Fluorophores
🔬 Cell Lines
💻 Software Details
💾 Data Repositories
🏛️ Research Organizations (ROR)
Affiliated research institutions:
📋 Methods
Ribosome structures Cryo-EM reconstructions and X-ray crystallography structures of ribosomes were downloaded from the protein data bank https://www.rcsb.org/ . References and details are given in Table 1 . The fitting of the model’s residues to the original map was evaluated for each structure using coot ( 25 ) density-fit-score function (2Fo-Fc maps were used for X-Ray data). We checked that modifications of the ribosome structure due to binding or presence of other molecules did not substantially affect the exit tunnel structure and geometry. Table 1. Ribosomes structures used in our study Species/Organelles Resolution Reference PDB codename Chloroplast ( Spinacia ) 3.8 Å (EM) Ahmed et al. (2017) ( 82 ) 5X8T Mitochondria ( H. Sapiens ) 3.1 Å (EM) Amunts et al. (2015) ( 83 ) 3J9M B. subtilis (b) 3.8 Å (EM) Beckert et al. (2017) ( 84 ) 5NJT E. coli (b) 2.9 Å (EM) Fischer et al. (2015) ( 85 ) 5AFI D. radiodurans (b) 3.4 Å (X-ray) Krupkin et al. (2016) ( 86 ) 5JVG L. lactis (b) 5.6 Å (EM) Franken et al. (2017) ( 87 ) 5MYJ M. smegmatis (b) 3.2 Å (EM) Hentschel et al. (2017) ( 88 ) 5O60 M. tuberculosis (b) 3.4 Å (EM) Yang et al. (2017) ( 89 ) 5V7Q S. aureus (b) 3.4 Å (X-ray) Matzov et al. (2017) ( 90 ) 5NRG T. thermophilus (b) 2.5 Å (X-ray) Polinakov et al. (2015) ( 91 ) 4Y4P H. marismortui (a) 2.4 Å (X-ray) Gabdulkhakov et al. (2013) ( 92 ) 4V9F P. furiosus (a) 6.6 Å (EM) Armache et al. (2012) ( 93 ) 4V6U H. sapiens (e) 2.9 Å (EM) Natchiar et al. (2017) ( 94 ) 6EK0 L. donovani (e) 2.9 Å (EM) Zhang et al. (2016) ( 95 ) 5T2A P. falciparum (e) 3.2 Å (EM) Wong et al. (2014) ( 96 ) 3J79 S. cerevisiae (e) 3.9 Å (EM) Schmidt et al. (2016) ( 97 ) 5GAK T. aestivum (e) 5.5 Å (EM) Gogala et al. (2014) ( 98 ) 4V7E T. cruzi (e) 2.5 Å (EM) Liu et al. (2016) ( 99 ) 5T5H T. gondii (e) 3.2 Å (EM) Li et al. (2017) ( 34 ) 5XXB T. vaginalis (e) 3.4 Å (EM) Li et al. (2017) ( 34 ) 5XY3 E. coli (b) 3.9 Å (EM) Arenz et al. (2014) ( 100 ) 3J7Z T. thermophilus (b) 2.8 Å (X-ray) Osterman et al. (2017) ( 101 ) 5VP2 H. sapiens (e) 3.6 Å (EM) Khatter et al. (2015) ( 102 ) 4UG0 First column contains the species, with the domain they belong to (b: bacteria, a: archaea, e: eukarya). The last three structures are replicates for H. sapiens, E. coli and T. thermophilus, used to assess the robustness of our results (see Supplementery Data). Extraction of the ribosome tunnel geometry To extract the tunnel coordinates, we used a tunnel search algorithm developed by Sehnal et al. ( 26 ). The tunnel search was initiated at the PTC. To locate the PTC, we aligned the sequences of 23S and 28S rRNAs and selected the nucleotide aligned with U4452 in human. The tunnel search algorithm was applied after editing the structure to contain atoms located
Show full methods section
Ribosome structures Cryo-EM reconstructions and X-ray crystallography structures of ribosomes were downloaded from the protein data bank https://www.rcsb.org/ . References and details are given in Table 1 . The fitting of the model’s residues to the original map was evaluated for each structure using coot ( 25 ) density-fit-score function (2Fo-Fc maps were used for X-Ray data). We checked that modifications of the ribosome structure due to binding or presence of other molecules did not substantially affect the exit tunnel structure and geometry. Table 1. Ribosomes structures used in our study Species/Organelles Resolution Reference PDB codename Chloroplast ( Spinacia ) 3.8 Å (EM) Ahmed et al. (2017) ( 82 ) 5X8T Mitochondria ( H. Sapiens ) 3.1 Å (EM) Amunts et al. (2015) ( 83 ) 3J9M B. subtilis (b) 3.8 Å (EM) Beckert et al. (2017) ( 84 ) 5NJT E. coli (b) 2.9 Å (EM) Fischer et al. (2015) ( 85 ) 5AFI D. radiodurans (b) 3.4 Å (X-ray) Krupkin et al. (2016) ( 86 ) 5JVG L. lactis (b) 5.6 Å (EM) Franken et al. (2017) ( 87 ) 5MYJ M. smegmatis (b) 3.2 Å (EM) Hentschel et al. (2017) ( 88 ) 5O60 M. tuberculosis (b) 3.4 Å (EM) Yang et al. (2017) ( 89 ) 5V7Q S. aureus (b) 3.4 Å (X-ray) Matzov et al. (2017) ( 90 ) 5NRG T. thermophilus (b) 2.5 Å (X-ray) Polinakov et al. (2015) ( 91 ) 4Y4P H. marismortui (a) 2.4 Å (X-ray) Gabdulkhakov et al. (2013) ( 92 ) 4V9F P. furiosus (a) 6.6 Å (EM) Armache et al. (2012) ( 93 ) 4V6U H. sapiens (e) 2.9 Å (EM) Natchiar et al. (2017) ( 94 ) 6EK0 L. donovani (e) 2.9 Å (EM) Zhang et al. (2016) ( 95 ) 5T2A P. falciparum (e) 3.2 Å (EM) Wong et al. (2014) ( 96 ) 3J79 S. cerevisiae (e) 3.9 Å (EM) Schmidt et al. (2016) ( 97 ) 5GAK T. aestivum (e) 5.5 Å (EM) Gogala et al. (2014) ( 98 ) 4V7E T. cruzi (e) 2.5 Å (EM) Liu et al. (2016) ( 99 ) 5T5H T. gondii (e) 3.2 Å (EM) Li et al. (2017) ( 34 ) 5XXB T. vaginalis (e) 3.4 Å (EM) Li et al. (2017) ( 34 ) 5XY3 E. coli (b) 3.9 Å (EM) Arenz et al. (2014) ( 100 ) 3J7Z T. thermophilus (b) 2.8 Å (X-ray) Osterman et al. (2017) ( 101 ) 5VP2 H. sapiens (e) 3.6 Å (EM) Khatter et al. (2015) ( 102 ) 4UG0 First column contains the species, with the domain they belong to (b: bacteria, a: archaea, e: eukarya). The last three structures are replicates for H. sapiens, E. coli and T. thermophilus, used to assess the robustness of our results (see Supplementery Data). Extraction of the ribosome tunnel geometry To extract the tunnel coordinates, we used a tunnel search algorithm developed by Sehnal et al. ( 26 ). The tunnel search was initiated at the PTC. To locate the PTC, we aligned the sequences of 23S and 28S rRNAs and selected the nucleotide aligned with U4452 in human. The tunnel search algorithm was applied after editing the structure to contain atoms located
📊 Figures
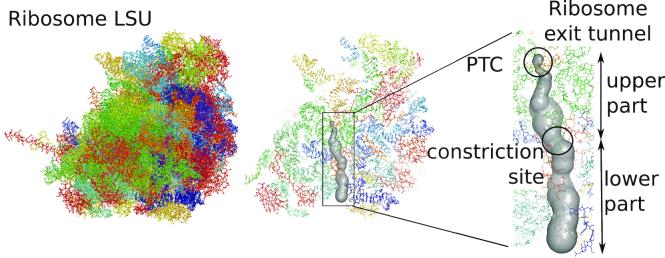
Figure 1.
Extraction of the ribosome exit tunnel coordinates. For a given structure of the ribosome large subunit (LSU) (from Schmidt etu00a0al. ( 97 )), we first locate the PTC and then apply a tunnel search a...
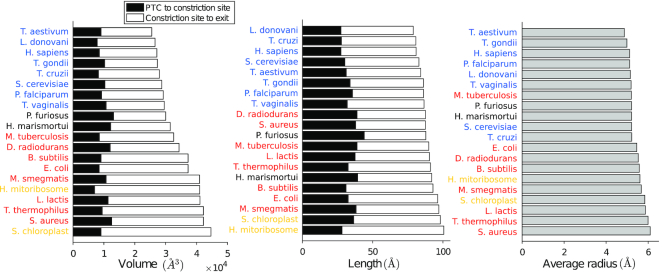
Figure 2.
Volume, length and average radius of the ribosome exit tunnel across different species. Horizontal bar plots represent the ordered volume (left), length (middle) and average radius (right) of the tunn...
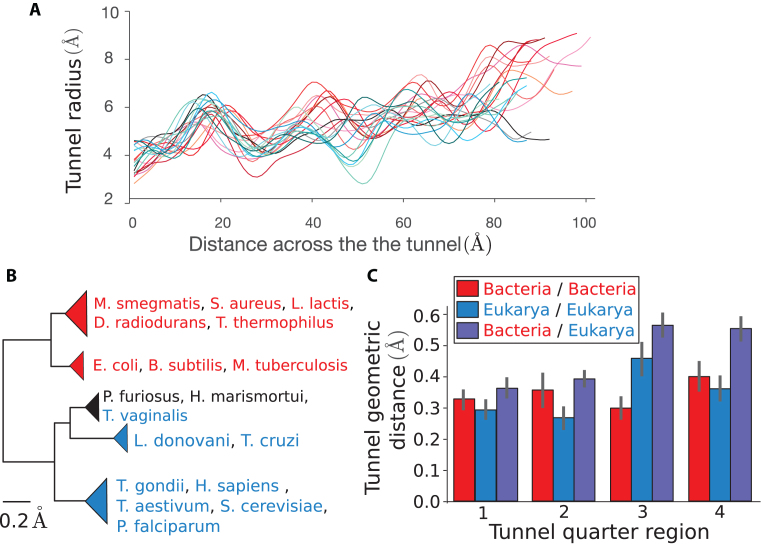
Figure 3.
Clustering of species obtained from pairwise comparison of the tunnel geometry. ( A ) For all our structures, we plot the tunnel radius as a function of the distance across the tunnel. These plots are...
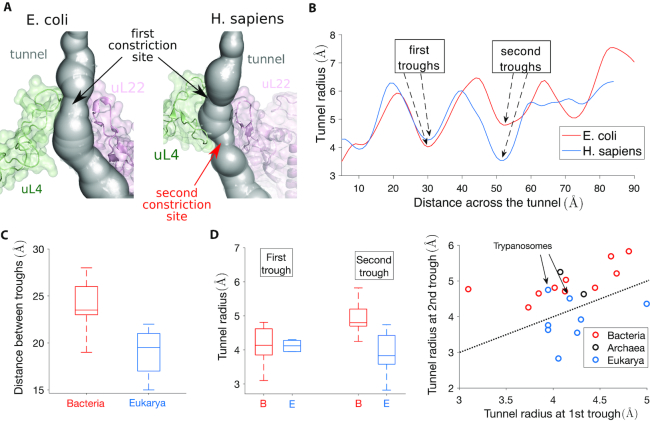
Figure 4.
The presence of a second constriction site in eukarya explains the geometric difference observed between bacterial and eukaryotic tunnels. ( A ) We show the constriction site region in E. coli (left) ...
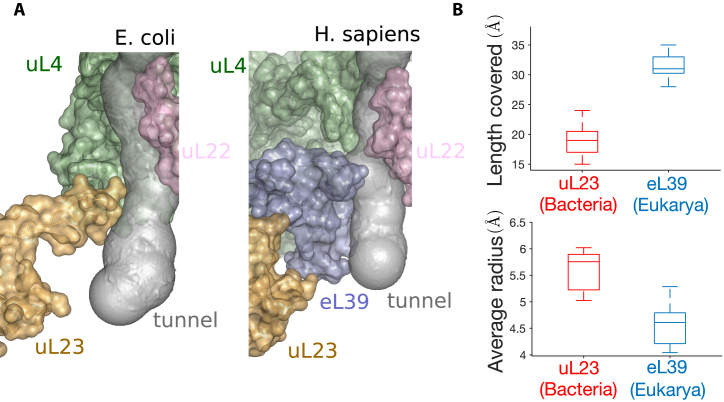
Figure 5.
The replacement of uL23 by eL39 in eukarya affects the tunnel geometry. ( A ) The structures of the lower part of the tunnel in Escherichia coli (left) and Homo sapiens (right) show the replacement of...
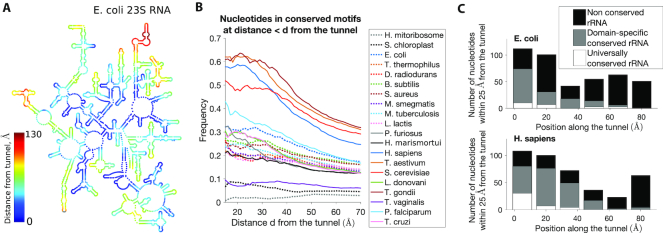
Figure 6.
Association between geometric and sequence conservations of ribosomal rRNA. ( A ) A map of the secondary structure of the 23S rRNA in E. coli , colored by the distance from tunnel (see also Supplement...
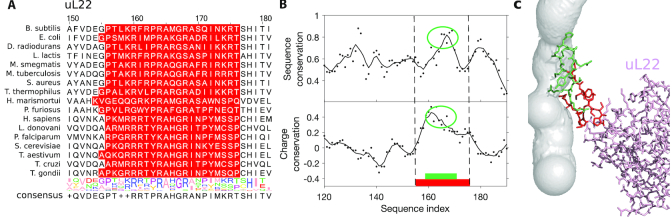
Figure 7.
Conservation of sequence and positive charge of ribosomal protein uL22 at the tunnel. ( A ) We show the multiple sequence alignment of ribosomal protein uL22 close to the tunnel. Highlighted residues ...
Figure images are served from the NIH/NLM PubMed Central Open Access Subset or Europe PMC; copyright remains with the publishers and authors.
💬 Discussion
0 commentsNo comments yet. Be the first to start a discussion!
Leave a Comment