Abstract
Apolipoprotein E (apoE), one of the major protein components of lipoproteins in the peripheral and central nervous systems, regulates cholesterol metabolism through its interaction with members of the low density lipoprotein receptor family. One key to understanding apoE function is determining the structure of lipid-bound forms of apoE. Negative-staining (NS) electron microscopy (EM) is an easy and rapid approach for studying the structure and morphology of lipid-bound forms of apoE. However, an artifact of using the conventional NS protocol is that the apoE phospholipid particles form rouleaux. In this study, we used cryo-electron microscopy (cryo-EM) to examine apoE4 palmitoyl-oleoylphosphatidylcholine (POPC) particles in a frozen-hydrated native state. By comparing the particle sizes and shapes produced by different NS protocols to those produced by cryo-EM, we propose an optimized protocol to examine apoE4 POPC particles. Statistical analysis demonstrated that the particle sizes differ by less than 5% between the optimized protocol and the cryo-EM method, with similar shapes. The high contrast and fine detail of particle images produced using this optimized protocol lend themselves to the structural study of lipid-bound forms of apoE.
🔬 Techniques
🔭 Microscopes
🏭 Microscope Brands
🧪 Reagent Suppliers
📷 Detectors
💻 Software Details
🏛️ Research Organizations (ROR)
Affiliated research institutions:
📋 Methods
Recombinant apoE and apoE4•POPC particle production Sodium cholate in methanol and POPC in chloroform (Avanti Polar Lipids 850457) (wt. ratio 2.5:1) were dried in glass tubes under a stream of nitrogen. A vacuum was applied to remove all traces of the chloroform before reconstitution to 10 mg/ml in Tris-buffered saline (TBS) (10 mM Tris HCl, pH 7.4, 150 mM NaCl, 0.25 mM EDTA, 0.0005% NaN 3 ). ApoE4 in 100 mm ammonium bicarbonate was added to the POPC at a molar ratio of 1:40 (apoE:POPC) as previously described ( 14 ). After incubation at room temperature for 3 h, the particles were extensively dialyzed against cold TBS (6 changes over three days). The density of apoE•POPC was raised to d = 1.21 by adding solid KBr, and the particles were isolated by density gradient ultracentrifugation (d = 1.006–1.21) at 55 K (18 h, 15°C), and followed by fast-protein liquid chromatography (FPLC) isolation. The fractionated particles were dialyzed against TBS, analyzed by native gel electrophoresis (4–20% gradient gels), and the major fraction was taken for analysis ( Fig. 1 ). Fig. 1. Native gel electrophoresis of apoE4•POPC FPLC fractions. The apoE4•POPC particles were isolated by density gradient ultracentrifugation (d = 1.006–1.21). The fractionated particles were dialyzed against TBS and analyzed by native gel electrophoresis (4–20% gradient gels). The native gel was used to assess the relative particle size and size homogeneity. Fraction 10 (F10) was selected for EM analysis because it was the most homogeneous. apoE4•POPC, POPC-bound form of apoE4; EM, electron microscopy; FPLC, fast-protein liquid chromatography; POPC, palmitoyl-oleoylphosphatidylcholine.
Show full methods section
Recombinant apoE and apoE4•POPC particle production Sodium cholate in methanol and POPC in chloroform (Avanti Polar Lipids 850457) (wt. ratio 2.5:1) were dried in glass tubes under a stream of nitrogen. A vacuum was applied to remove all traces of the chloroform before reconstitution to 10 mg/ml in Tris-buffered saline (TBS) (10 mM Tris HCl, pH 7.4, 150 mM NaCl, 0.25 mM EDTA, 0.0005% NaN 3 ). ApoE4 in 100 mm ammonium bicarbonate was added to the POPC at a molar ratio of 1:40 (apoE:POPC) as previously described ( 14 ). After incubation at room temperature for 3 h, the particles were extensively dialyzed against cold TBS (6 changes over three days). The density of apoE•POPC was raised to d = 1.21 by adding solid KBr, and the particles were isolated by density gradient ultracentrifugation (d = 1.006–1.21) at 55 K (18 h, 15°C), and followed by fast-protein liquid chromatography (FPLC) isolation. The fractionated particles were dialyzed against TBS, analyzed by native gel electrophoresis (4–20% gradient gels), and the major fraction was taken for analysis ( Fig. 1 ). Fig. 1. Native gel electrophoresis of apoE4•POPC FPLC fractions. The apoE4•POPC particles were isolated by density gradient ultracentrifugation (d = 1.006–1.21). The fractionated particles were dialyzed against TBS and analyzed by native gel electrophoresis (4–20% gradient gels). The native gel was used to assess the relative particle size and size homogeneity. Fraction 10 (F10) was selected for EM analysis because it was the most homogeneous. apoE4•POPC, POPC-bound form of apoE4; EM, electron microscopy; FPLC, fast-protein liquid chromatography; POPC, palmitoyl-oleoylphosphatidylcholine.
Cryo-EM specimen preparation
ApoE4•POPC particles were diluted to 0.01 mg/ml with 1× Dulbecco's phosphate-buffered saline (Invitrogen, La Jolla, CA, 2.7 mM KCl, 1.46 mM KH 2 PO 4 , 136.9 mM NaCl, and 8.1 mM Na 2 HPO 4 ). Samples (∼4 μl) were incubated for 1 min at room temperature on Quantifoil holey carbon-film-coated 400-mesh copper grids (Quantifoil Micro Tools, Jena, Germany), which were rendered hydrophilic by glow-discharge for 20 s. Specimens were flash-frozen with a Vitrobot rapid-plunging device (FEI, Eindhoven, The Netherlands) at 100% humidity and 4°C and blotted for 2.5 s on filter paper (#595, Schleicher and Schuell, Dassel, Germany) as described ( 29 , 40 ). The frozen, hydrated particles embedded in vitreous ice over the holes in the carbon film were stored in liquid nitrogen until used for cryo-EM observation.
Preparation of NS specimens by conventional protocol
The most popular NS protocol for lipoprotein preparation was reported by Forte et al. ( 41 , 42 ). Using this protocol, lipoprotein solution (0.1 mg/ml) and 2% sodium phosphotungstate (pH 7.4) were mixed at 1:1 ratio by volume before sonification. A droplet (∼4 μl) of the mixture was placed on a glow-discharged carbon-coated grid and allowed to sit for 60 s. Excess solution was removed by touching the grid with filter paper placed onto the backside of the grid.
Preparation of NS specimens by a washing protocol
To reduce the effects of salt, we modified a second protocol ( 43 – 45 ). Aliquots (∼2.5 μl, 0.01 mg/ml) of apoE4•POPC particles were adhered to glow-discharged thin carbon-coated 300-mesh copper grids (Cu-300CN, Pacific Grid-Tech, San Francisco, CA) and incubated for 1 min at room temperature. Excess sample solution was removed by blotting with filter paper touched to the edge of the grid. After removing excess fluid, three droplets of deionized water were adhered to the grid consequently for 1–2 s. Immediately after removal of excess fluid, the grid was stained with 2% (w/v) sodium phosphotungstate (pH 7.4) for 30 s. Preparation of NS specimens by our optimized protocol The optimized protocol was modified from a third protocol ( 28 , 46 ). The apoE4•POPC sample was diluted to 0.01 mg/ml with Dulbecco's PBS (Invitrogen Corporation, Carlsbad, CA). Aliquots (∼3 μl) were adhered to thin pure-carbon-coated 300-mesh copper grids, which had been rendered hydrophilic by glow discharge for 20 s. After incubating for ∼2 min at 4°C, the grids were rapidly washed with three successive drops of deionized water (∼35 µl each) and then exposed to three successive drops of 2% (w/v) uranyl formate (UF) pH 4.6. UF solution was filtered through 0.02 μm inorganic membrane filters (Whatman, Maidstone, UK) before use. After incubation for ∼2 min in a dark chamber on an ice bed, excess solution was removed with filter paper from the backside of the grids, after which the specimens were dried under a heating light (at a distance of ∼20 cm under a lamp with a 60 W tungsten filament light bulb).
EM data collection
ApoE4•POPC particles were examined at –183°C with an FEI Polara Cryo-EM microscope operated at a 300 kV high tension. Micrographs were acquired under the low-dose mode (maximal dose, 30 e/Å 2 ) at a magnification of 77,000 with a Gatan lens-coupled 4k × 4k high-resolution charge-coupled device (UltraCam) and a 10 eV postcolumn energy filter (GIF). Negatively stained specimens were examined with the FEI Tecnai T20 microscope operated at 200 kV. Data were collected at a magnification of 80,000 with the bottom mounted four-quadrant 4k × 4k Gatan UltraScan CCD.
Statistical analysis
For morphometric analysis, individual particle images were selected using the program e2 boxer.py in the EMAN2 software package ( 47 ). Particles were picked automatically and manually checked to remove overlapping or damaged particles using boxer in the EMAN software package ( 48 ). A total of 554 particle images from cryo-EM micrographs, 826 from conventional NS, 97 from NS with washing, and 598 from our optimized NS protocol were used for statistical analysis. The size of each particle was determined by measuring diameters along two orthogonal directions, one of which was the longest dimension of the particle. Histograms of diameter size were generated based on a sampling step of 5 Å. After normalization, the histograms were fitted with ninth-degree polynomial functions in Matlab for data analysis.
Reference free classification and averaging
Isolated particles (∼17,844 particles) were selected and extracted as 160 × 160 pixel images with the program boxer in the EMAN package ( 48 , 49 ). The particle images were normalized after filtering out the X-ray sparkles. A Gaussian boundary circular shaped mask was applied on all images before classification. A total of 1,374 classes were generated and averaged by refine2d.py in the EMAN software suite for four iterations.
Preparation of NS specimens by conventional protocol
The most popular NS protocol for lipoprotein preparation was reported by Forte et al. ( 41 , 42 ). Using this protocol, lipoprotein solution (0.1 mg/ml) and 2% sodium phosphotungstate (pH 7.4) were mixed at 1:1 ratio by volume before sonification. A droplet (∼4 μl) of the mixture was placed on a glow-discharged carbon-coated grid and allowed to sit for 60 s. Excess solution was removed by touching the grid with filter paper placed onto the backside of the grid.
Preparation of NS specimens by a washing protocol
To reduce the effects of salt, we modified a second protocol ( 43 – 45 ). Aliquots (∼2.5 μl, 0.01 mg/ml) of apoE4•POPC particles were adhered to glow-discharged thin carbon-coated 300-mesh copper grids (Cu-300CN, Pacific Grid-Tech, San Francisco, CA) and incubated for 1 min at room temperature. Excess sample solution was removed by blotting with filter paper touched to the edge of the grid. After removing excess fluid, three droplets of deionized water were adhered to the grid consequently for 1–2 s. Immediately after removal of excess fluid, the grid was stained with 2% (w/v) sodium phosphotungstate (pH 7.4) for 30 s.
Preparation of NS specimens by our optimized protocol The optimized protocol was modified from a third protocol ( 28 , 46 ). The apoE4•POPC sample was diluted to 0.01 mg/ml with Dulbecco's PBS (Invitrogen Corporation, Carlsbad, CA). Aliquots (∼3 μl) were adhered to thin pure-carbon-coated 300-mesh copper grids, which had been rendered hydrophilic by glow discharge for 20 s. After incubating for ∼2 min at 4°C, the grids were rapidly washed with three successive drops of deionized water (∼35 µl each) and then exposed to three successive drops of 2% (w/v) uranyl formate (UF) pH 4.6. UF solution was filtered through 0.02 μm inorganic membrane filters (Whatman, Maidstone, UK) before use. After incubation for ∼2 min in a dark chamber on an ice bed, excess solution was removed with filter paper from the backside of the grids, after which the specimens were dried under a heating light (at a distance of ∼20 cm under a lamp with a 60 W tungsten filament light bulb).
An optimized NS protocol for apoE4•POPC To further improve the NS specimen preparation protocol, we continued to modify the above protocol by using various NS reagents. We found that, when using UF instead of PTA, the particles in the micrographs appeared as well-isolated spheres or ellipsoids ( Fig. 6 ). To quantitatively analyze the particle size and shape, we used analytical methods similar to those used above. We first measured two diameters along each particle's longest axis and its perpendicular direction. The statistical distribution of the longest diameter showed the particles of the peak population had a size of 113.2 ± 2.5 Å, which was only 6 Å larger (∼5%) than the measurement from cryo-EM, but significantly different from the 188.2 ± 2.5 Å in conventional NS ( Fig. 3A ). Additionally, the distribution of the geometric mean showed the peak population of particles (∼17.9%) had a size of 97.4 ± 2.5 Å, which was less than 6% larger than that from cryo-EM ( Fig. 3B ). Most importantly, the distribution of the ratio of two diameters demonstrated that the peak population (∼21.4%) of the particles occurred at a ratio of 1.36, which was a less than 5% different from that of cryo-EM, but dramatically different from the 3.8 in conventional NS ( Fig. 3C ). These results suggested that our optimized NS protocol could produce near native images of the apoE4•POPC particles similar to those produced by cryo-EM. Additionally, the contrast of the particle images, which is significantly higher than with cryo-EM, could be used for monitoring the morphology of the lipid-bound forms of apoE by regular EM laboratories and could even be used for reconstruction of the three-dimensional density map. Fig. 6. Electron micrograph of negatively stained apoE4•POPC particles prepared using our optimized protocol. (A) Representative micrographs of apoE4•POPC particles stained by UF by our protocol. The particles show a homogeneous population of compact individual particles with circular or oval shape. Bar = 500 Å. (B) Enlarged views of apoE4•POPC particles selected from the NS micrographs. Box = 200 Å. apoE4•POPC, POPC-bound form of apoE4; NS, negative staining; POPC, palmitoyl-oleoylphosphatidylcholine; UF, uranyl formate.
📊 Figures
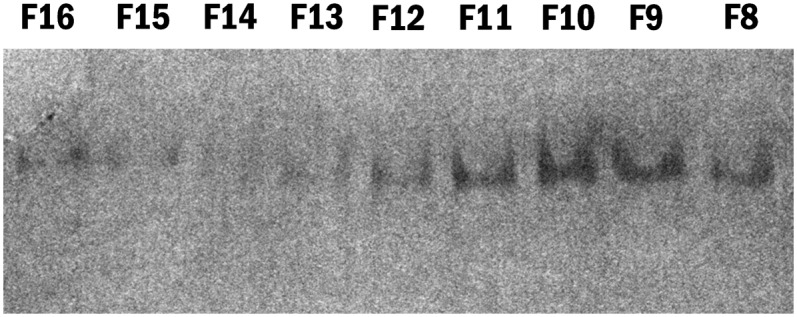
Fig. 1.
Native gel electrophoresis of apoE4u2022POPC FPLC fractions. The apoE4u2022POPC particles were isolated by density gradient ultracentrifugation (d = 1.006u20131.21). The fractionated particles were di...
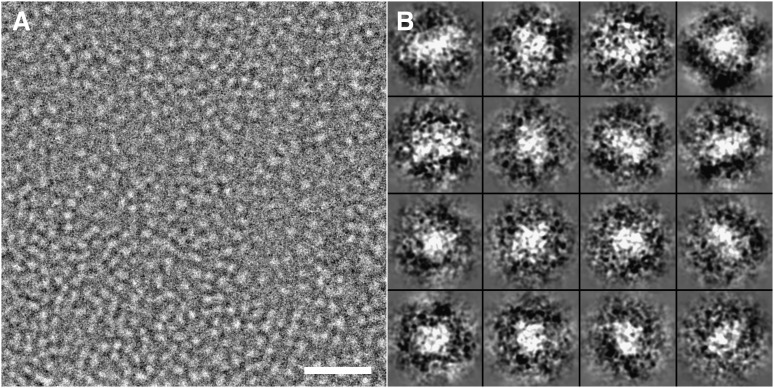
Fig. 2.
Cryo-EM micrograph of apoE4u2022POPC particles. (A) A representative area of apoE4u2022POPC particles suspended in vitrified buffer over a hole in a carbon film. Particles are individual and circular ...
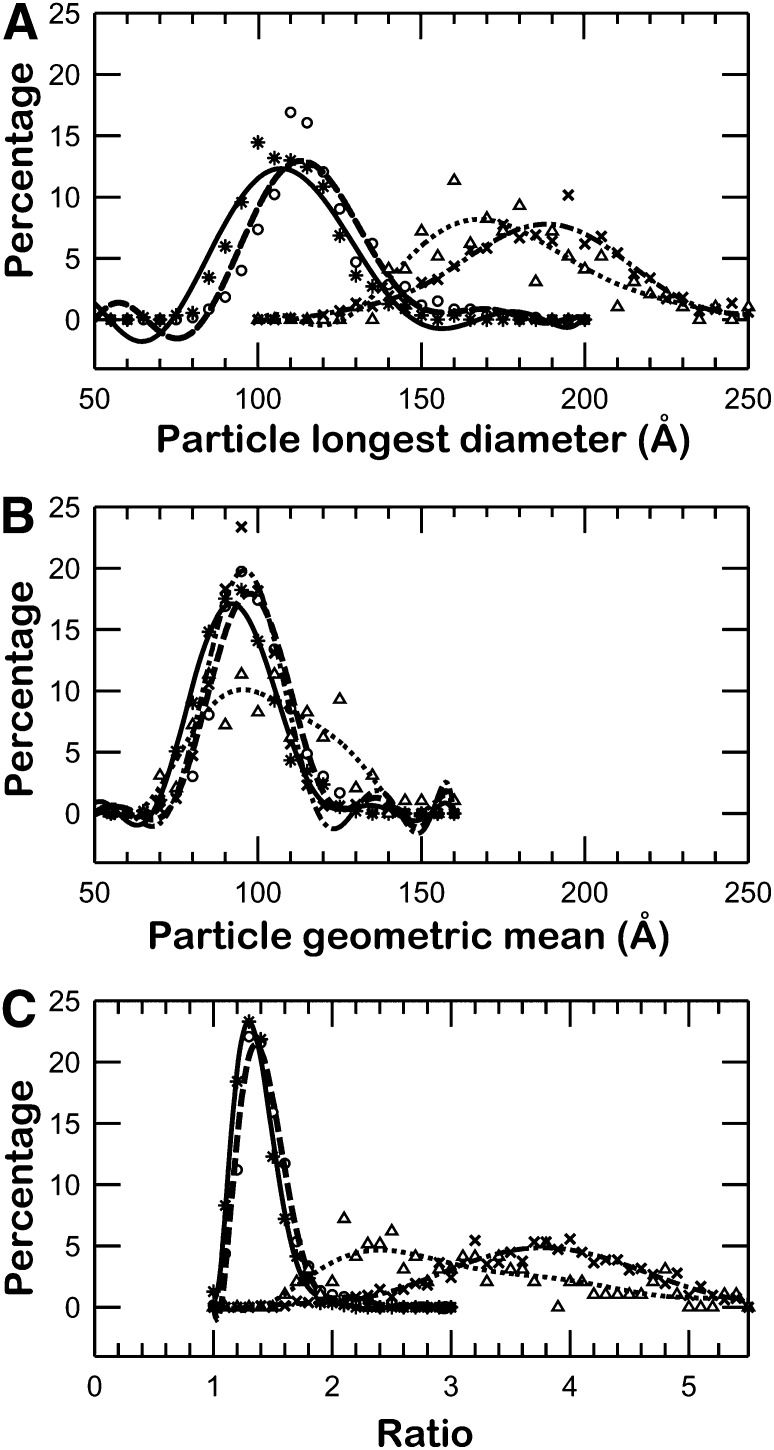
Fig. 3.
Histograms of particle size and shape. (A) Histogram of longest particle diameter. The apoE4u2022POPC particles in each method were selected and measured by their longest diameter. The histograms have...
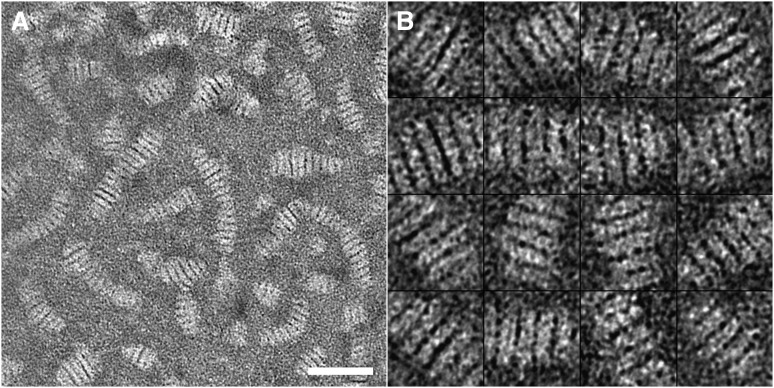
Fig. 4.
Electron micrograph of negatively stained apoE4u2022POPC particles prepared using the conventional protocol. (A) A representative area of apoE4u2022POPC particles stained by PTA. Particles are in the ...
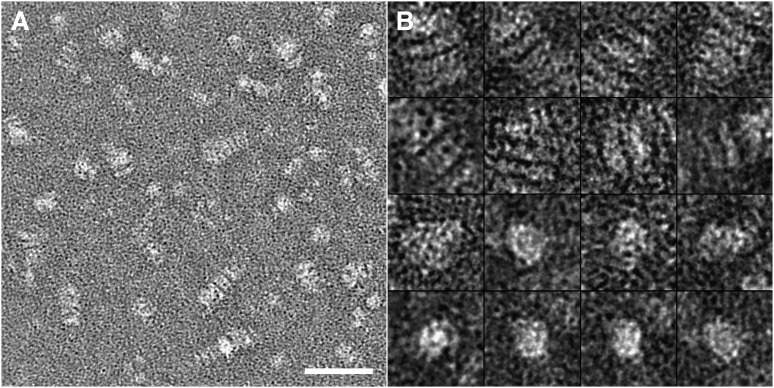
Fig. 5.
Electron micrograph of negatively stained apoE4u2022POPC particles prepared by washing the sample before staining. (A) A representative area of apoE4u2022POPC particles stained with PTA. Particles are...
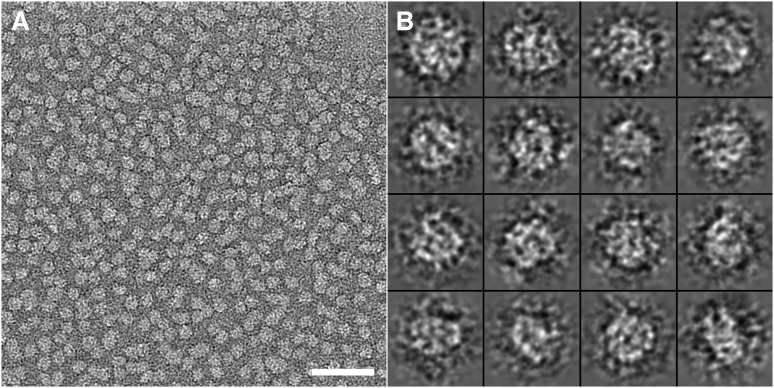
Fig. 6.
Electron micrograph of negatively stained apoE4u2022POPC particles prepared using our optimized protocol. (A) Representative micrographs of apoE4u2022POPC particles stained by UF by our protocol. The ...
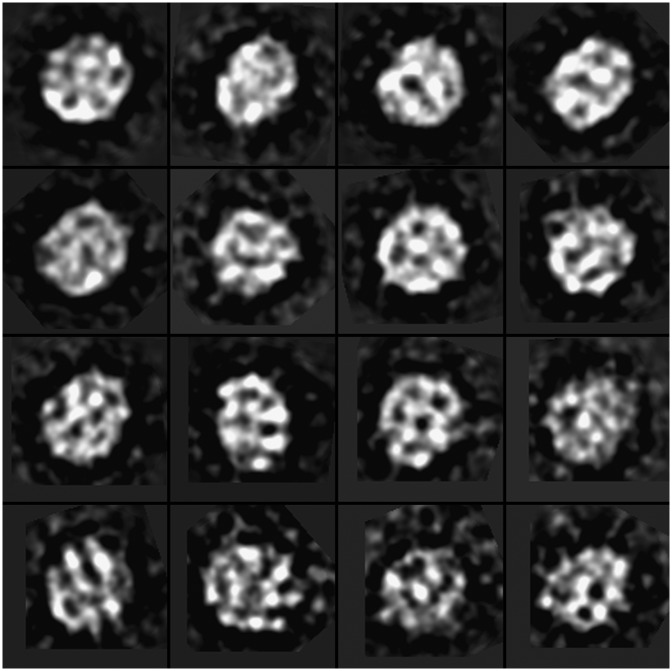
Fig. 7.
Selected class averages of negatively stained apoE4u2022POPC particles. The 17,844 individual particle images were classified and averaged based on a singular value decomposition and multivariate stat...
Figure images are served from the NIH/NLM PubMed Central Open Access Subset or Europe PMC; copyright remains with the publishers and authors.
💬 Discussion
0 commentsNo comments yet. Be the first to start a discussion!
Leave a Comment