Abstract
AbstractMacrophage-expressed gene 1 (MPEG1/Perforin-2) is a perforin-like protein that functions within the phagolysosome to damage engulfed microbes. MPEG1 is thought to form pores in target membranes, however, its mode of action remains unknown. We use cryo-Electron Microscopy (cryo-EM) to determine the 2.4 Å structure of a hexadecameric assembly of MPEG1 that displays the expected features of a soluble prepore complex. We further discover that MPEG1 prepore-like assemblies can be induced to perforate membranes through acidification, such as would occur within maturing phagolysosomes. We next solve the 3.6 Å cryo-EM structure of MPEG1 in complex with liposomes. These data reveal that a multi-vesicular body of 12 kDa (MVB12)-associated β-prism (MABP) domain binds membranes such that the pore-forming machinery of MPEG1 is oriented away from the bound membrane. This unexpected mechanism of membrane interaction suggests that MPEG1 remains bound to the phagolysosome membrane while simultaneously forming pores in engulfed bacterial targets.
🔬 Techniques
🧬 Organisms
💻 Software
✨ Fluorophores
🧪 Sample Preparation
🔬 Cell Lines
🏭 Microscope Brands
🧪 Reagent Suppliers
💻 Software Details
🏛️ Research Organizations (ROR)
Affiliated research institutions:
📋 Methods
Protein purification
The human MPEG1 gene for the soluble ectodomain (NCBI-gene ID: 219972, nucleotide 49–1959) was synthesised (Genescript) with codon usage optimised for insect cell expression. The native signal peptide was replaced with the honeybee melittin signal peptide for protein secretion, and a C-terminal hexahistidine tag was introduced for affinity purification. Unique restriction sites Eco RI and Xho I were also introduced at the 5′- and 3′-ends so that the recombinant gene could be sub-cloned into pFastBac1 expression vector (Life Technologies) for bacmid production.
Baculoviral stocks
(P1 to P3) were generated in Sf9 (Thermo Fisher Scientific, #11496015) or Sf21 insect cells (Thermo Fisher Scientific, #11497013) as described in the supplier’s protocols. For MPEG1 expression, Sf21 cells (2 × 10 6 cells mL −1 ) were infected with the P3 viral stock in Insect-XPRESS protein-free medium (Lonza). The infected insect cells were grown at 27 °C with shaking for 66 h. The insect cell supernatant was harvested by centrifugation at 1000 × g for 10 min. The clarified supernatant was cooled to 4 °C and buffer-exchanged into 20 m m Tris-HCl, pH 8.0, 0.3 m NaCl, 20 m m imidazole by extensive dialysis or by tangential flow filtration (Cogent M1 TFF system, Millipore). The buffer-exchanged supernatant was clarified by filtering through a 0.8 µm membrane before loading onto a Ni-NTA agarose column (Qiagen). The column was washed with buffer containing 40 m m imidazole and the His-tagged MPEG1 eluted with buffer containing 500 m m imidazole. The protein peak fractions were pooled and dialysed against 20 m m Tri-HCl, pH 7.2, 0.3 m NaCl, 10 % (w/v) glycerol at 4 °C overnight. The pooled protein was further purified by size-exclusion chromatography on a Superose 6 10/300 column (GE Healthcare Life Sciences). MPEG1 fractions were monitored using sodium dodecyl sulfate polyacrylamide gel electrophoresis (SDS-PAGE), haemolytic activity assay and negative-stained EM. For further cryo-EM work, MPEG1 fractions were selected and pooled carefully based on negative-stained EM analysis for sample homogeneity. For all other work, fractions were assessed and pooled based on purity on SDS-PAGE and haemolytic activity (Supplementary Fig. 8a ). Pooled fractions were concentrated to 0.5–1.0 mg mL −1 and snap-frozen in liquid nitrogen for storage at − 80 °C. A similar approach was used to produce a L425K mutant form of MPEG1 (Supplementary Table 2 ). The information derived from the MPEG1 L425K proved important for determining the complete structure of wild-type protein and is described in the model building and analysis section.
Show full methods section
Protein purification
The human MPEG1 gene for the soluble ectodomain (NCBI-gene ID: 219972, nucleotide 49–1959) was synthesised (Genescript) with codon usage optimised for insect cell expression. The native signal peptide was replaced with the honeybee melittin signal peptide for protein secretion, and a C-terminal hexahistidine tag was introduced for affinity purification. Unique restriction sites Eco RI and Xho I were also introduced at the 5′- and 3′-ends so that the recombinant gene could be sub-cloned into pFastBac1 expression vector (Life Technologies) for bacmid production.
Baculoviral stocks
(P1 to P3) were generated in Sf9 (Thermo Fisher Scientific, #11496015) or Sf21 insect cells (Thermo Fisher Scientific, #11497013) as described in the supplier’s protocols. For MPEG1 expression, Sf21 cells (2 × 10 6 cells mL −1 ) were infected with the P3 viral stock in Insect-XPRESS protein-free medium (Lonza). The infected insect cells were grown at 27 °C with shaking for 66 h. The insect cell supernatant was harvested by centrifugation at 1000 × g for 10 min. The clarified supernatant was cooled to 4 °C and buffer-exchanged into 20 m m Tris-HCl, pH 8.0, 0.3 m NaCl, 20 m m imidazole by extensive dialysis or by tangential flow filtration (Cogent M1 TFF system, Millipore). The buffer-exchanged supernatant was clarified by filtering through a 0.8 µm membrane before loading onto a Ni-NTA agarose column (Qiagen). The column was washed with buffer containing 40 m m imidazole and the His-tagged MPEG1 eluted with buffer containing 500 m m imidazole. The protein peak fractions were pooled and dialysed against 20 m m Tri-HCl, pH 7.2, 0.3 m NaCl, 10 % (w/v) glycerol at 4 °C overnight. The pooled protein was further purified by size-exclusion chromatography on a Superose 6 10/300 column (GE Healthcare Life Sciences). MPEG1 fractions were monitored using sodium dodecyl sulfate polyacrylamide gel electrophoresis (SDS-PAGE), haemolytic activity assay and negative-stained EM. For further cryo-EM work, MPEG1 fractions were selected and pooled carefully based on negative-stained EM analysis for sample homogeneity. For all other work, fractions were assessed and pooled based on purity on SDS-PAGE and haemolytic activity (Supplementary Fig. 8a ). Pooled fractions were concentrated to 0.5–1.0 mg mL −1 and snap-frozen in liquid nitrogen for storage at − 80 °C. A similar approach was used to produce a L425K mutant form of MPEG1 (Supplementary Table 2 ). The information derived from the MPEG1 L425K proved important for determining the complete structure of wild-type protein and is described in the model building and analysis section.
Lipid-binding screen
The membrane lipid strips were purchased from Echelon Biosciences. The lipid-binding screen was carried out as recommended by the supplier with some modifications. The strips were blocked with 1 % (w/v) skim milk in Tris-buffered saline (TBS) (10 m m Tris-HCl, pH 8.0, 150 m m NaCl) overnight at 4 °C. The blocked strips were incubated with 10 μg mL −1 MPEG1 in TBS-T (TBS and 0.1 % (v/v) Tween 20) at room temperature for 1 h. The strips were washed three times in TBS-T before probing with anti-6 × His tag-horseradish peroxidase-conjugated antibody (Abcam) to detect lipid-protein interactions.
RBC lysis assay
Rabbit blood was obtained from Applied Biological Products Management and collected in the presence of heparin to prevent clotting. To prepare the RBCs for the lysis assays, the blood was first fractionated by centrifugation at 3000 × g at 4 °C for 15 min to pellet the RBC. The cells were resuspended gently and washed three times with equal volume of HEPES buffered saline (HBS). The final RBC pellet was resuspended in preservative Celpresol (CSL) to the original blood volume for storage at 4 °C. Before each lysis assay, the rabbit RBC were pelleted and washed in wash buffer (5 m m HEPES pH 7.0, 75 m m NaCl, 2.5 % (w/v) glucose, 0.15 m m CaCl 2 , 0.5 m m MgCl 2 ) three times to remove the preservative solution, any lysed cells and soluble haemoglobin. MPEG1 membranolytic activity was monitored by reduction of turbidity of RBC suspension at OD 600nm . The washed RBC were diluted 20-fold into reaction buffer (20 m m buffer, 75 m m NaCl, 2.5 % (w/v) glucose) with the respective pH (sodium acetate buffer for pH 4.5–5.5, MES buffer for pH 6.0–6.5 and Tris-HCl for pH 7.0) to give a starting OD 600nm ~1.5–2.0. The haemolytic activity was initiated by adding the diluted RBC to MPEGl. MPEG1 membranolytic activity was calculated by the rate of RBC lysis (ΔOD 600nm h −1 ) per μg of MPEG1 protein. All reactions were carried out in duplicate and blanked against identical assays except without the addition of MPEG1, four independent experiments were performed ( n = 4) (Supplementary Fig. 8b ).
Cryo-EM sample preparation and data collection
For cryo-EM of MPEG1, the protein sample was buffer-exchanged into 20 m m Tris-HCl, pH 7.2, 0.3 m NaCl to remove the glycerol, and concentrated between 2.0 and 2.5 mg mL −1 . The cryo-EM grids were generated using the Vitrobot System (Thermo Fisher Scientific). Initial grid freezing conditions were tested and screened on a Tecnai T12 electron microscope (Thermo Fisher Scientific). In brief, 3 μL of MPEG1 was applied to a glow-discharged QUANTIFOIL Cu R 1.2/1.3 grid, with blotting conditions as follows. The temperature was set to 4 °C with the relative humidity option turned off, the grids were blotted with a blot time of 2.5 s, blot force of −1 and drain time of 1 s. The grids were snap-frozen in liquid ethane and stored under liquid nitrogen until TEM data collection. For cryo-EM of liposome/MPEG1 complex, the protein solution was prepared as described above into (20 m m HEPES pH 7.0, 0.15 m NaCl). Two types of lipid compositions were used; liposomes of POPC and POPS (Avanti Polar Lipids) in equal ratio or liposomes of E. coli total lipid extract (ETL, Avanti Polar Lipids). Both liposomes were made in a similar fashion. To prepare the liposomes, 4 mg of chloroform-solubilised lipid (2 mg of each POPC and POPS or 4 mg of ETL) was dried under argon in a clean test tube, and desiccated under vacuum for at least 4 h. The dried lipid mixture was resuspended in 0.5 mL HBS buffer by vortexing for 1 min, then snap-frozen in liquid nitrogen, and sonicated in a warmed (30 °C) ultrasonic bath for 15 min. This process was repeated three times. The lipid suspension was then extruded using a polycarbonate membrane with pore size of 0.1 μm (Avanti Polar Lipid) to obtain unilamellar liposomes. To generate liposome/MPEG1 complex, 10 μL POPC:POPS liposomes was mixed with 5 μL MPEG1 (1.7 mg mL −1 ) and incubated at 37 °C for three hours. The liposome and MPEG1 mixture was frozen onto a glow-discharged QUANTIFOIL Cu R 2/2 grid as described above with the following modifications. The Vitrobot conditions were set to 22 °C with 100 % humidity, the grids were blotted with a blot time of 2.5 s, blot force of −5 and drain time of 1 s. Data collection parameters have been summarised (Supplementary Table 3 ) for each data set. In brief, dose-fractionated movies were collected on a Titan Krios (Thermo Fisher Scientific), equipped with a Quantum energy filter (Gatan) and Summit K2 (Gatan) or a Falcon II (Thermo Fisher Scientific) direct electron detector. Data acquisition was performed using either SerialEM 37 or EPU (Thermo Fisher Scientific).
Cryo-EM image processing
Upon finalisation of data collection to calibrate pixel size and estimate magnification anisotropy, images of gold diffraction grating (Agar Scientific) were collected at the same magnification as the collection. Analysis performed with mag_distortion_estimate 38 indicated magnification anisotropy was indeed present (Supplementary Table 3 ). Therefore, dose-fractionated movies were corrected for beam induced motion, anisotropy and radiation damage within MotionCor2 39 . Super-resolution movies were additionally down sampled by a factor of 2, applied by Fourier cropping within MotionCor2. All aligned movie frames were subsequently averaged into dose-weighted and non-weighted sums for further processing. Particle coordinates were determined using various software depending on the data set, a combination of Gautomatch (Zhang et al., unpublished; https://www.mrc-lmb.cam.ac.uk/kzhang/Gautomatch/ ), crYOLO (v1.1) 40 and manual picking were employed. A rapid single round of 2D classification in cryoSPARC 41 (v1) was employed to remove contaminants and false positives. Contrast transfer function (CTF) estimation of whole non-dose-weighted micrographs was initially performed with CTFFIND4 (v4.1.10) 42 . On-the-fly processing was performed in RELION (v2.1) 43 to assess data quality. Initial models were all generated ab initio in either cryoSPARC or in EMAN 44 (v2.2) by the common line method for the MPEG1 WT data set (Supplementary Fig. 3 ). Symmetry was determined from 2D and 3D class averages and correct symmetry was confirmed by comparison with C1 reconstructions. Ultimately different symmetries were imposed depending on the reconstruction ranging from full D16, C16 or C1. All further processing was performed in RELION (v1.4, v2.1 and v3.0), unless otherwise stated. Particles belonging to clean classes were then subjected to 3D classification to remove malformed particles and projections with poor signal-to-noise. Clearly abnormal classes were discarded, and 3D refinement was performed on the remainder. Per-particle CTF parameters were refined without further alignments in cisTEM (v1.0b) 45 until convergence, here the refinement resolution was maintained above the fall off of the FSC. Particles with poor scores from cisTEM were discarded. Masked 3D classification with the previously refined angular and CTF parameters without additional alignments was carried out for all data sets to identify homogeneous subpopulations. In the case of the soluble MPEG1 L425K data set, this resulted in two distinct populations. One population exhibited a discrete D16 conformational state, termed the β-conformation (MPEG1 L425K β), and consisted of approximately one-sixth of all the particles (Supplementary Figs. 3 , 9 ). This conformer displayed isotropic resolution and enabled the MABP domain to be resolved. The second population, termed the α-conformation (MPEG1 L425K α), exhibited continuous conformational heterogeneity. This population could be further reduced into a continuous distribution of D16 states. Here conventional refinement failed, resulting in reconstructions that had radially decreasing quality where only the central most region was resolved. Analysis by RELION (v3.0b2) multibody procedure 46 resulted in a marked improvement in resolution. Indeed, principal component analysis highlighted additional degrees of freedom and loose association of each ring (Supplementary Fig. 3 ). Symmetry breaking hence occurred as a result of relative motion between each ring. To overcome symmetry breaking, localised reconstructions were performed on each ring and additionally on individual monomers, thereby reducing the symmetry to C16 and C1, respectively. First, partial signal subtraction of both the top and bottom rings was performed in RELION to obtain two sub-particles per image. These were individually refined in cryoSPARC with dynamic masking. Localised reconstruction resulted in a notable improvement in quality of the reconstruction and corresponding FSC. Resultantly, a similar analysis was performed on the MPEG1 WT data set, also yielding an improvement from 3.5 to 2.9 Å (although the advent of newer software from RELION-1.4 to 3.0 may also explain this improvement). Later sub-particles were merged into a single data set, which refined to the highest resolution in the central region of the complex (MACPF domain) (Supplementary Fig. 10a ). However, owing to intramolecular, conformational heterogeneity between subunits, the quality of the reconstruction in the MABP domain remained poor and hence the electron density was uninterpretable (Supplementary Fig. 10b ). Therefore, sub-particles corresponding to individual monomers were re-extracted along with partial signal subtraction using the localised reconstruction scripts 47 . These sub-particles were aligned to a common axis and sorted by masked 3D classification without further alignments, where a subpopulation with substantially higher homogeneity was identified thereby enabling the full structure to be resolved (Supplementary Fig. 10c, d ). In the case of the liposome/MPEG1 complex, density subtraction of the lipid bilayer was crucial for accurate alignments. A mask of the lipid bilayer was created by segmenting the best reconstruction with Segger (v1.9.5) 48 . Density subtraction of the lipid bilayer was then performed in RELION followed by masked refinement 49 . This was repeated for a total of two subtractions as residual membrane density was observed. The final map was reconstructed from the original particles with the optimised alignments. Per frame B -factor weighting was performed by movie refinement and particle polishing of the final subset of particles after classification and refinement of all reconstructions, except in the case of localised reconstructions where polishing was performed prior to sub-particle extraction. Lastly, polished particles were re-refined. For reconstructions below 3 Å, additional corrections and refinements were performed as follows. Ewald sphere correction, astigmatism and beam tilt refinement were performed in RELION (v3.0b2) 50 . In the case of super-resolution images, the data were resampled to the original pixel size and the final iteration of refinement was continued in RELION. Although these manipulations did not yield improvements for most reconstructions, Ewald sphere effects did appear to affect the MPEG1 L425K α C16 reconstruction, marginally improving the resolution by 0.04 Å. Global resolution was calculated by the gold standard Fourier shell correlation (FSC) at the 0.143 criterion (Supplementary Fig. 11 ). Local resolution was estimated for all reconstructions in RELION using a windowed FSC 0.143 (Supplementary Fig. 12 ). For B -factor sharpening, MonoRes and LocalDeblur were used to re-estimate local resolution and enhance high resolution features by local sharpening respectively 51 . Locally sharpened maps were subsequently filtered by local-resolution with blocfilt 52 or with RELION. Analysis of resolution anisotropy was performed by 3DFSC 53 . Any conversions between software were performed with EMAN (v2.2), code written in-house or by D. Asarnow and J. Rubinstein.
Model building and analysis
Phenix real-space refinement was performed on all models, followed by manual verification of Ramachandran values and fit-to-density within Coot 54 . Analysis of model and map quality was performed by a combination of EMRinger 55 and MolProbity 56 scores. At last, the map-to-model FSC was calculated in Phenix. All figures and visualisation of models, maps and trajectories were performed in UCFS ChimeraX 57 , Pymol 58 or VMD 59 . Model building of the MACPF region was originally performed de novo into the MPEG1 WT reconstruction in Coot; however, the MABP region was poorly resolved and could not be built due to symmetry breaking. Later, the MABP domain was clearly resolved in both the MPEG1 L425K β D16 and MPEG1 L425K α C1 reconstructions (Supplementary Figs. 13 – 16 ). The MPEG1 L425K α and β conformations differ substantially only in the structure of the L-domain. The L-domain of the α conformation is essentially identical to that of wild-type protein (Supplementary Fig. 17 ). In contrast, the structure of the β conformation reveals that the mutation has resulted in a domain swapping event between the double ring assembly, such that the two rings are now tightly linked via a β-sandwich formed via interaction of L-domains from opposing molecules (Supplementary Fig. 9d ). We were unable to find any evidence of the β conformation in preparations of wild-type protein, accordingly, we suggest that this structure is an artefact induced through the L425K mutation. These maps were then used to build the remainder of the MABP domain de novo in Coot. The MPEG1 L425K α C1 model was used as a template to make the final model of MPEG1 WT , this was fitted into the MPEG1 WT reconstruction by rigid body docking followed by Phenix real-space refinement. A model of the lipid bound MPEG1 prepore was obtained by molecular dynamics flexible fitting. Here, the reconstruction of liposome/MPEG1 L425K was used as an energy potential map and a single ring of the MPEG1 L425K α conformer was flexibly guided into the map by namd2/MDFF 60 . As the L-domain becomes disordered upon lipid binding, this region was removed from the model. AFM AFM experiments were carried out on a Multimode 8 system operated in peak-force tapping mode with MSNL-E and PFHR-B cantilevers (Bruker, Santa Barbara, USA). In brief, force–distance curves were recorded at frequencies between 2 and 4 kHz with a maximum tip-sample separation of between 5 and 20 nm. Typically, data were collected at a rate of 0.2–1 frame min −1 . Image analysis was performed on either the open-source SPM analysis software, Gwyddion (v2.53) or the Nanoscope Analysis software (v1.7). Images were plane-levelled, and line-by-line flattened using the lipid membrane as a reference. An additional Gaussian filter was applied with a full-width at half-maximum of two pixels (typical pixel size of 2 nm) to remove high frequency noise. E. coli total lipid extract, 1-palmitoyl-2-oleoyl-glycero-3-phosphocholine (POPC) and 1-palmitoyl-2-oleoyl-sn-glycero-3-phospho- l -serine (POPS) were purchased from Avanti Polar Lipids (Alabaster, USA). Lipids were mixed in chloroform, dried under a stream of nitrogen gas and the resulting film was suspended in buffer (150 m m NaCl, 20 m m HEPES, pH 7.4) to a final concentration of 1 mg ml −1 . Small unilamellar vesicles with a nominal diameter of 50 nm were produced by extrusion of a multilamellar suspension through a polycarbonate membrane. To obtain an extended, supported lipid bilayer film, 6 µL of the small unilamellar vesicle solution was injected onto a freshly cleaved mica surface (⌀ 9.9 mm, Agar Scientific) covered in 80 µL of adsorption buffer (150 m m NaCl, 20 m m HEPES, 25 m m MgCl 2 , pH 7.4), and subsequently incubated for 30 min at room temperature. Prior to injecting protein, the supported lipid bilayer was gently washed 15 times with 80 µL of the adsorption buffer to remove residual lipid vesicles. MPEG1 was injected onto the lipid bilayer to a concentration of 70–350 n m and incubated for 15 min at 37 °C. The resulting membrane bound, mobile MPEG1 assemblies were imaged with AFM. To immobilise membrane bound MPEG1, the assemblies were cross-linked by addition of ~ 0.12 % glutaraldehyde (TAAB Laboratories) and incubated for 10 min at room temperature, before imaging with AFM. At high (350 n m ) concentrations of MPEG1, the MPEG1 assemblies formed a two-dimensional lattice in the membrane, with sufficient lateral stabilisation to facilitate AFM imaging of the assemblies without glutaraldehyde fixation. Reporting summary Further information on research design is available in the Nature Research Reporting Summary linked to this article.
Supplementary information Supplementary Information Reporting Summary Peer Review File Source Data
📊 Figures
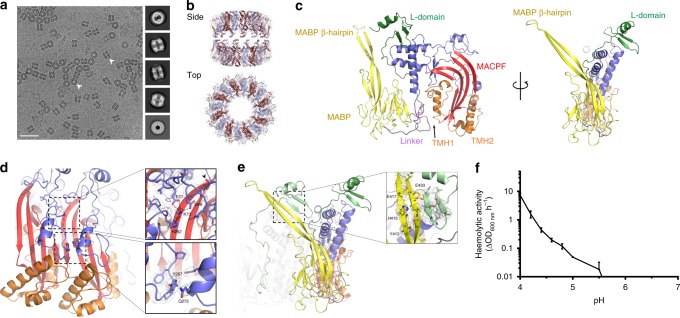
Fig. 1
Cryo-EM of MPEG1 soluble prepores. a Representative image of MPEG1 together with a selection of class averages are shown (scale bar: 50u2009nm). b 2.4u2009u00c5 structure of the MPEG1 assembly; two he...
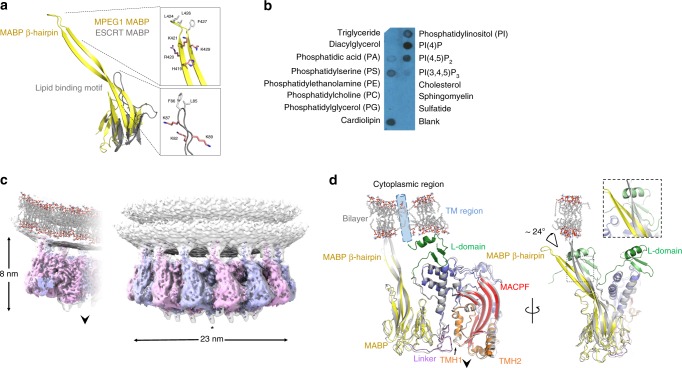
Fig. 2
MPEG1 interacts with negatively charged phospholipids via its MABP u03b2-hairpin. a Structural superposition of the MPEG1 MABP domain (yellow) and the MVB12-associated u03b2-prism (grey). The lipid-bi...
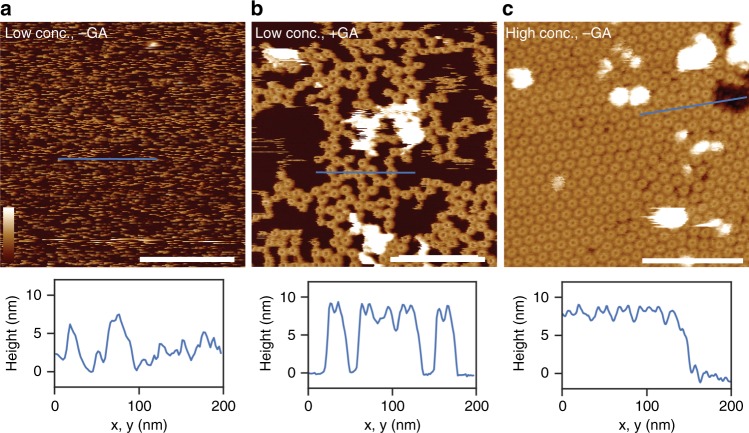
Fig. 3
Atomic force microscopy images of MPEG1 on supported lipid bilayers consisting of E. coli total lipid extract. a Without (-GA) and b with (+u2009GA) glutaraldehyde fixation, at neutral pH. c Increasin...
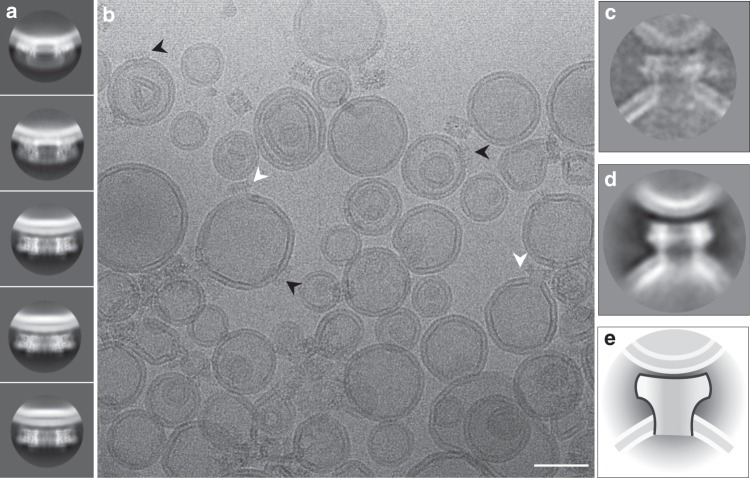
Fig. 4
The MACPF domain of MPEG1 is oriented away from the MABP-bound membrane. a Examples of MPEG1 bound to liposomes reveal b single rings bound in the prepore state (black arrows) and the occasional examp...
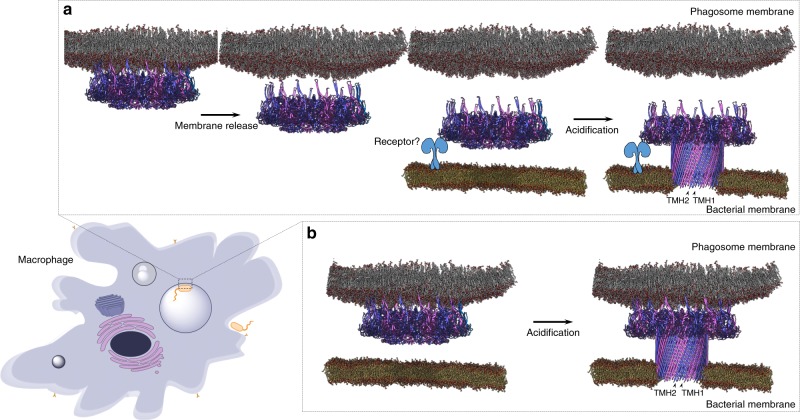
Fig. 5
Schematic illustrating two proposed mechanisms for control of MPEG1 function. a MPEG1 prepores (alternate subunits coloured) are localised to the phagolysosome membrane, either through the transmembra...
Figure images are served from the NIH/NLM PubMed Central Open Access Subset or Europe PMC; copyright remains with the publishers and authors.
💬 Discussion
0 commentsNo comments yet. Be the first to start a discussion!
Leave a Comment