Abstract
Transport of proteins to and from cilia is crucial for normal cell function and survival, and interruption of transport has been implicated in degenerative and neoplastic diseases. It has been hypothesized that the ciliary axoneme and structures adjacent to and including the basal bodies of cilia impose selective barriers to the movement of proteins into and out of the cilium. To examine this hypothesis, using confocal and multiphoton microscopy we determined the mobility of the highly soluble photoactivatable green fluorescent protein (PAGFP) in the connecting cilium (CC) of live Xenopus retinal rod photoreceptors, and in the contiguous subcellular compartments bridged by the CC, the inner segment (IS) and the outer segment (OS). The estimated axial diffusion coefficients are D(CC) = 2.8 +/- 0.3, D(IS) = 5.2 +/- 0.6, and D(OS) = 0.079 +/- 0.009 microm(2) s(-1). The results establish that the CC does not pose a major barrier to protein diffusion within the rod cell. However, the results also reveal that axial diffusion in each of the rod's compartments is substantially retarded relative to aqueous solution: the axial diffusion of PAGFP was retarded approximately 18-, 32- and 1,000-fold in the IS, CC, and OS, respectively, with approximately 20-fold of the reduction in the OS attributable to tortuosity imposed by the lamellar disc membranes. Previous investigation of PAGFP diffusion in passed, spherical Chinese hamster ovary cells yielded D(CHO) = 20 microm(2) s(-1), and estimating cytoplasmic viscosity as D(aq)/D(CHO) = 4.5, the residual 3- to 10-fold reduction in PAGFP diffusion is ascribed to sub-optical resolution structures in the IS, CC, and OS compartments.
🔬 Techniques
🧬 Organisms
✨ Fluorophores
🧪 Sample Preparation
🔬 Cell Lines
🏭 Microscope Brands
🧪 Reagent Suppliers
🔴 Lasers
💻 Software Details
🏛️ Research Organizations (ROR)
Affiliated research institutions:
📋 Methods
Generation of transgenic
Xenopus laevis expressing photoactivatable green fluorescent protein (PAGFP) A plasmid containing the coding sequence of PAGFP ( Patterson and Lippincott-Schwartz, 2002 ) was provided by G.H. Patterson and J. Lippincott-Schwartz (National Institutes of Health [NIH], Bethesda, MD). Transgenic Xenopus laevis were generated using the REMI method ( Kroll and Amaya, 1996 ). In brief, the coding sequence of PAGFP was placed downstream from the Xenopus opsin promoter, which confined expression specifically to the rod photoreceptors ( Mani et al., 2001 ). The plasmid was linearized with XhoI endonuclease and incubated with isolated Xenopus laevis sperm nuclei that were similarly digested. Eggs were fertilized by injection of the sperm nuclei. Transgenic embryos were identified by epifluorescent fundus imaging and allowed to develop into tadpoles and adult frogs.
Tissue preparation
Xenopus tadpoles, stage 42–60, expressing PAGFP in rods were dark-adapted for at least 2 h before experiment. All subsequent procedures were performed under infrared illumination to minimize activation of the light receptor, rhodopsin. Tadpoles were anesthetized by bathing in 0.05% tricaine (Ethyl 3-aminobenzoate methanesulfonate; Sigma-Aldrich) and decapitated. Eyes were removed and retinas were dissected into frog Ringer’s solution (in mM: 120 NaCl, 2 KCl, 10 HEPES, 1.6 MgCl 2 , 10 glucose, 0.03 EDTA, and 1.0 CaCl 2 ). Retinas were oriented ganglion cell side down in a 50-µl bubble of Ringer’s on a polypropylene sheet and sliced into strips ∼50–100-µm wide and 100–200-µm long. Slices were transferred to an imaging chamber that consisted of a 35-mm polystyrene Petri dish, into the center of which a 5-mm diameter hole was drilled and then covered with a No. 1 glass coverslip attached with tackywax, which formed the bottom of the chamber. A moist sponge was placed in the Petri dish and the lid was loosely applied, such that humidity prevented evaporation of the Ringer’s solution while allowing free gas exchange. The chamber was then place onto the stage of the inverted confocal/multiphoton microscope. All procedures and experiments were performed at 21°C within 2 h of retinal dissection. Experiments were conducted in accordance with the NIH Guide for the Care and Use of Laboratory Animals. Multiphoton photoconversion of PAGFP and imaging in live Xenopus rods Imaging and protein flux measurements were performed with a custom-built confocal/multiphoton microscope described previously ( Peet et al., 2004 ; Calvert et al., 2007 ) that was modified by the addition of a custom LabVIEW-based software interface that allows for rapid (up to 12 Hz) image acquisition and protocols that control the laser intensity and positioning for photoconversion of fluorescent molecules (designed and implemented in conjunction with Michael Coleman, Coleman Technologies Inc.). Transgenic expression of proteins under the Xenopus opsin promoter results in heterogeneous protein levels across rods in a given animal’s retina ( Peet et al., 2004 ). Thus, 3-D scans of the retinal slices were performed before experiment to identify rods with sufficient PAGFP expression and that were well oriented with their long axis as close to parallel to the x–y image plane as possible. The initial 3-D scans were performed with visible, confocal scanning using the 488-nm line of an argon-ion laser (model 163C; Newport Corp.) focused to the diffraction limit with a 60×, 1.2 NA, water-immersion objective (Plan Apo VC; Nikon). The 3-D coordinates for the photoconversion pulse were manually selected from these initial scans using the LabVIEW interface. PAGFP was photoconverted at the specified coordinates by multiphoton excitation from the Ti:S laser (Mai Tai HP; Newport Corp.) tuned to 820 nm and focused to the diffraction limit. The use of multiphoton excitation allowed the production of spatially well-defined fields of photoconverted molecules ( Zipfel et al., 2003 ) and minimized the exposure of the tissue to visible light. The laser exposures ranged from 0.1 to 100 ms and 10 to 20 mW (average power). The equilibration of the photoconverted PAGFP was then monitored with serial x–y scans with 488-nm confocal excitation that intersected the photoconversion site. Rapid focus corrections were made before and after the photoconversion pulse to account for the measured focus difference between 820- and 488-nm illumination caused by objective chromatic aberration ( Calvert et al., 2007 ). Raw images were processed using custom MATLAB (The MathWorks) routines to correct for slight field inhomogeneities inherent to the optical system and for nonlinearities in the photon detectors as follows. Full field scans with each laser in the system of solutions of fluorescein were averaged to generate image field–flattening maps. Except where noted, no other image processing was done. The 3-D point spread functions ( psf ) were estimated from spatial fluorescence distribution patterns obtained during 3-D scans of 0.1-µm fluorescent microspheres (Polysciences, Inc.), as described previously ( Calvert et al., 2007 ). The fluorescence profiles in x , y and x , z were approximated by peak normalized Gaussians with σ x,y = 0.16 and σ z 1 = σ z 2 = 0.68 for the focused Ti:sapphire laser tuned to 820 nm (multiphoton excitation, cf. Eq. 6 in Theory section), and σ x,y = 0.16 and σ z = 0.61 for the 488-nm line of the argon ion laser. Online supplemental material Although the approaches used to model the diffusional movement of PAGFP in the rod are presented in the Theory section, additional theoretical details of the methods used to obtain numerical solutions to equations, process and fit the data with theoretical curves generated by the model, as well as video clips of PAGFP diffusing in the IS and OS compartments and equilibrating throughout the rod cytoplasm are available at http://www.jgp.org/cgi/content/full/jgp.200910322/DC1 .
Show full methods section
Generation of transgenic
Xenopus laevis expressing photoactivatable green fluorescent protein (PAGFP) A plasmid containing the coding sequence of PAGFP ( Patterson and Lippincott-Schwartz, 2002 ) was provided by G.H. Patterson and J. Lippincott-Schwartz (National Institutes of Health [NIH], Bethesda, MD). Transgenic Xenopus laevis were generated using the REMI method ( Kroll and Amaya, 1996 ). In brief, the coding sequence of PAGFP was placed downstream from the Xenopus opsin promoter, which confined expression specifically to the rod photoreceptors ( Mani et al., 2001 ). The plasmid was linearized with XhoI endonuclease and incubated with isolated Xenopus laevis sperm nuclei that were similarly digested. Eggs were fertilized by injection of the sperm nuclei. Transgenic embryos were identified by epifluorescent fundus imaging and allowed to develop into tadpoles and adult frogs.
Tissue preparation
Xenopus tadpoles, stage 42–60, expressing PAGFP in rods were dark-adapted for at least 2 h before experiment. All subsequent procedures were performed under infrared illumination to minimize activation of the light receptor, rhodopsin. Tadpoles were anesthetized by bathing in 0.05% tricaine (Ethyl 3-aminobenzoate methanesulfonate; Sigma-Aldrich) and decapitated. Eyes were removed and retinas were dissected into frog Ringer’s solution (in mM: 120 NaCl, 2 KCl, 10 HEPES, 1.6 MgCl 2 , 10 glucose, 0.03 EDTA, and 1.0 CaCl 2 ). Retinas were oriented ganglion cell side down in a 50-µl bubble of Ringer’s on a polypropylene sheet and sliced into strips ∼50–100-µm wide and 100–200-µm long. Slices were transferred to an imaging chamber that consisted of a 35-mm polystyrene Petri dish, into the center of which a 5-mm diameter hole was drilled and then covered with a No. 1 glass coverslip attached with tackywax, which formed the bottom of the chamber. A moist sponge was placed in the Petri dish and the lid was loosely applied, such that humidity prevented evaporation of the Ringer’s solution while allowing free gas exchange. The chamber was then place onto the stage of the inverted confocal/multiphoton microscope. All procedures and experiments were performed at 21°C within 2 h of retinal dissection. Experiments were conducted in accordance with the NIH Guide for the Care and Use of Laboratory Animals. Multiphoton photoconversion of PAGFP and imaging in live Xenopus rods Imaging and protein flux measurements were performed with a custom-built confocal/multiphoton microscope described previously ( Peet et al., 2004 ; Calvert et al., 2007 ) that was modified by the addition of a custom LabVIEW-based software interface that allows for rapid (up to 12 Hz) image acquisition and protocols that control the laser intensity and positioning for photoconversion of fluorescent molecules (designed and implemented in conjunction with Michael Coleman, Coleman Technologies Inc.). Transgenic expression of proteins under the Xenopus opsin promoter results in heterogeneous protein levels across rods in a given animal’s retina ( Peet et al., 2004 ). Thus, 3-D scans of the retinal slices were performed before experiment to identify rods with sufficient PAGFP expression and that were well oriented with their long axis as close to parallel to the x–y image plane as possible. The initial 3-D scans were performed with visible, confocal scanning using the 488-nm line of an argon-ion laser (model 163C; Newport Corp.) focused to the diffraction limit with a 60×, 1.2 NA, water-immersion objective (Plan Apo VC; Nikon). The 3-D coordinates for the photoconversion pulse were manually selected from these initial scans using the LabVIEW interface. PAGFP was photoconverted at the specified coordinates by multiphoton excitation from the Ti:S laser (Mai Tai HP; Newport Corp.) tuned to 820 nm and focused to the diffraction limit. The use of multiphoton excitation allowed the production of spatially well-defined fields of photoconverted molecules ( Zipfel et al., 2003 ) and minimized the exposure of the tissue to visible light. The laser exposures ranged from 0.1 to 100 ms and 10 to 20 mW (average power). The equilibration of the photoconverted PAGFP was then monitored with serial x–y scans with 488-nm confocal excitation that intersected the photoconversion site. Rapid focus corrections were made before and after the photoconversion pulse to account for the measured focus difference between 820- and 488-nm illumination caused by objective chromatic aberration ( Calvert et al., 2007 ). Raw images were processed using custom MATLAB (The MathWorks) routines to correct for slight field inhomogeneities inherent to the optical system and for nonlinearities in the photon detectors as follows. Full field scans with each laser in the system of solutions of fluorescein were averaged to generate image field–flattening maps. Except where noted, no other image processing was done. The 3-D point spread functions ( psf ) were estimated from spatial fluorescence distribution patterns obtained during 3-D scans of 0.1-µm fluorescent microspheres (Polysciences, Inc.), as described previously ( Calvert et al., 2007 ). The fluorescence profiles in x , y and x , z were approximated by peak normalized Gaussians with σ x,y = 0.16 and σ z 1 = σ z 2 = 0.68 for the focused Ti:sapphire laser tuned to 820 nm (multiphoton excitation, cf. Eq. 6 in Theory section), and σ x,y = 0.16 and σ z = 0.61 for the 488-nm line of the argon ion laser. Online supplemental material Although the approaches used to model the diffusional movement of PAGFP in the rod are presented in the Theory section, additional theoretical details of the methods used to obtain numerical solutions to equations, process and fit the data with theoretical curves generated by the model, as well as video clips of PAGFP diffusing in the IS and OS compartments and equilibrating throughout the rod cytoplasm are available at http://www.jgp.org/cgi/content/full/jgp.200910322/DC1 .
Online supplemental material Although the approaches used to model the diffusional movement of PAGFP in the rod are presented in the Theory section, additional theoretical details of the methods used to obtain numerical solutions to equations, process and fit the data with theoretical curves generated by the model, as well as video clips of PAGFP diffusing in the IS and OS compartments and equilibrating throughout the rod cytoplasm are available at http://www.jgp.org/cgi/content/full/jgp.200910322/DC1 .
📊 Figures
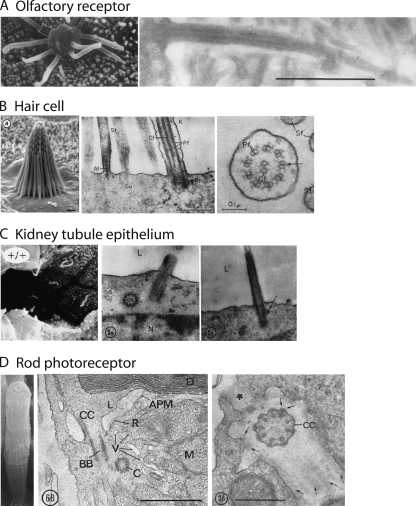
Figure 1.
Ultrastructures of a sampling of primary cilia. (A) Olfactory receptor ciliancontain the molecular machinery of odorant transduction. Defects in ciliaryngenes lead to anosmia ( Kulaga et al.,n2004 ). ...
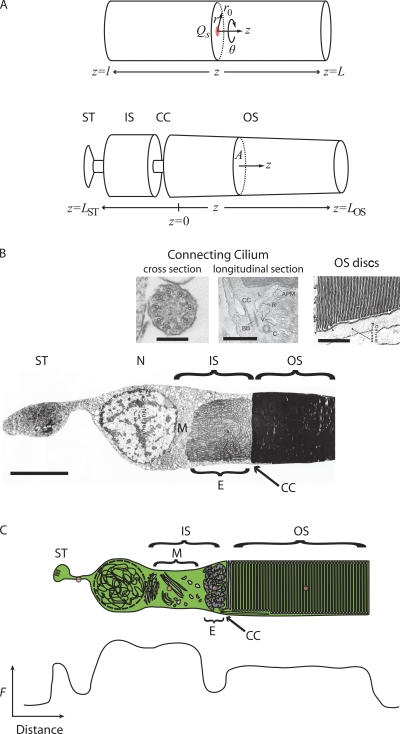
Figure 2.
Coordinate systems and structural features of rod photoreceptorsnimportant for analyzing molecular motion. (A) Coordinate systems. (Top)nThe cylindrical coordinate system used in the 3-D model of diff...
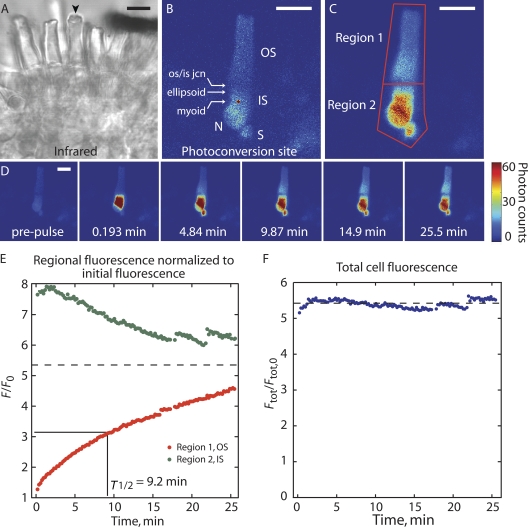
Figure 3.
Equilibration of PAGFP throughout the cytoplasm of a rod afternphotoactivation in the IS. (A) Infrared image of the retinal slicenbefore experiment. The rod in which PAGFP was photoconverted isnindica...
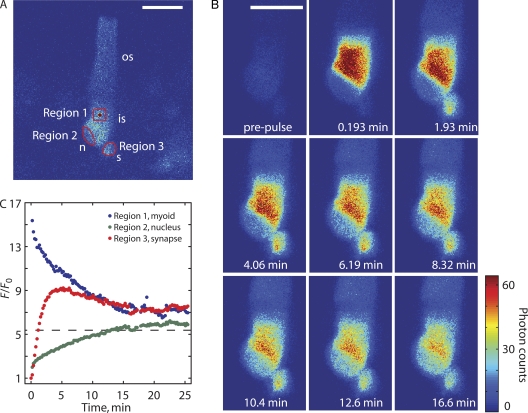
Figure 4.
PAGFP diffusion in IS subcompartments. (A) The cell illustrated in Fig. 3 with fluorescence analayzednin the IS subcompartments indicated by red polygons. The red dot showsnthe site of PAGFP activatio...
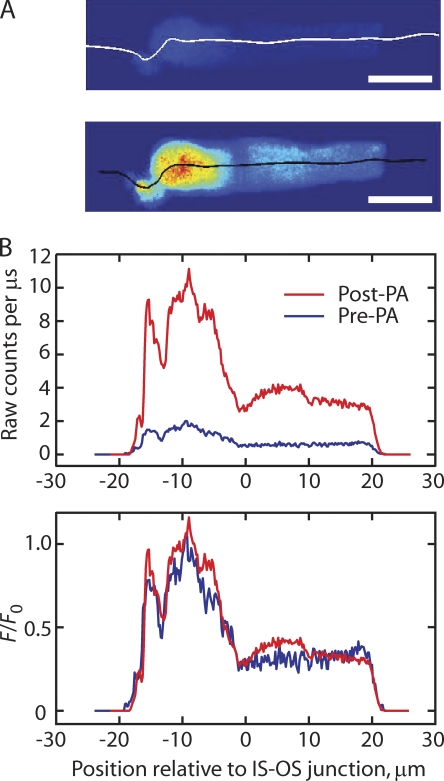
Figure 5.
The prediction of uniform scaling of fluorescence after photoconversionnholds. (A) Images of the cell from Fig.n3 before and 50 min after the photoconversion (PA) exposure.nThe lines in the images ind...
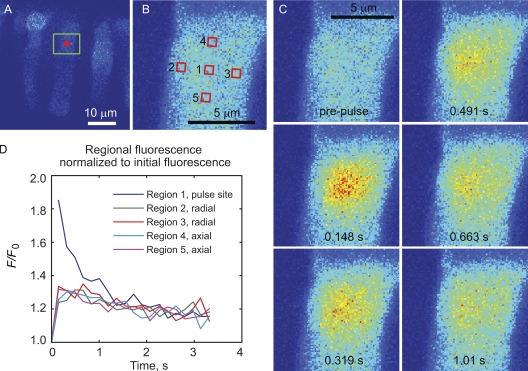
Figure 6.
PAGFP equilibration in the myoid is isotropic and rapid. (A) xu2013y image of the region of retinal slice atnthe central z level of the cell that was the subject ofnthe experiment. The region of the c...
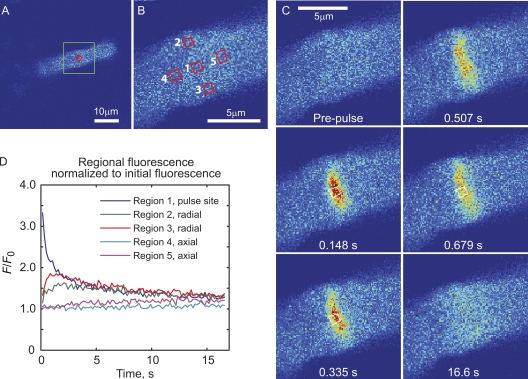
Figure 7.
Equilibration of PAGFP in the OS compartment is highly anisotropic. (A) xu2013y image of the region of retinal slicenshowing the central z level of the cell at which thenexperiment was performed. The ...
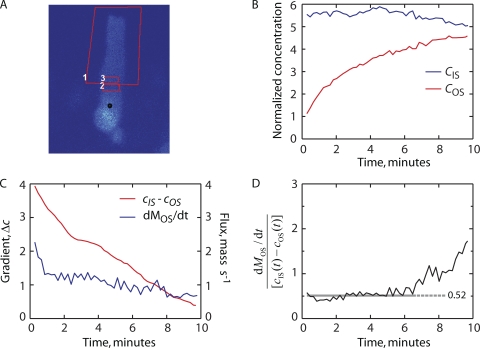
Figure 8.
Flux of PAGFP through the CC. (A) Pre-photoconversion image of a rodnshowing the regions where fluorescence was monitored over time. (B)nRelative concentration of photoactivated PAGFP in the IS (regio...
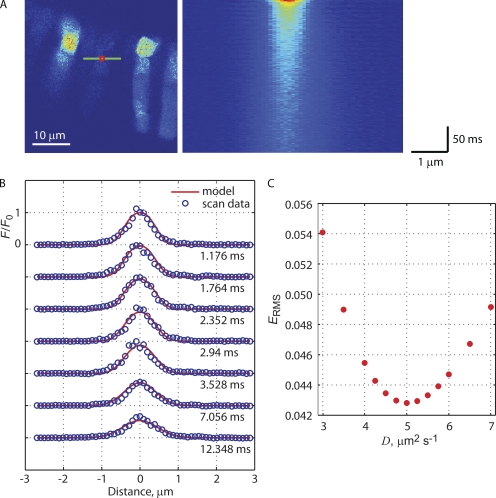
Figure 9.
Estimation of the diffusion coefficient of PAGFP in the myoid. (A; left) xu2013y image of the region of retinal slicenshowing the z level of the cell on which the experimentnwas performed. The region ...
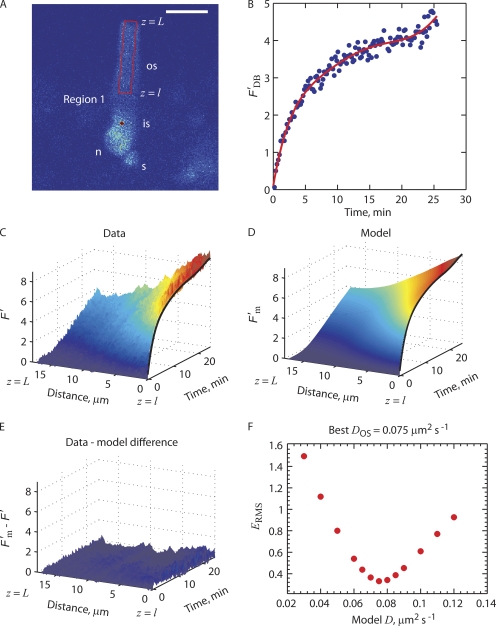
Figure 10.
Estimation of the axial diffusion coefficient of PAGFP in the OSncompartment. (A) The spatiotemporal profile of activated PAGFP fillingnof the OS was obtained from the region bounded by the red box. (...
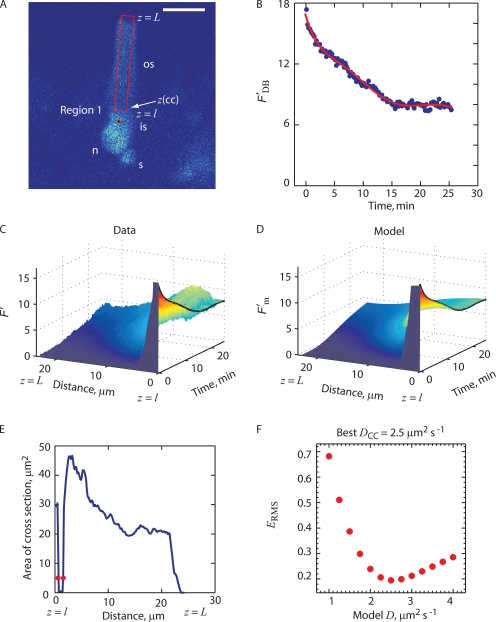
Figure 11.
Estimation of the axial diffusion coefficient of PAGFP within the CCnusing the 1-D model. (A) Region over which the fluorescence was averagednin the radial dimension from each time course image to pro...
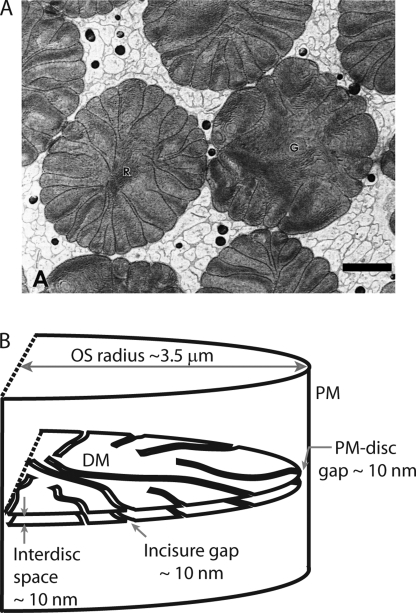
Figure 12.
Morphology of OS discs. (A) Enface transmission electron micrographs ofndiscs in the OSs of the bull frog Rana catesbeiana .nBar, 1.5 u00b5m. Discs in rod photoreceptors have a scallopednmorphology fo...
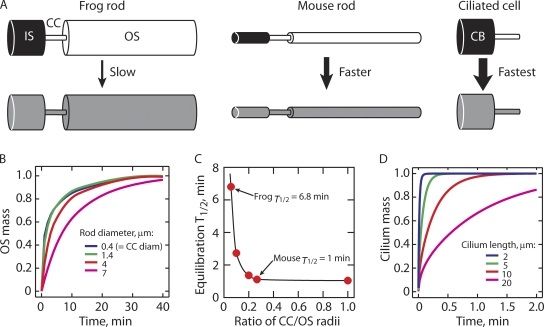
Figure 13.
Impact of changes in areas of cross section on equilibration kinetics:npredictions from the diffusion model. (A) Idealized cells with thengeometry of frog or mouse rods and for an idealized ciliated c...
Figure images are served from the NIH/NLM PubMed Central Open Access Subset or Europe PMC; copyright remains with the publishers and authors.
💬 Discussion
0 commentsNo comments yet. Be the first to start a discussion!
Leave a Comment