Abstract
AbstractThe heterodimeric eukaryotic Drs2p-Cdc50p complex is a lipid flippase that maintains cell membrane asymmetry. The enzyme complex exists in an autoinhibited form in the absence of an activator and is specifically activated by phosphatidylinositol-4-phosphate (PI4P), although the underlying mechanisms have been unclear. Here we report the cryo-EM structures of intact Drs2p-Cdc50p isolated from S. cerevisiae in apo form and in the PI4P-activated form at 2.8 Å and 3.3 Å resolution, respectively. The structures reveal that the Drs2p C-terminus lines a long groove in the cytosolic regulatory region to inhibit the flippase activity. PIP4 binding in a cytosol-proximal membrane region triggers a 90° rotation of a cytosolic helix switch that is located just upstream of the inhibitory C-terminal peptide. The rotation of the helix switch dislodges the C-terminus from the regulatory region, activating the flippase.
🔬 Techniques
🔭 Microscopes
🧬 Organisms
🏭 Microscope Brands
🧪 Reagent Suppliers
📷 Detectors
💻 Software Details
💾 Data Repositories
🏛️ Research Organizations (ROR)
Affiliated research institutions:
📋 Methods
Purification of the endogenous Drs2p-Cdc50p complex The C-terminal triple FLAG-tagged
Drs2 construct was generated using a PCR-based genomic epitope-tagging method on the yeast W303-1a ( MATa leu2-3 , 112 trp1-1 can1-100 ura3-1 ade2-1 his3-11 , obtained from the Michael O’Donnell Lab at Rockefeller University) (Supplementary Table 1 ). About 18 L of cells was cultured and then harvested in lysis buffer containing 20 mM Tris-HCl (pH 7.4), 0.2 M sorbitol, 50 mM potassium acetate, 2 mM EDTA, and 1 mM phenylmethylsulfonyl fluoride (PMSF). Cells were lysed using a French press at 15,000 psi and then were centrifuged at 10,000 × g for 30 min at 4 °C. The supernatant was then centrifuged at 100,000 × g for 60 min at 4 °C to collect the membrane pellet. The membrane was solubilized in buffer A containing 10% glycerol, 20 mM Tris-HCl (pH 7.4), 1.5% n -dodecyl β-D-maltoside (DDM), 0.15% cholesteryl hemisuccinate Tris salt (CHS), 0.5 M NaCl, 1 mM MgCl 2 , 1 mM MnCl 2 , 1 mM EDTA, and 1 mM PMSF. After incubation for 30 min at 4 °C, the mixture was centrifuged for 30 min at 120,000 × g , and the clarified supernatant was loaded into a home-packed anti-FLAG (M2) affinity gel column at 4 °C. The column was then washed three times in buffer B containing 0.025% DDM, 0.0025% CHS, 150 mM NaCl, 20 mM Tris-HCl, pH 7.4, 1 mM MgCl 2 , and 1 mM MnCl 2 . Finally, the Drs2p-Cdc50p complex was eluted with three column volumes of buffer B containing 0.15 mg/mL 3×FLAG peptide, concentrated to 500 μL with a 100-kDa cutoff centricon. The sample was further purified in a Superose 6 10/300 gel filtration column in buffer C containing 0.01% lauryl maltose-neopentyl glycol (LMNG), 0.001% CHS, 150 mM NaCl, 20 mM Tris-HCl, pH 7.4, 1 mM MgCl 2 , and 1 mM MnCl 2 . For the active Drs2p-Cdc50p, the purified sample in Buffer C was incubated with 26 μM PI4P for 15 h at 4 °C. The final sample was assessed by SDS-PAGE gel and the identities of the protein bands were confirmed by tryptic digestion followed by mass spectrometry.
Show full methods section
Purification of the endogenous Drs2p-Cdc50p complex The C-terminal triple FLAG-tagged
Drs2 construct was generated using a PCR-based genomic epitope-tagging method on the yeast W303-1a ( MATa leu2-3 , 112 trp1-1 can1-100 ura3-1 ade2-1 his3-11 , obtained from the Michael O’Donnell Lab at Rockefeller University) (Supplementary Table 1 ). About 18 L of cells was cultured and then harvested in lysis buffer containing 20 mM Tris-HCl (pH 7.4), 0.2 M sorbitol, 50 mM potassium acetate, 2 mM EDTA, and 1 mM phenylmethylsulfonyl fluoride (PMSF). Cells were lysed using a French press at 15,000 psi and then were centrifuged at 10,000 × g for 30 min at 4 °C. The supernatant was then centrifuged at 100,000 × g for 60 min at 4 °C to collect the membrane pellet. The membrane was solubilized in buffer A containing 10% glycerol, 20 mM Tris-HCl (pH 7.4), 1.5% n -dodecyl β-D-maltoside (DDM), 0.15% cholesteryl hemisuccinate Tris salt (CHS), 0.5 M NaCl, 1 mM MgCl 2 , 1 mM MnCl 2 , 1 mM EDTA, and 1 mM PMSF. After incubation for 30 min at 4 °C, the mixture was centrifuged for 30 min at 120,000 × g , and the clarified supernatant was loaded into a home-packed anti-FLAG (M2) affinity gel column at 4 °C. The column was then washed three times in buffer B containing 0.025% DDM, 0.0025% CHS, 150 mM NaCl, 20 mM Tris-HCl, pH 7.4, 1 mM MgCl 2 , and 1 mM MnCl 2 . Finally, the Drs2p-Cdc50p complex was eluted with three column volumes of buffer B containing 0.15 mg/mL 3×FLAG peptide, concentrated to 500 μL with a 100-kDa cutoff centricon. The sample was further purified in a Superose 6 10/300 gel filtration column in buffer C containing 0.01% lauryl maltose-neopentyl glycol (LMNG), 0.001% CHS, 150 mM NaCl, 20 mM Tris-HCl, pH 7.4, 1 mM MgCl 2 , and 1 mM MnCl 2 . For the active Drs2p-Cdc50p, the purified sample in Buffer C was incubated with 26 μM PI4P for 15 h at 4 °C. The final sample was assessed by SDS-PAGE gel and the identities of the protein bands were confirmed by tryptic digestion followed by mass spectrometry.
Cryo-electron microscopy
Aliquots of 3 μL of purified Drs2p-Cdc50p at a concentration of 3 mg/mL were placed on glow-discharged holey carbon grids (Quantifoil Au R2/1, 300 mesh) and were flash-frozen in liquid ethane using an FEI Vitrobot Mark IV. The micrographs were screened in a 200 kV FEI Arctica electron microscope. A small data set of 200 micrographs collected in this microscope on an FEI Falcon III direct detector led to some 120,000 raw particles. After 2D classification, about 70,000 particles were selected for 3D reconstruction, which resulted in a 6.2-Å preliminary 3D map. A full data set was collected during a 4-day session in a 300 kV FEI Titan Krios electron microscope operated at a nominal magnification of ×130,000 and a pixel size of 1.029 Å per pixel with defocus values from −1.0 to −2.0 μm. The dose rate was 2 electrons per Å 2 per second per frame, and 40 frames were recorded in a movie.
Image processing
The movie micrographs collected from the Titan Krios were motion-corrected using the program MotionCorr 2.0 25 . Contrast transfer function parameters of each aligned micrograph were calculated using CTFFIND 4.1 26 . All the remaining steps were performed using RELION 3 27 . For apo form, 2970 raw movie micrographs were collected. Templates for automatic picking were generated from a 2D average of about 1000 manually picked particles. A total of 1,040,625 particles were picked automatically. 2D classification was then performed and particles in the classes with features unrecognizable by visual inspection were removed. A total of 1,001,980 particles was used for further 3D classification, and 635,300 particles were selected for further 3D refinement and postprocessing, resulting in the 2.8-Å 3D density map. The resolution of the map was estimated by the gold-standard Fourier shell correlation at a correlation cutoff value of 0.143. For active form, 4717 raw movie micrographs were collected. A total of 1,126,540 particles were picked automatically. After 2D classification, a total of 897,023 particles was used for 3D classification, and 498,745 particles were selected for further 3D refinement and postprocessing, resulting in the 3.3-Å 3D density map.
Structural modeling and refinement and validation
We first built the apo Drs2p-Cdc50p model into the 2.8-Å 3D density map. The initial model of Drs2p was generated based on PDB ID 5YLV using online SWISSMODEL ( https://swissmodel.expasy.org ). The model was split into four domains: TM, A, N, and P domains, which were then fitted into the EM density independently in Chimera 28 . Initial model of Cdc50p was first automatically built using the model_to_map in the PHENIX program 29 and then was manually built in the program COOT 30 . The complete Drs2p-Cdc50p model was refined by real-space refinement in the PHENIX program and subsequently adjusted manually in COOT. Active Drs2p-Cdc50p model was then built into the 3.3-Å 3D density map basing on the apo model. Notably, the A and N domains of Drs2p were only built by rigid-body fitting because of their low local resolution at 4–6 Å. Finally, the atomic model was validated using MolProbity 31 . To avoid overfitting, the 3D maps of the final map and the two half-maps (Half1 and Half2) were correlated with the refined model to produce three FSC curves: Model vs. final map, FSC work (Model vs. Half1 map), and FSC free (Model vs. Half2 map). Structural figures were prepared in Chimera 28 and PyMOL ( https://pymol.org/2/ ). ATPase assay Purified Drs2p-Cdc50p was first incubated with 26 μM PI4P for 15 h at 4 °C, and then assayed for ATPase hydrolysis activity in buffer containing 20 mM HEPES, pH 7.5, 150 mM NaCl, 0.01% LMNG, 0.001% CHS, 10 mM MgCl 2 at 37 °C for 1 h. The sample without PI4P incubation was used as control. Released phosphate was measured colorimetrically using Malachite Green Phosphate Assay Kit from Sigma.
Complementation assay of drs2 Δ cells
Yeast drs2 Δ strain and the complement plasmid carrying drs2 gene were gifts from Prof. Todd Graham in Vanderbilt University. Drs2 mutants were generated by QuikChange mutagenesis protocol with Pfu DNA polymerase and desired mutation primers (Supplementary Table 1 ). To determine the growth difference between drs2 Δ yeast transformants carrying either wide-type drs2 plasmid or mutations, the strains firstly grew to the same OD in + G418 YPD medium at 30 °C. Then 7 μL of 1:10 serial dilutions of the cells were spotted onto + G418 YPD plates, incubated at 20 or 30 °C for 2 days, and examined for growth. Reporting summary Further information on research design is available in the Nature Research Reporting Summary linked to this article.
Supplementary information Supplementary Information Description of Additional Supplementary Files Supplementary Movie 1 Reporting Summary Source Data
📊 Figures
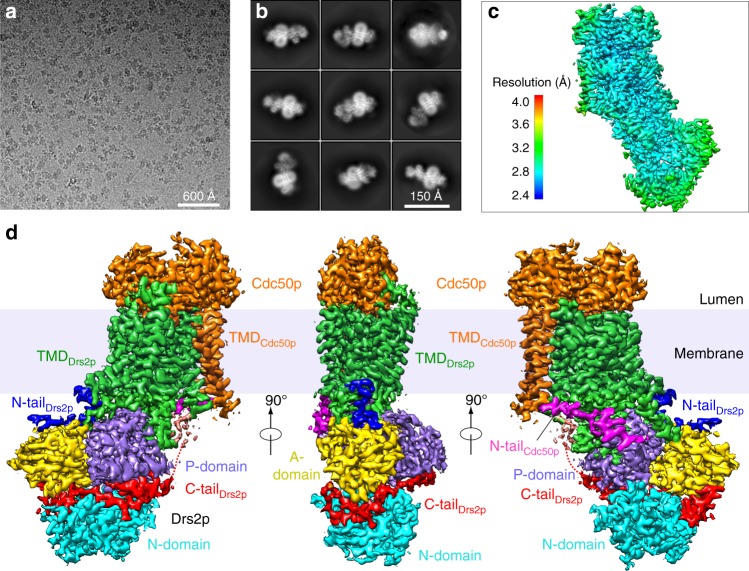
Fig. 1
Cryo-EM of the apo Drs2p-Cdc50p complex. a Representative electron micrograph. b Selected reference-free 2D class averages. c Local resolution map. d Surface rendering of the 3D map colored by protein...
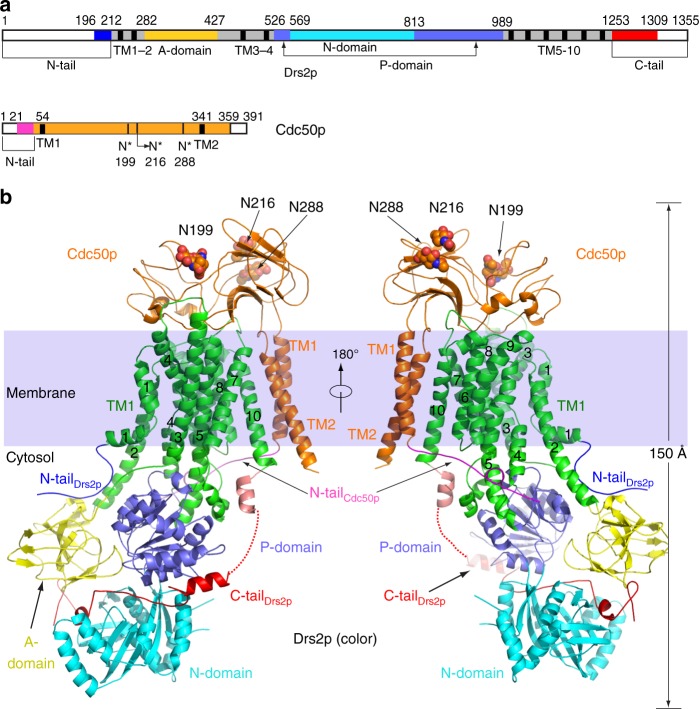
Fig. 2
Molecular architecture of the Saccharomyces cerevisiae Drs2p-Cdc50p complex. a Domain structures of the full-length Drs2p and Cdc50p. Regions not observed are in white. b A frontside and a backside vi...
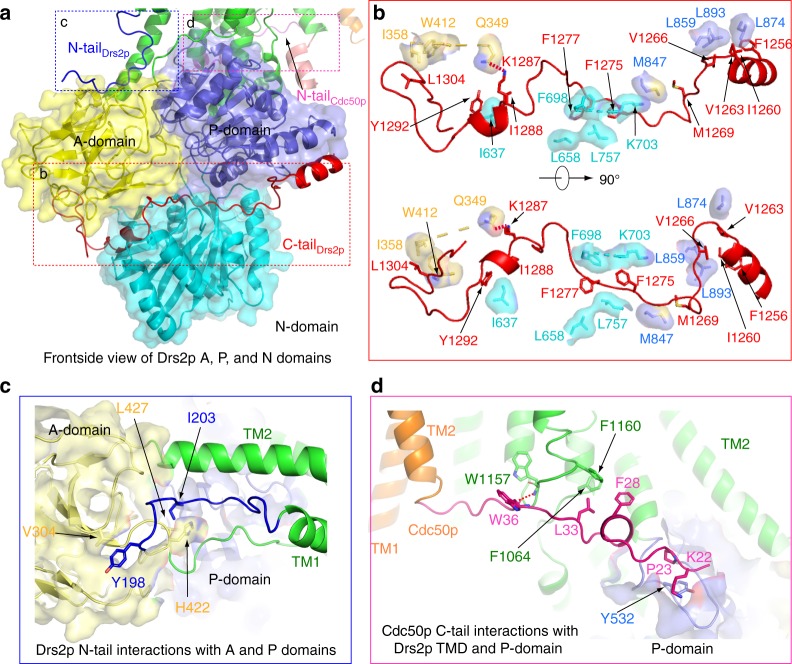
Fig. 3
Regulatory interactions in Drs2p-Cdc50p. a Overview of the A, N, and P domains of Drs2p showing the Drs2p C-tail (red cartoon), N-tail (blue cartoon), and the Cdc50p N-tail (pink cartoon). b Detailed ...
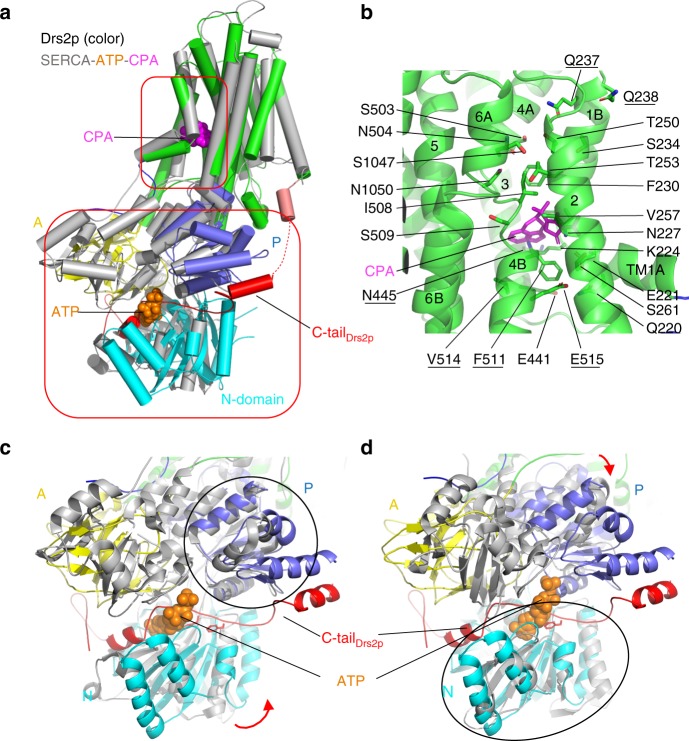
Fig. 4
A putative substrate lipid-binding site and the ATP-binding site in Drs2p. a Structural comparison between Drs2p (color) and the SERCA ATPase (PDB 3FPB; gray) in complex with cyclopiazonic acid (CPA) ...
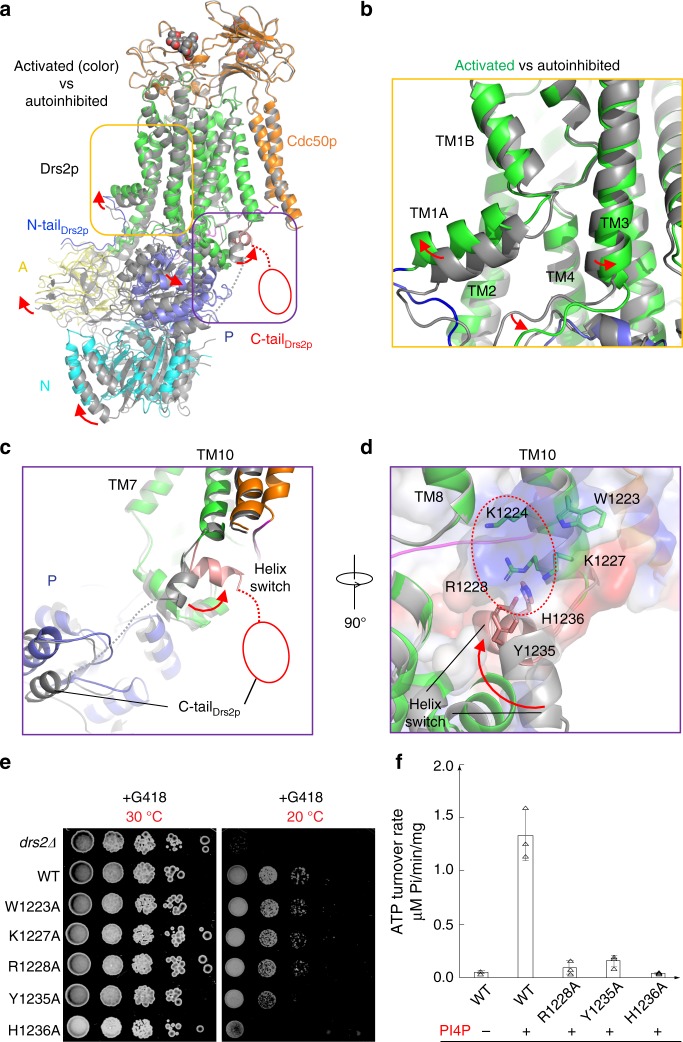
Fig. 5
The activated conformation of Drs2p-Cdc50p. a Structural comparison of Drs2p-Cdc50p in the apo and active conformations. The yellow and purple boxes highlight the substrate-transporting path and the C...
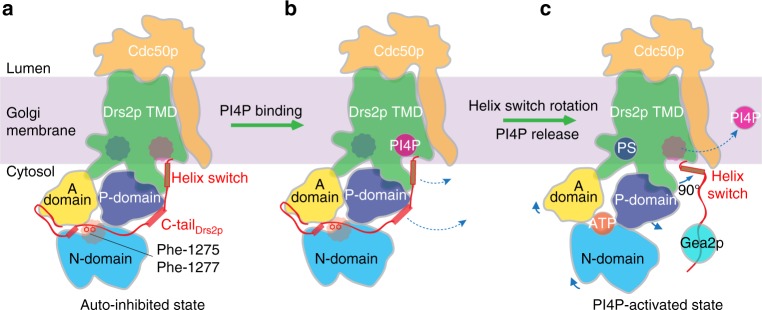
Fig. 6
A model for Drs2p-Cdc50p autoinhibition and activation by PI4P. a In the absence of an activation factor, the Drs2p-Cdc50p flippase exists in the membrane in an autoinhibited state. Autoinhibition is ...
Figure images are served from the NIH/NLM PubMed Central Open Access Subset or Europe PMC; copyright remains with the publishers and authors.
💬 Discussion
0 commentsNo comments yet. Be the first to start a discussion!
Leave a Comment