Abstract
MCherry, the Discosoma sp. mushroom coral-derived monomeric red fluorescent protein (RFP), is a commonly used genetically encoded fluorophore for live cell fluorescence imaging. We have used a combination of protein design and directed evolution to develop mCherry variants with low cytotoxicity to Escherichia coli and altered excitation and emission profiles. These efforts ultimately led to a long Stokes shift (LSS)-mCherry variant (λex = 460 nm and λem = 610 nm) and a red-shifted (RDS)-mCherry variant (λex = 600 nm and λem = 630 nm). These new RFPs provide insight into the influence of the chromophore environment on mCherry's fluorescence properties, and may serve as templates for the future development of fluorescent probes for live cell imaging.
🔬 Techniques
🔭 Microscopes
🧬 Organisms
💻 Software
✨ Fluorophores
🧪 Sample Preparation
🔬 Cell Lines
🏭 Microscope Brands
🧪 Reagent Suppliers
📷 Detectors
🎨 Filters
💻 Software Details
💾 Data Repositories
🏛️ Research Organizations (ROR)
Affiliated research institutions:
📋 Methods
General methods and materials All synthetic DNA oligonucleotides for cloning and library construction were purchased from Integrated DNA Technologies. Taq DNA polymerase (New England Biolabs) was used for EP-PCR. PCR products and products of restriction digests were purified using GeneJET gel extraction kit (Thermo Scientific) according to the manufacturer’s protocols. Restriction enzymes and ligases were purchased from New England Biolabs or Thermo Scientific. The cDNA sequences were confirmed by dye terminator cycle sequencing using the BigDye Terminator v3.1 Cycle Sequencing Kit (Applied Biosystems). Sequencing reactions were analyzed at the University of Alberta Molecular Biology Service Unit. Bacterial growth rate comparison Electrocompetent E . coli was transformed with RFP or EGFP encoding plasmid with the same pBAD/His-B vector. The transformed bacteria were then cultured separately in two tubes of LB medium with 0.1 mg/ml ampicillin overnight. 50 μL of E . coli cultures from each tubes was mixed and cultured in a tube with 4 mL fresh LB medium supplemented with 0.1 mg/ml ampicillin and 0.02% (w/v) L-arabinose for 14 to 16 hours. Inoculation of 50 μL from the mixed culture to fresh medium was repeated every day for 4 days. Each overnight culture was plated on agar plates supplemented with 0.4 mg/ml ampicillin and 0.02% (w/v) L-arabinose. All the plates were imaged using a custom built colony imaging system under green (470/40 nm excitation and 510/20 nm emission) and red (560/40 nm excitation and 630/60 nm emission) channel respectively. Percentages of EGFP and RFP-expressing bacteria were calculated based on the fluorescent colony counts obtained from the images.
Show full methods section
General methods and materials All synthetic DNA oligonucleotides for cloning and library construction were purchased from Integrated DNA Technologies. Taq DNA polymerase (New England Biolabs) was used for EP-PCR. PCR products and products of restriction digests were purified using GeneJET gel extraction kit (Thermo Scientific) according to the manufacturer’s protocols. Restriction enzymes and ligases were purchased from New England Biolabs or Thermo Scientific. The cDNA sequences were confirmed by dye terminator cycle sequencing using the BigDye Terminator v3.1 Cycle Sequencing Kit (Applied Biosystems). Sequencing reactions were analyzed at the University of Alberta Molecular Biology Service Unit. Bacterial growth rate comparison Electrocompetent E . coli was transformed with RFP or EGFP encoding plasmid with the same pBAD/His-B vector. The transformed bacteria were then cultured separately in two tubes of LB medium with 0.1 mg/ml ampicillin overnight. 50 μL of E . coli cultures from each tubes was mixed and cultured in a tube with 4 mL fresh LB medium supplemented with 0.1 mg/ml ampicillin and 0.02% (w/v) L-arabinose for 14 to 16 hours. Inoculation of 50 μL from the mixed culture to fresh medium was repeated every day for 4 days. Each overnight culture was plated on agar plates supplemented with 0.4 mg/ml ampicillin and 0.02% (w/v) L-arabinose. All the plates were imaged using a custom built colony imaging system under green (470/40 nm excitation and 510/20 nm emission) and red (560/40 nm excitation and 630/60 nm emission) channel respectively. Percentages of EGFP and RFP-expressing bacteria were calculated based on the fluorescent colony counts obtained from the images.
Site directed saturation mutagenesis and random mutagenesis
Directed evolution of LSSmCherry1 and RDSmCherry1 was carried out by site directed saturation mutagenesis and EP-PCR using plasmids encoding mCherry2 as template. All site-directed mutagenesis was performed using the Quikchange lightning mutagenesis kit (Agilent) and primers designed according to the manufacturers guidelines with the degenerate codon (NNK) for the intended mutation positions. EP-PCR was performed using unbalanced dNTP concentrations and increased concentration of MgCl 2 (50 mM), and the introduction of MnCl 2 (10 mM) to further decrease the fidelity of Taq DNA polymerase. Products were digested with XhoI and HindIII and ligated into pBAD/His B vector (Life technologies) digested with the same two enzymes, and used to transform the electrocompetent E . coli strain DH10B ElectroMax (Life technologies) using a Micropulser electroporator (Bio-Rad), which were then plated on agar plates containing LB medium supplemented with 0.4 mg/ml ampicillin and 0.02% (w/v) L-arabinose. Plates were incubated for overnight at 37°C prior to screening. Library screening E . coli colonies expressing the mutation libraries were grown on 10 cm Petri dishes. In order to screen libraries for variants that exhibited brighter long Stokes shift red fluorescence, a screening method was developed for long Stokes shift RFPs when expressed in colonies of E . coli . The custom built fluorescent colony imaging system equipped with filter sets (Chroma) for 470/40 nm excitation with 630/60 nm emission (i.e., for long Stokes shift fluorescence) and 560/40 nm excitation with 630/60 nm emission (i.e., for red fluorescence) is used to acquire both long Stokes shift and red fluorescence images of the Petri dish. Colonies exhibiting the highest intensity ratio (long Stokes shift fluorescence intensity / red fluorescence intensity) between these channels were picked and cultured for further spectral confirmation. For far-red RFP screening, colony images were acquired with filter set 622/36 nm excitation and 680/40 nm emission. Colonies exhibiting the highest intensities were picked and cultured for further spectral confirmation. Single colonies were picked, inoculated into 4 ml of LB medium with 0.1 mg/ml ampicillin and 0.02% (w/v) L-arabinose and then cultured overnight. Protein was extracted using B-PER bacterial protein extraction reagent (Thermo Scientific) as per manufacturer guidelines. Screening of the extracted protein was performed with a Safire2 fluorescence plate reader (Tecan) by measuring protein fluorescence. The brightest long Stokes shift variant or most red-shifted variant was selected to be the template for the following round of library creation.
Protein purification and in vitro characterization
To purify the RFPs, electrocompetent E . coli strain DH10B Electromax (Life Technologies) was transformed with the plasmid of interest using Micropulser electroporator (Bio-Rad). Transformed bacteria were cultured overnight on agar plates containing LB and 0.4 mg/ml ampicillin. A single colony was picked and grown overnight in 4 mL LB supplemented with 0.1 mg/ml ampicillin at 37°C. The 4 mL culture was then used to inoculate 250 mL of LB medium with ampicillin and grown to an optical density of 0.6. Protein expression was induced with the addition of 0.02% arabinose and the culture was grown overnight at 37°C. Bacteria were harvested at 10,000 rpm, 4°C for 10 min, lysed using a cell disruptor (Constant Systems) and then clarified at 14,000 rpm for 30 min. Protein was purified from the supernatant by Ni-NTA affinity chromatography (ABT) according to the manufacturer’s instructions. The buffer of the purified protein was exchanged with 10 mM Tris-Cl, 150 mM NaCl, pH 7.3 with Amicon ultracentrifugal filter (MWCO 10,000 Da). Molar extinction coefficients (ε) were measured by the alkali denaturation method. Briefly, the protein was diluted into Tris buffer or 1 M NaOH and the absorbance spectra recorded under both conditions. The value of ε was calculated assuming the denatured RFP chromophore has an ε = 44,000 M -1 cm -1 at 452 nm.
Fluorescence quantum yields
(Φ) were determined using LSSmKate2 or mCherry as standards. Fluorescence intensity as a function of pH was determined by dispensing 2 μL of the protein solution into 50 μL of the desired pH buffer in triplicate into a 396-well clear-bottomed plate (Nunc) and measured in a Safire2 plate reader.
Live cell imaging
To construct Orai1-mCherry, Orai1-mCherry1.5, Orai1-mEGFP, CytERM-mCherry, and CytERM-mCherry1.5, the genes for mCherry, mCherry1.5, and mEGFP were first amplified with a 5’ primer with an AgeI site and a 3’ primer with a NotI site. The purified PCR products were then digested and ligated into a similarly digested pOrai1-YFP or pCytERM-mEGFP. The plasmid encoding Orai-YFP was acquired from Addgene, plasmid number 19756. The plasmid encoding CytERM-mEGFP was gifted from Professor Erik Snapp at Albert Einstein College of Medicine. HeLa cells and HEK cells were maintained in Dulbecco’s Modified Eagle Medium (DMEM) supplemented with 10% fetal bovine serum (FBS, Sigma) and Glutamax (Life Technologies) and incubated at 37°C with 5% CO 2 . Transient transfections were performed using Turbofect (Thermo Scientific) according to the manufacturer’s guidelines. Transfected cells were imaged using either an Axiovert 200M (Zeiss) or a Nikon Eclipse Ti. The Axiovert 200M (Zeiss) was equipped with a 75 W xenon-arc lamp, a 40× objective lens (NA = 1.3, oil), a 14-bit CoolSnap HQ2 cooled CCD camera (Photometrics), and driven by open source Micro-Manager software. The Nikon Eclipse Ti microscope was equipped with a 150 W Lumen 200 metal halide lamp (Prior Scientific), a 16-bit 512SC QuantEM CCD (Photometrics), a 25% neutral density filter, a 40× objective (NA = 0.95, air), and driven by a NIS-Elements AR 3.0 software package (Nikon).
General methods and materials All synthetic DNA oligonucleotides for cloning and library construction were purchased from Integrated DNA Technologies. Taq DNA polymerase (New England Biolabs) was used for EP-PCR. PCR products and products of restriction digests were purified using GeneJET gel extraction kit (Thermo Scientific) according to the manufacturer’s protocols. Restriction enzymes and ligases were purchased from New England Biolabs or Thermo Scientific. The cDNA sequences were confirmed by dye terminator cycle sequencing using the BigDye Terminator v3.1 Cycle Sequencing Kit (Applied Biosystems). Sequencing reactions were analyzed at the University of Alberta Molecular Biology Service Unit.
Supporting information S1 Table
Amino acid substitutions in new RFPs described in this work. (PDF) Click here for additional data file. S1 Fig Representative fluorescence images of cells expressing mCherry and mEGFP fusions. (PDF) Click here for additional data file.
S1 Dataset
Numerical data for all figures. (XLSX) Click here for additional data file.
📊 Figures
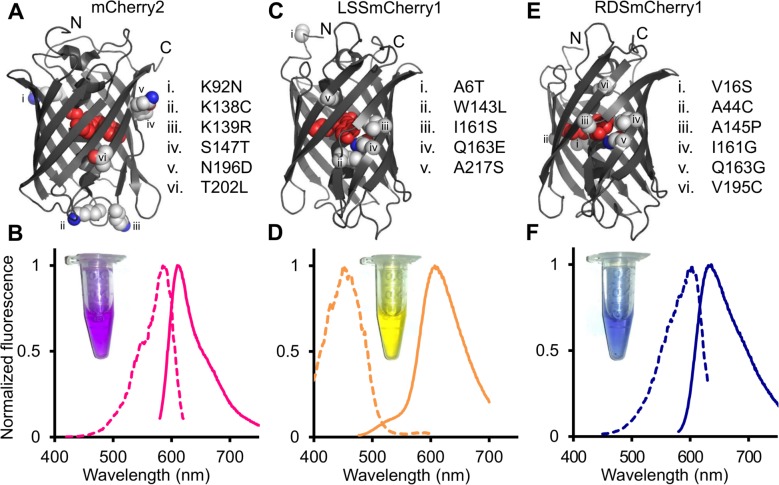
Fig 1
Summary of mutations and fluorescence spectra of mCherry2, LSSmCherry1, and RDSmCherry1.
(A,C,E) Positions of amino acid substitutions mapped onto the crystal structure of mCherry (PDB ID: 2H5Q) [ 50 ] for (A) mCherry2, (B) LSSmCherry1, and (C) RDSmCherry1. (B,D,F) Normalized fluorescence...
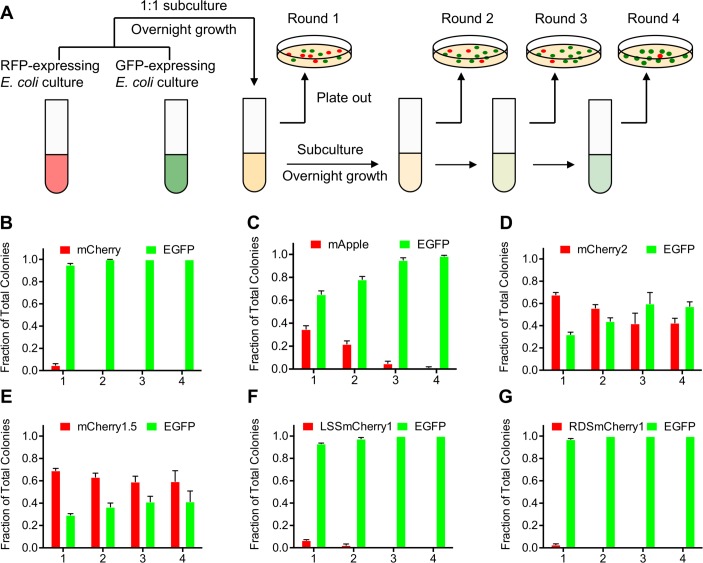
Fig 2
Bacterial cytotoxicity assay.
(A) Schematic representation of the workflow used to evaluate the cytotoxicity of RFPs. (B-G) Results obtained when the assay represented in (A) was applied to (B) mCherry, (C) mApple, (D) mCherry2, (...
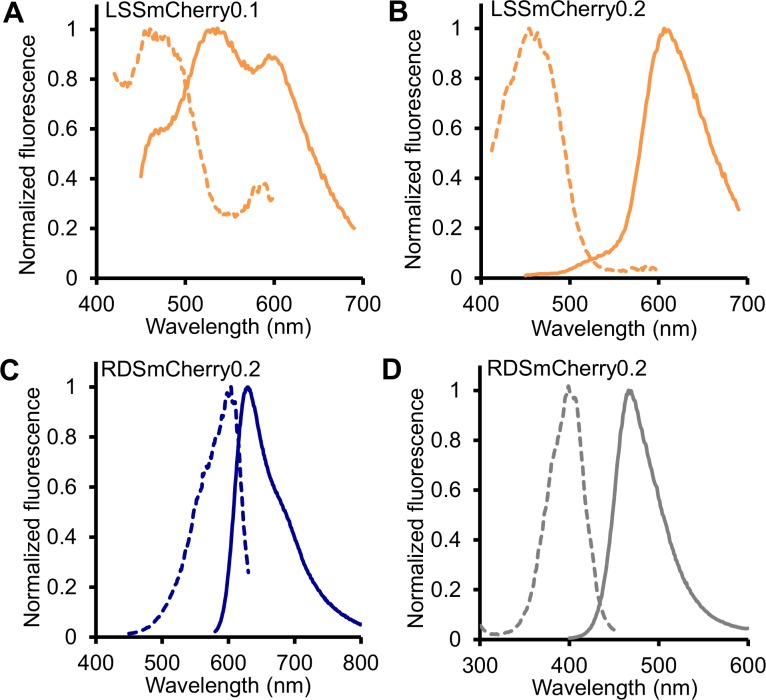
Fig 3
Fluorescence profiles of key intermediates in the directed evolution of LSSmCherry and RDSmCherry.
Normalized fluorescence excitation (dashed line) and emission spectra (solid line) of (A) LSSmCherry0.1, (B) LSSmCherry0.2, (C) the red fluorescent component of RDSmCherry0.2, and (D) the blue fluores...
Figure images are served from the NIH/NLM PubMed Central Open Access Subset or Europe PMC; copyright remains with the publishers and authors.
💬 Discussion
0 commentsNo comments yet. Be the first to start a discussion!
Leave a Comment