Abstract
Imaging flow cytometry (IFC) enables the high throughput collection of morphological and spatial information from hundreds of thousands of single cells. This high content, information rich image data can in theory resolve important biological differences among complex, often heterogeneous biological samples. However, data analysis is often performed in a highly manual and subjective manner using very limited image analysis techniques in combination with conventional flow cytometry gating strategies. This approach is not scalable to the hundreds of available image-based features per cell and thus makes use of only a fraction of the spatial and morphometric information. As a result, the quality, reproducibility and rigour of results are limited by the skill, experience and ingenuity of the data analyst. Here, we describe a pipeline using open-source software that leverages the rich information in digital imagery using machine learning algorithms. Compensated and corrected raw image files (.rif) data files from an imaging flow cytometer (the proprietary .cif file format) are imported into the open-source software CellProfiler, where an image processing pipeline identifies cells and subcellular compartments allowing hundreds of morphological features to be measured. This high-dimensional data can then be analysed using cutting-edge machine learning and clustering approaches using "user-friendly" platforms such as CellProfiler Analyst. Researchers can train an automated cell classifier to recognize different cell types, cell cycle phases, drug treatment/control conditions, etc., using supervised machine learning. This workflow should enable the scientific community to leverage the full analytical power of IFC-derived data sets. It will help to reveal otherwise unappreciated populations of cells based on features that may be hidden to the human eye that include subtle measured differences in label free detection channels such as bright-field and dark-field imagery.
✨ Fluorophores
🧪 Sample Preparation
🔬 Cell Lines
💻 Software Details
🏛️ Research Organizations (ROR)
Affiliated research institutions:
📋 Methods
Data acquisition in imaging flow cytometry
We briefly review data acquisition in imaging flow cytometers, for a more extensive overview see [27] . Fluorescently labelled or unlabelled cells in solution are run through the ImageStream or FlowSight (Amnis) imaging flow cytometer and the data is acquired using the INSPIRE control software. Much like traditional flow cytometry, appropriately stained cells should also be measured as controls in order to perform compensation before any analysis is carried out. The INSPIRE acquisition software generates data in the form of a raw image file (.rif file) which can then be directly loaded into IDEAS for further analysis. When the .rif file is loaded into IDEAS, a compensation matrix generated from the fluorescence control experiments can be used to produce a compensated image file (.cif file). In the IDEAS environment, the user can plot features derived from the bright-field, dark-field and fluorescence single cell images in the form of histograms or bivariate scatter plots. Gating can be performed using these plots to generate sub-populations that can be then be studied in further detail. The plots, gating and sub-population information from a session can then be saved as a data analysis file (.daf file). It is also possible to generate individual tiff images from each channel for each cell to analyse outside of the IDEAS framework. IDEAS is especially suited for visually inspecting the data irrespective of the further analysis pipeline the user wishes to perform. The important first steps of identifying out-of-focus cells and removing debris or multiple cells are best carried out using this software platform. IDEAS suggests using a measure of the gradient RMS of the bright-field image to determine the focus quality of each cell. By gating the high values in the gradient RMS histogram a subpopulation of in-focus cells is defined ( Fig. 2 , left). The next step is to identify the single cells by plotting the cell mask aspect ratio versus the cell mask area. A 2D gating window is defined to select cells with an aspect ratio close to 1, which removes clumped cells, while also rejecting high and low areas, which removes debris ( Fig. 2 , right). Once subpopulations are identified via gating they can be saved as a new .cif file in IDEAS, which serves as the starting point for our protocol. From data acquisition to high-throughput data analysis To enable the application of advanced high-throughput data analysis to imaging flow cytometry, we developed a new protocol to harvest and analyse the rich information in images acquired via imaging flow cytometers. Our aim is to provide an open-source protocol that enables user-friendly data processing and extraction of hundreds of features in high-throughput and connects to state-of-the-art data analysis based on machine learning techniques. As discussed above we previously developed a methodology for using high throughput data analysis techniques on imaging flow cytometry data; however, the pipeline required significant computational skills and bespoke MATLAB scripts. Our previous protocol consists of the following steps ( Fig. 3 A). 1. Extract hundreds of thousands to millions of single cell images (tif files) from a single .cif file using IDEAS software and store them to disk as individual files. 2. Pre-process the single cell images: Combine single cell images to montages of 15 × 15 images using a MATLAB script. 3. Segment images and extract hundreds of features per cell per channel, e.g., using CellProfiler. A table of features for each cell can then be exported in a variety of different formats e.g. csv, mat. 4. Downstream data analysis (such as machine learning, feature selection, data visualization, etc.) can then be applied using bespoke code to enable data analysis in high-throughput. In our protocol, we provided MATLAB scripts for this step. While this protocol was successful in allowing the application of advanced multivariate techniques on imaging cytometry data, several issues limit its application. Many IFC analysts find working with MATLAB scripts to be outside their skill level and thus require computational assistance. Also, handling the hundreds of thousands up to millions of individual tiff images for each channel for each cell files is very slow and difficult to manage for the computer’s file system. We have experienced problems exporting, moving or deleting such a high number of files causing the system to slow down, crash and fragment the disk drive. To minimise the complexity of the pipeline, we developed an improved protocol that makes imaging flow cytometry data analysis in high-throughput much more streamlined and user-friendly. One major advance is to keep the individual cell tiffs within the cif file container and modify CellProfiler to allow the input of the cif file via the ‘drag and drop’ interface. This eliminates the prior first step, extracting hundreds of thousands or millions of single tiff images and creating tiles therefrom. The main reason for tiling the single cell images (besides not obstructing the file system) is computational speed: CellProfiler operates image-wise and can quickly detect hundreds or thousands of objects in an image. Linearly crawling through a million tiny images is not practical or feasible in a reasonable time given the overhead of opening individual image files. Instead, the new protocol handles about 1000 tiled images (with 1000 cells in each image tile) when analysing a million cells. We access the cif file with a new cif file reader, which we contributed to Bio-Formats ( http://loci.wisc.edu/software/bio-formats ). Bio-Formats is a community driven project with a standardised application interface that supports open source analysis programs like ImageJ, CellProfiler and Icy, informatics solutions like OMERO and the JCB DataViewer, and commercial programs like MATLAB. As such, a cif file can now simply be loaded by those programs. We have integrated the cif file reader into the ‘Images’ module in CellProfiler, via BioFormats, allowing the direct input of the individual cell images for all channels (bright-field, dark-field and fluorescence channels). We have also implemented the tiling of the single cell images within CellProfiler, which removes the need for the software solution in step 2 of our previous protocol. Our new imaging flow cytometry protocol is as follows ( Fig. 3 B, using CellProfiler): 1. Load .cif file in CellProfiler (drag & drop). 2. Segment images and extract hundreds of features per cell per channel using CellProfiler. An example pipeline can be found at http://cellprofiler.org/imagingflowcytometry/index.html . 3. Multiclass machine learning using CellProfiler Analyst. In addition, the protocol has also become more streamlined if alternate image analysis or data mining software is preferred ( Fig. 3 C): 1. Run a Python or MATLAB script to automatically generate tiles of ∼1000 single cell images per tile. A script for this step is available on the website http://cellprofiler.org/imagingflowcytometry/index.html . 2. Load image tiles in your preferred image analysis software such as ilastik, CellProfiler, etc. and analyse images. Export features as .csv file. 3. Multiclass machine learning using any programming language, data analysis tool or visualization tool. In ( [6] ), we reported the label-free classification of the cell cycle phases using supervised machine learning techniques on bright-field and dark-field images only. Such high-throughput analyses of IFC data can now be streamlined in a smooth and user-friendly way, making machine learning techniques more accessible. Supervised machine learning is a powerful approach, where the computer “learns” to recognize cells meeting certain criteria, based on examples provided by the biologist expert. It relies on the hundreds of morphological parameters that have been measured for each cell. Although any programming language, data analysis tool or visualization tool can be used based on the extracted features, CellProfiler Analyst is a particularly user-friendly option we tested in our protocol. CellProfiler Analyst is free open-source software for exploring and analysing large, high-dimensional image-derived data. It includes machine learning tools for identifying complex and subtle phenotypes [28] . CellProfiler Analyst has recently been updated to include multi-class classification, and it now offers a variety of supervised machine learning techniques [29] . Example: label-free cell-cycle classification of Jurkat cells We demonstrate our new protocol of analysing IFC data in high-throughput by predicting the cell cycle phase of Jurkat cells based on bright-field and dark-field images only. While the cell-cycle phase can be determined using fluorescent markers of various stages of mitosis, we previously showed that by extracting hundreds of features and using machine learning techniques, it is possible to accurately predict the cell cycle phase without the use of any markers [6] . This method facilitates non-destructive monitoring of cells, avoiding potentially confounding effects of fluorescent stains while maximizing available fluorescence channels. We will consider the following 5 classes: interphase, and the 4 mitotic phases: prophase, metaphase, anaphase and telophase. The raw images stem from an ImageStream platform where 32,255 asynchronously growing Jurkat cells have been imaged. We use the same Jurkat cell data set from [6] in order to demonstrate the individual steps of the new protocol and to compare our results with a previous benchmark. As controls, the cells were fixed and stained with PI (propidium iodide) to quantify DNA content and a MPM2 (mitotic protein monoclonal #2) antibody to identify mitotic cells. These fluorescent markers were used to annotate the cells with the ground truth (expected results) needed to train the machine-learning algorithms and to evaluate the predictive accuracy of our label-free approach. The ground truth was obtained through gating in IDEAS by using the features from the fluorescent marker channels. Step 1: Image montages are generated from a .cif file via an automated python script. The script directly reads the .cif file and writes the image montages to disk within seconds (download the script from http://cellprofiler.org/imagingflowcytometry/index.html ). Step 2: We load the montages into CellProfiler (drag & drop) and run a pipeline to measure hundreds of features in bright-field and dark-field (download the pipeline from http://cellprofiler.org/imagingflowcytometry/index.html ). The pipeline exports the measurements as a csv file, which can be used with any programming language for downstream data analysis such as machine learning. In addition, the pipeline exports a CellProfiler Analyst properties file (with an SQLite database file). The properties file is a simple text file that can be edited with any text editor. The properties file includes a section where features can be excluded from the classifier; in our case we exclude irrelevant features such as location or angular orientation of the cells (download a sample properties file from http://cellprofiler.org/imagingflowcytometry/index.html ). Step 3: Load properties file into CellProfiler Analyst for the machine learning. See Fig. 4 for details [30] , and the online manual for an introduction to machine learning using CellProfiler Analyst ( http://cellprofiler.org/CPA ). CellProfiler Analyst now includes several machine learning algorithm options; for our purposes, we chose a GradientBoosting classifier and a Random Forest classifier. We picked boosting in order to compare with the boosting results in (Blasi et al., 2016), and Random Forests as a second approach often considered best-in-class. Briefly, boosting produces a prediction model in the form of an ensemble of weak prediction models, typically decision trees. The main idea behind boosting is that a set of weak learners (“specialists for specific prediction tasks”) can form a single strong learner. The name GradientBoosting reflects that a gradient descent algorithm is used to minimize a cost function when constructing the set of learners. Boosting, however, is very sensitive to mis-labeling and noise; we therefore used an additional method, Random Forests, which is also based on decision trees but typically more robust. Random Forests reduces the variance of an ensemble of “complex” models, whereas in Boosting the composition elements are “weak” models.
Show full methods section
Data acquisition in imaging flow cytometry
We briefly review data acquisition in imaging flow cytometers, for a more extensive overview see [27] . Fluorescently labelled or unlabelled cells in solution are run through the ImageStream or FlowSight (Amnis) imaging flow cytometer and the data is acquired using the INSPIRE control software. Much like traditional flow cytometry, appropriately stained cells should also be measured as controls in order to perform compensation before any analysis is carried out. The INSPIRE acquisition software generates data in the form of a raw image file (.rif file) which can then be directly loaded into IDEAS for further analysis. When the .rif file is loaded into IDEAS, a compensation matrix generated from the fluorescence control experiments can be used to produce a compensated image file (.cif file). In the IDEAS environment, the user can plot features derived from the bright-field, dark-field and fluorescence single cell images in the form of histograms or bivariate scatter plots. Gating can be performed using these plots to generate sub-populations that can be then be studied in further detail. The plots, gating and sub-population information from a session can then be saved as a data analysis file (.daf file). It is also possible to generate individual tiff images from each channel for each cell to analyse outside of the IDEAS framework. IDEAS is especially suited for visually inspecting the data irrespective of the further analysis pipeline the user wishes to perform. The important first steps of identifying out-of-focus cells and removing debris or multiple cells are best carried out using this software platform. IDEAS suggests using a measure of the gradient RMS of the bright-field image to determine the focus quality of each cell. By gating the high values in the gradient RMS histogram a subpopulation of in-focus cells is defined ( Fig. 2 , left). The next step is to identify the single cells by plotting the cell mask aspect ratio versus the cell mask area. A 2D gating window is defined to select cells with an aspect ratio close to 1, which removes clumped cells, while also rejecting high and low areas, which removes debris ( Fig. 2 , right). Once subpopulations are identified via gating they can be saved as a new .cif file in IDEAS, which serves as the starting point for our protocol. From data acquisition to high-throughput data analysis To enable the application of advanced high-throughput data analysis to imaging flow cytometry, we developed a new protocol to harvest and analyse the rich information in images acquired via imaging flow cytometers. Our aim is to provide an open-source protocol that enables user-friendly data processing and extraction of hundreds of features in high-throughput and connects to state-of-the-art data analysis based on machine learning techniques. As discussed above we previously developed a methodology for using high throughput data analysis techniques on imaging flow cytometry data; however, the pipeline required significant computational skills and bespoke MATLAB scripts. Our previous protocol consists of the following steps ( Fig. 3 A). 1. Extract hundreds of thousands to millions of single cell images (tif files) from a single .cif file using IDEAS software and store them to disk as individual files. 2. Pre-process the single cell images: Combine single cell images to montages of 15 × 15 images using a MATLAB script. 3. Segment images and extract hundreds of features per cell per channel, e.g., using CellProfiler. A table of features for each cell can then be exported in a variety of different formats e.g. csv, mat. 4. Downstream data analysis (such as machine learning, feature selection, data visualization, etc.) can then be applied using bespoke code to enable data analysis in high-throughput. In our protocol, we provided MATLAB scripts for this step. While this protocol was successful in allowing the application of advanced multivariate techniques on imaging cytometry data, several issues limit its application. Many IFC analysts find working with MATLAB scripts to be outside their skill level and thus require computational assistance. Also, handling the hundreds of thousands up to millions of individual tiff images for each channel for each cell files is very slow and difficult to manage for the computer’s file system. We have experienced problems exporting, moving or deleting such a high number of files causing the system to slow down, crash and fragment the disk drive. To minimise the complexity of the pipeline, we developed an improved protocol that makes imaging flow cytometry data analysis in high-throughput much more streamlined and user-friendly. One major advance is to keep the individual cell tiffs within the cif file container and modify CellProfiler to allow the input of the cif file via the ‘drag and drop’ interface. This eliminates the prior first step, extracting hundreds of thousands or millions of single tiff images and creating tiles therefrom. The main reason for tiling the single cell images (besides not obstructing the file system) is computational speed: CellProfiler operates image-wise and can quickly detect hundreds or thousands of objects in an image. Linearly crawling through a million tiny images is not practical or feasible in a reasonable time given the overhead of opening individual image files. Instead, the new protocol handles about 1000 tiled images (with 1000 cells in each image tile) when analysing a million cells. We access the cif file with a new cif file reader, which we contributed to Bio-Formats ( http://loci.wisc.edu/software/bio-formats ). Bio-Formats is a community driven project with a standardised application interface that supports open source analysis programs like ImageJ, CellProfiler and Icy, informatics solutions like OMERO and the JCB DataViewer, and commercial programs like MATLAB. As such, a cif file can now simply be loaded by those programs. We have integrated the cif file reader into the ‘Images’ module in CellProfiler, via BioFormats, allowing the direct input of the individual cell images for all channels (bright-field, dark-field and fluorescence channels). We have also implemented the tiling of the single cell images within CellProfiler, which removes the need for the software solution in step 2 of our previous protocol. Our new imaging flow cytometry protocol is as follows ( Fig. 3 B, using CellProfiler): 1. Load .cif file in CellProfiler (drag & drop). 2. Segment images and extract hundreds of features per cell per channel using CellProfiler. An example pipeline can be found at http://cellprofiler.org/imagingflowcytometry/index.html . 3. Multiclass machine learning using CellProfiler Analyst. In addition, the protocol has also become more streamlined if alternate image analysis or data mining software is preferred ( Fig. 3 C): 1. Run a Python or MATLAB script to automatically generate tiles of ∼1000 single cell images per tile. A script for this step is available on the website http://cellprofiler.org/imagingflowcytometry/index.html . 2. Load image tiles in your preferred image analysis software such as ilastik, CellProfiler, etc. and analyse images. Export features as .csv file. 3. Multiclass machine learning using any programming language, data analysis tool or visualization tool. In ( [6] ), we reported the label-free classification of the cell cycle phases using supervised machine learning techniques on bright-field and dark-field images only. Such high-throughput analyses of IFC data can now be streamlined in a smooth and user-friendly way, making machine learning techniques more accessible. Supervised machine learning is a powerful approach, where the computer “learns” to recognize cells meeting certain criteria, based on examples provided by the biologist expert. It relies on the hundreds of morphological parameters that have been measured for each cell. Although any programming language, data analysis tool or visualization tool can be used based on the extracted features, CellProfiler Analyst is a particularly user-friendly option we tested in our protocol. CellProfiler Analyst is free open-source software for exploring and analysing large, high-dimensional image-derived data. It includes machine learning tools for identifying complex and subtle phenotypes [28] . CellProfiler Analyst has recently been updated to include multi-class classification, and it now offers a variety of supervised machine learning techniques [29] . Example: label-free cell-cycle classification of Jurkat cells We demonstrate our new protocol of analysing IFC data in high-throughput by predicting the cell cycle phase of Jurkat cells based on bright-field and dark-field images only. While the cell-cycle phase can be determined using fluorescent markers of various stages of mitosis, we previously showed that by extracting hundreds of features and using machine learning techniques, it is possible to accurately predict the cell cycle phase without the use of any markers [6] . This method facilitates non-destructive monitoring of cells, avoiding potentially confounding effects of fluorescent stains while maximizing available fluorescence channels. We will consider the following 5 classes: interphase, and the 4 mitotic phases: prophase, metaphase, anaphase and telophase. The raw images stem from an ImageStream platform where 32,255 asynchronously growing Jurkat cells have been imaged. We use the same Jurkat cell data set from [6] in order to demonstrate the individual steps of the new protocol and to compare our results with a previous benchmark. As controls, the cells were fixed and stained with PI (propidium iodide) to quantify DNA content and a MPM2 (mitotic protein monoclonal #2) antibody to identify mitotic cells. These fluorescent markers were used to annotate the cells with the ground truth (expected results) needed to train the machine-learning algorithms and to evaluate the predictive accuracy of our label-free approach. The ground truth was obtained through gating in IDEAS by using the features from the fluorescent marker channels. Step 1: Image montages are generated from a .cif file via an automated python script. The script directly reads the .cif file and writes the image montages to disk within seconds (download the script from http://cellprofiler.org/imagingflowcytometry/index.html ). Step 2: We load the montages into CellProfiler (drag & drop) and run a pipeline to measure hundreds of features in bright-field and dark-field (download the pipeline from http://cellprofiler.org/imagingflowcytometry/index.html ). The pipeline exports the measurements as a csv file, which can be used with any programming language for downstream data analysis such as machine learning. In addition, the pipeline exports a CellProfiler Analyst properties file (with an SQLite database file). The properties file is a simple text file that can be edited with any text editor. The properties file includes a section where features can be excluded from the classifier; in our case we exclude irrelevant features such as location or angular orientation of the cells (download a sample properties file from http://cellprofiler.org/imagingflowcytometry/index.html ). Step 3: Load properties file into CellProfiler Analyst for the machine learning. See Fig. 4 for details [30] , and the online manual for an introduction to machine learning using CellProfiler Analyst ( http://cellprofiler.org/CPA ). CellProfiler Analyst now includes several machine learning algorithm options; for our purposes, we chose a GradientBoosting classifier and a Random Forest classifier. We picked boosting in order to compare with the boosting results in (Blasi et al., 2016), and Random Forests as a second approach often considered best-in-class. Briefly, boosting produces a prediction model in the form of an ensemble of weak prediction models, typically decision trees. The main idea behind boosting is that a set of weak learners (“specialists for specific prediction tasks”) can form a single strong learner. The name GradientBoosting reflects that a gradient descent algorithm is used to minimize a cost function when constructing the set of learners. Boosting, however, is very sensitive to mis-labeling and noise; we therefore used an additional method, Random Forests, which is also based on decision trees but typically more robust. Random Forests reduces the variance of an ensemble of “complex” models, whereas in Boosting the composition elements are “weak” models.
📊 Figures
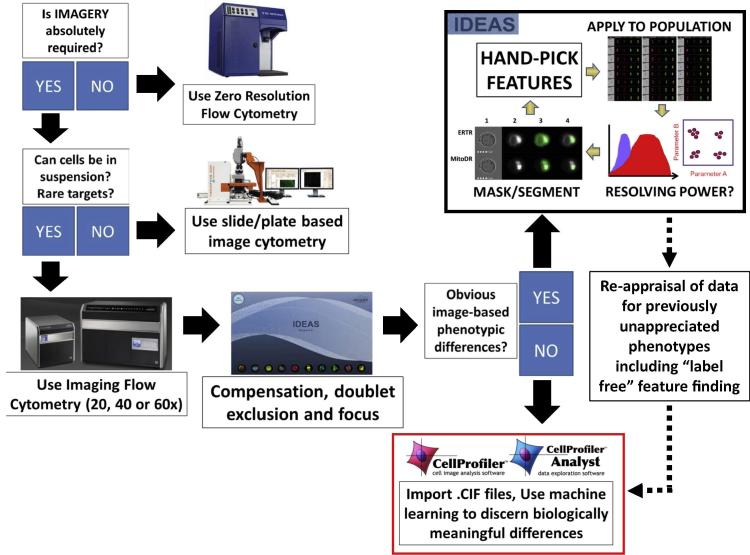
Fig. 1
Guidance on choosing cytometric method and analysis method. Any researcher who wants to use cytometry technology to ask a defined question should consider u201cwhat is the best approachu201d based on ...
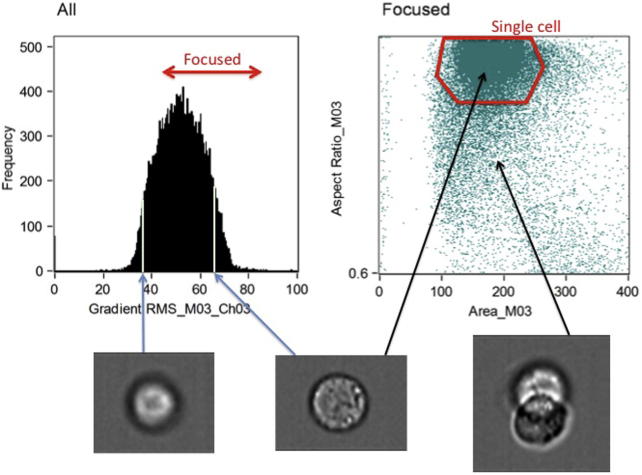
Fig. 2
In-focus single cells are gated from the population using bright-field images. Left: cells with a sufficiently high gradient RMS are in-focus (left). Right: objects with a high aspect ratio (a measure...
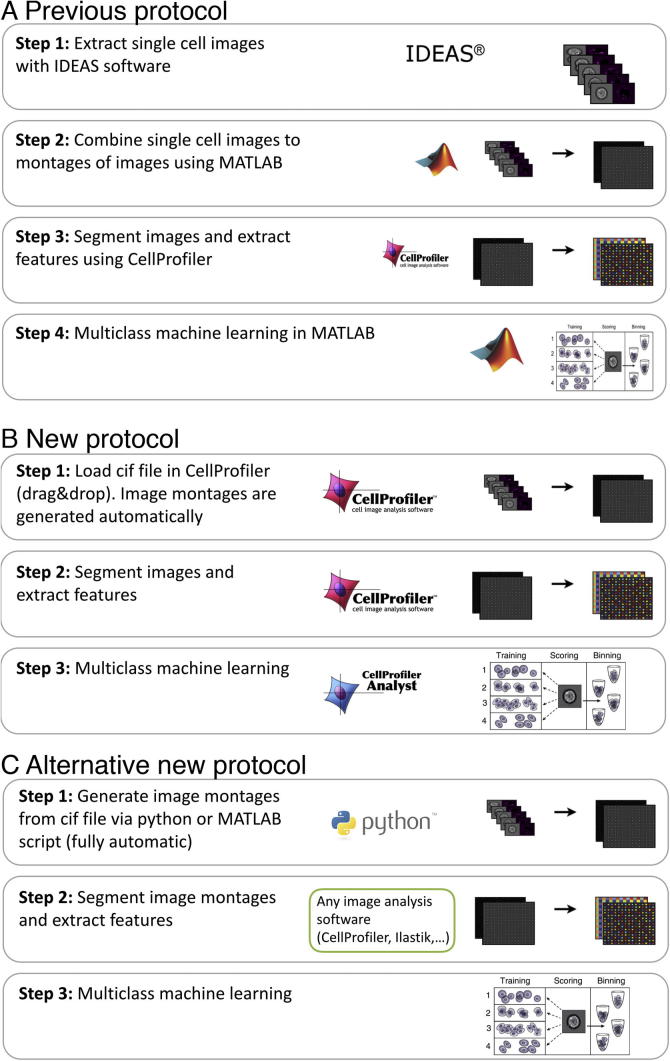
Fig. 3
(A) Previous protocol for high-throughput data analysis for imaging flow cytometry [6] . (B) New protocol for high-throughput data analysis in imaging flow cytometry, built from open-source, user-frie...
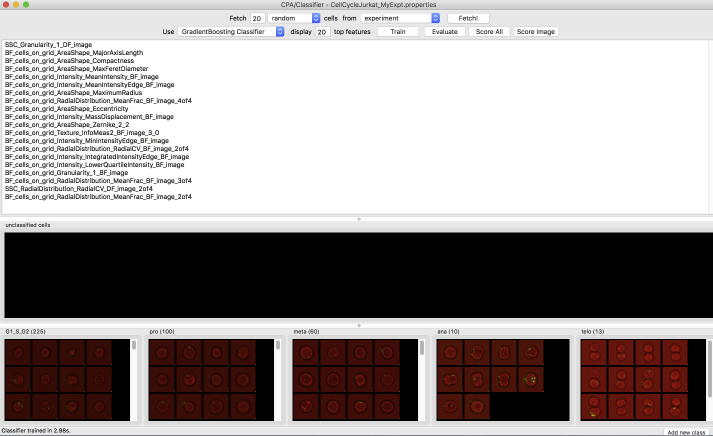
Fig. 4
Classification of the cell cycle of Jurkat cells using machine learning in CellProfiler Analyst. The cell images can be sorted via drag & drop into the five different bins at the bottom, which are int...
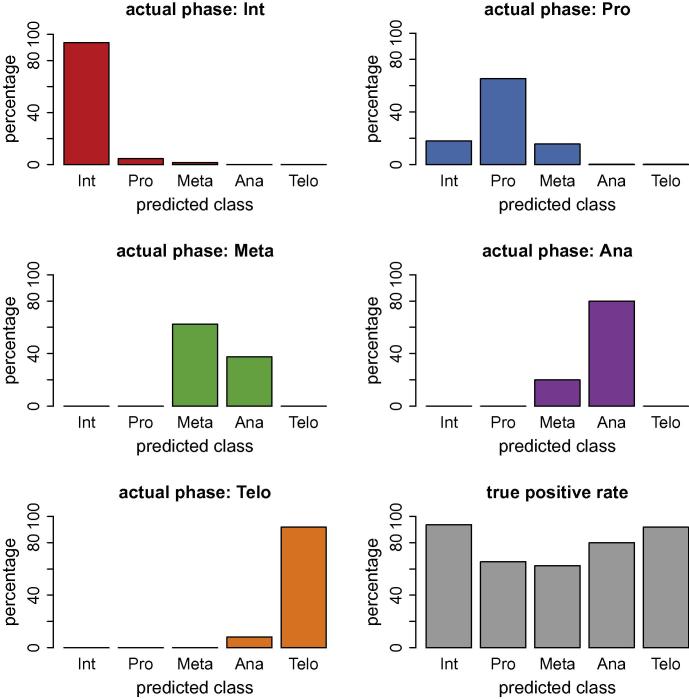
Fig. 5
Label-free prediction of cell-cycle phases using Gradient Boosting classification. The true positive rate (which is the ratio between correctly scored phase and total number of cells in that phase) is...
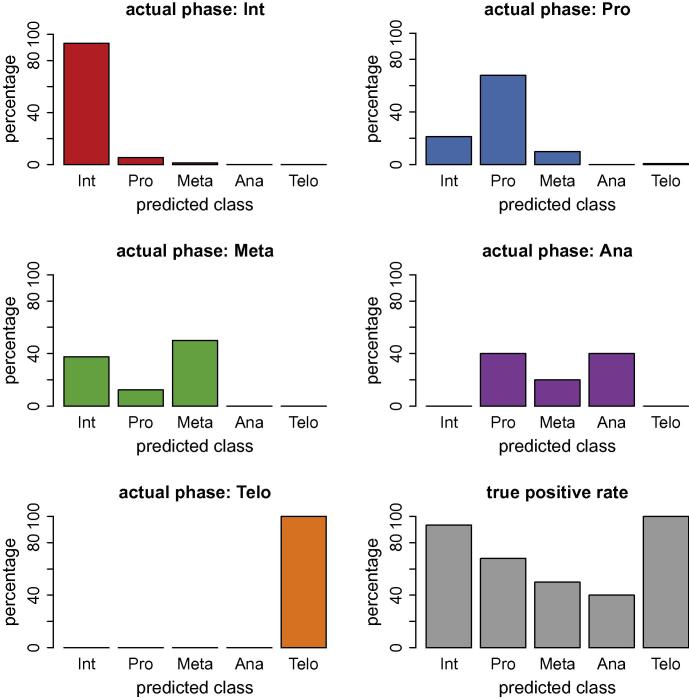
Fig. 6
Label-free prediction of cell-cycle phases using a Random Forest classifier.
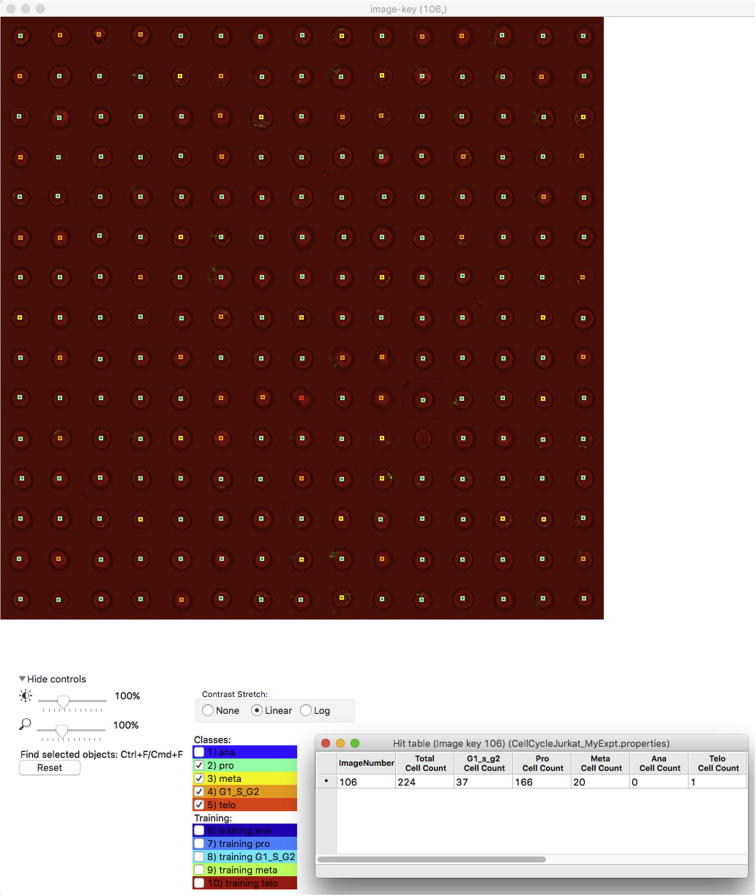
Fig. 7
Example images of 224 cells from the test set where the cell cycle phase was predicted using machine learning (GradientBoosting). All cells displayed were deemed prophase based on our ground truth. Gr...
Figure images are served from the NIH/NLM PubMed Central Open Access Subset or Europe PMC; copyright remains with the publishers and authors.
💬 Discussion
0 commentsNo comments yet. Be the first to start a discussion!
Leave a Comment