Abstract
Microtubules (MTs) are polymers of αβ-tubulin heterodimers that stochastically switch between growth and shrinkage phases. This dynamic instability is critically important for MT function. It is believed that GTP hydrolysis within the MT lattice is accompanied by destabilizing conformational changes and that MT stability depends on a transiently existing GTP cap at the growing MT end. Here, we use cryo-electron microscopy and total internal reflection fluorescence microscopy of GTP hydrolysis-deficient MTs assembled from mutant recombinant human tubulin to investigate the structure of a GTP-bound MT lattice. We find that the GTP-MT lattice of two mutants in which the catalytically active glutamate in α-tubulin was substituted by inactive amino acids (E254A and E254N) is remarkably plastic. Undecorated E254A and E254N MTs with 13 protofilaments both have an expanded lattice but display opposite protofilament twists, making these lattices distinct from the compacted lattice of wild-type GDP-MTs. End-binding proteins of the EB family have the ability to compact both mutant GTP lattices and to stabilize a negative twist, suggesting that they promote this transition also in the GTP cap of wild-type MTs, thereby contributing to the maturation of the MT structure. We also find that the MT seam appears to be stabilized in mutant GTP-MTs and destabilized in GDP-MTs, supporting the proposal that the seam plays an important role in MT stability. Together, these structures of catalytically inactive MTs add mechanistic insight into the GTP state of MTs, the stability of the GTP- and GDP-bound lattice, and our overall understanding of MT dynamic instability.
🔬 Techniques
🧬 Organisms
✨ Fluorophores
🔬 Cell Lines
🏭 Microscope Brands
🧪 Reagent Suppliers
📷 Detectors
💻 Software Details
💾 Data Repositories
🏷️ Research Resource Identifiers (RRIDs)
Verified research resources used in this paper:
🏛️ Research Organizations (ROR)
Affiliated research institutions:
📋 Methods
Purification of Recombinant Human Tubulin. Human tubulin was purified recombinantly as described previously ( 21 ). Briefly, cell pellets from 2 L of High Five insect cells expressing human TUBB3-TEVsite-StrepTagII, with the C-terminal StrepTagII cleavable by tobacco etch virus (TEV) protease, and TUBA1B-His internal (wt, E254A, or E254D) were resuspended 1:1 (vol/vol) in cold lysis buffer and lysed by douncing 60 times. Lysate was diluted fourfold in dilution buffer and clarified by ultracentrifugation (158,420 × g, 1 h, 4 °C). The supernatant was passed through a 5-mL HisTrap HP column (GE Healthcare), and the eluate was immediately diluted six times in Strep buffer and passed through a 1-mL HiPrep SP FF column, followed by a 5-mL StrepTrap HP column (GE Healthcare). Tubulin was eluted off the column, diluted twofold in Strep elution buffer, and incubated on ice for 2 h with TEV protease to remove the StrepTagII from TUBB3. The eluate was then clarified by ultracentrifugation (204,428 × g, 10 min, 4 °C). The supernatant was passed through a 1-mL HiPrep SP FF column, desalted into storage buffer, concentrated to 3.5 mg/mL, ultracentrifuged (278,088 × g, 10 min, and 4 °C), and flash frozen in 10 µL aliquots with liquid nitrogen ( Table 2 ). Table 2. Buffers for the purification of recombinant tubulin Buffer Composition Lysis 80 mM PIPES, 1 mM EGTA, 6 mM MgCl 2 , 50 mM imidazole, 100 mM KCl, 2 mM GTP, 1 mM BME, and pH 7.2 + protease inhibitors and DNase Dilution 80 mM PIPES, 1 mM EGTA, 6 mM MgCl 2 , 50 mM imidazole, 2 mM GTP, 1 mM BME, and pH 7.2 His elution 80 mM PIPES, 1 mM EGTA, 5 mM MgCl 2 , 500 mM imidazole, 2 mM GTP, 1 mM BME, and pH 7.2 Strep binding 80 mM PIPES, 1 mM EGTA, 5 mM MgCl 2 , 2 mM GTP, mM BME, and pH 7.2 Strep elution 80 mM PIPES, 1 mM EGTA, 4 mM MgCl 2 , 2.5 mM D-desthiobiotin, 50 mM imidazole, 2 mM GTP, 1 mM BME, and pH 7.2 Storage 80 mM PIPES, 1 mM EGTA, 1 mM MgCl 2 , 0.2 mM GTP, and pH 6.8 Purification of EB3. Monomeric EB3 used for cryo-EM was purified as previously described ( 8 , 33 ). Human EB3 1–200 was inserted into a 2BT vector with a C-terminal His-tag (Macrolab, University of California, Berkeley [UC Berkeley]) and expressed in BL21(DE3)-RIL Escherichia coli . Cell pellets from a 2-L culture were resuspended in 1:2 (vol/vol) lysis buffer and lysed by sonication. Cell debris was pelleted by centrifugation (18,000 × g, 45 min, 4 °C), and supernatant was loaded on a 5-mL HisTrap column (GE Healthcare) and eluted with a 0 to 100% gradient of lysis buffer to elution buffer. The elution was incubated with TEV protease overnight at 4 °C to remove the His-tag, followed by a subtractive nickel purification to remove TEV, uncleaved EB3, and the His-tag. The flow-through was concentrated to 500 µL and loaded on a Superdex 200 10/300 GL pre-equilibrated in SEC buffer for size-exclusion chromatography. Peak fractions were pooled, concentrated to 20 µM, and flash frozen in SEC buffer until needed ( Table 3 ). mGFP-EB3 used for TIRF microscopy was purified as described ( 21 ). Table 3. Buffers for the purification of monomeric EB3 Lysis 50 mM Tris pH 8.0, 150 mM NaCl, 1 mM EDTA, 1 mM DTT + protease inhibitors, DNase, RNase, and Lysozyme His elution 50 mM Tris pH 8.0, 150 mM NaCl, 1 mM EDTA, 1 mM DTT, and 300 mM imidazole SEC buffer 50 mM Tris pH 8.0, 150 mM NaCl, 1 mM EDTA, 1 mM DTT, and 10% glycerol Purification of Kinesin. The kinesin plasmid was generously supplied by the Vale laboratory ( 35 ) and purified as described previously ( 5 ). The plasmid encoding His 6 -tagged, monomeric, catalytically inactive Kif5b (1 to 350aa, E236A) was transformed into BL21(DE3) cells for expression. Upon reaching optical density (OD) 600 = 0.5, the 1-L expression culture was brought to 22 °C and induced with 0.2 mM IPTG (isopropyl ß-D-1-thiogalactopyranoside) for 16 h. The cells were harvested with by centrifugation at 4,000 g for 20 min at 4 °C. Cell pellets were resuspended in lysis buffer and incubated at room temperature for 30 min followed by sonication (3 × 45 s, at power level 7). The lysate was clarified by centrifugation at 30,000 g for 60 min, and the supernatant was then incubated with Nickel-NTA beads (GE Healthcare). The protein was washed with 6 column volumes of wash buffer and eluted with 2 column volumes of elution buffer. The elution was pooled and loaded onto a size-exclusion column equilibrated with SEC buffer. Fractions were analyzed by SDS-PAGE (sodium dodecyl sulphate–polyacrylamide gel electrophoresis) for kinesin, and peak fractions were pooled and concentrated to 20 µM before flash-freezing in liquid nitrogen until needed ( Table 4 ). Table 4. Buffers for the purification of kinesin Lysis 50 mM NaPO 4 pH 8.0, 300 mM KCl, 2 mM MgCl 2 , 10% glycerol, 10 mM Imidazole, and 1 mM DTT Wash 50 mM NaPO 4 pH 8.0, 150 mM KCl, 2 mM MgCl 2 , 10% glycerol, 30 mM Imidazole, 1 mM DTT, and 200 µM ATP Elution 50 mM NaPO 4 pH 8.0, 150 mM KCl, 2 mM MgCl 2 , 10% glycerol, 250 mM Imidazole, and 1 mM DTT SEC buffer 25 mM Tris pH 7.5, 150 mM KCl, 10% glycerol, 2 mM MgCl 2 , and 2 mM DTT Cryo-EM Sample Preparation. Cryo-EM specimens were prepared on CFlat 1.2/1.3-T open-hole grids (Protochips) that were plasma cleaned for 30 s with a Tergeo plasma cleaner (Pie Scientific). A 10-µL aliquot of tubulin was thawed on ice for 10 min and supplemented with 0.05% Nonidet P-40. The tubulin was incubated at 37 °C for 30 to 40 min to form MTs. While polymerizing, the Vitrobot Mark IV was equilibrated to the following conditions: 37 °C, 100% humidity, 15 blot force, and a 4-s blot with 1-s drain time. In total, 2 µL of MT solution was adsorbed onto the grid for 30 s followed by plunge freezing into a eutectic solution of liquid ethane/propane (70:30). For conditions in which Kinesin or EB3 were used to decorate the MT, two 4-µL aliquots of 20 µM kinesin/EB3 were added to the MT grid with a 30-s wait time in between additions to allow binding. Blotting conditions were identical for all mutants and decorating MT-associated proteins to maintain consistency. Cryo-EM Data Collection. All grids were clipped and loaded into a Gatan Autoloader for imaging with a Titan Krios microscope at the Cal-Cryo EM facility in UC Berkeley. The data were collected with a Gatan Imagine Filter (GIF) energy filter and Gatan K2 or K3 camera (depending on the dataset) operating in superresolution mode. Data collection was controlled by SerialEM ( 36 ). Each micrograph had a total electron exposure of 40e − collected over 40 frames and was collected within a defocus range of 0.8 to 2 µm. Collection parameters for each dataset are reported in SI Appendix , Table S1 . The E254A structure was obtained over two different data collection sessions, because a more-thorough classification was necessary. It should be noted that the same grid was used for both sessions, and there was no bias in the number of the 13-pf 4-start particles (MT segments used in the image processing) for either of the data collections. Cryo-EM Analysis and Model Building. Data processing was done mostly within the RELION framework ( 37 ). Final processing steps that are specific to MTs were performed in FREALIGN, which was necessary for identifying the correct seam location for undecorated MTs ( 38 ). Briefly, MotionCorr 2.1 5 × 5 patch-based alignment was performed on each micrograph ( 39 ). CTFFind4 was used to estimate the defocus of each micrograph ( 40 ). MTs were manually picked within RELION, and short, MT segments (“particles”) were extracted with a repeat length of 82 Å. Initial pf classification was performed with RELION’s Class3D function on bin4 data. Once the helical parameters were classified, particles within the same class (primarily 13 pf) were unbinned, recentered, and re-extracted. Unbinned particles were refined within RELION, and then converted into FREALIGN format for pseudohelical Fourier symmetrization to improve resolution, as well as to carry out SeamSearch protocols ( 29 ) to correctly identify the seam location. Data processing procedures are summarized in SI Appendix , Fig. S2 . Atomic models were built using a previous porcine MT structure as a template (Protein Data Bank: 6dpu), changing the necessary residues to account for the differences between porcine and human tubulins as well as the active site mutations. Each tubulin subunit was rigid-body docked with PHENIX and refined using the real-space refinement program within PHENIX ( 41 , 42 ). All refinements were treated with the same number of iterations to minimize variations in the processing procedure. For the seam analysis ( Fig. 5 ), atomic coordinates were rigid-body docked into both the C1 and pseudo-helical symmetry refined maps. The displacement was calculated using the colorbyrmsd.py script within PyMol (PyMOL Molecular Graphics System, Schrödinger LLC) and then normalized so that all samples were on the same scale from 0 to 1 Å. Colorbyrmsd.py was also used to calculate displacements between various MT states in SI Appendix , Fig. S3 . Determination of the MT Nucleotide Content. The nucleotide content of E254N MTs ( SI Appendix , Fig. S1 B ) was determined by HPLC as described ( 21 ).
Show full methods section
Purification of Recombinant Human Tubulin. Human tubulin was purified recombinantly as described previously ( 21 ). Briefly, cell pellets from 2 L of High Five insect cells expressing human TUBB3-TEVsite-StrepTagII, with the C-terminal StrepTagII cleavable by tobacco etch virus (TEV) protease, and TUBA1B-His internal (wt, E254A, or E254D) were resuspended 1:1 (vol/vol) in cold lysis buffer and lysed by douncing 60 times. Lysate was diluted fourfold in dilution buffer and clarified by ultracentrifugation (158,420 × g, 1 h, 4 °C). The supernatant was passed through a 5-mL HisTrap HP column (GE Healthcare), and the eluate was immediately diluted six times in Strep buffer and passed through a 1-mL HiPrep SP FF column, followed by a 5-mL StrepTrap HP column (GE Healthcare). Tubulin was eluted off the column, diluted twofold in Strep elution buffer, and incubated on ice for 2 h with TEV protease to remove the StrepTagII from TUBB3. The eluate was then clarified by ultracentrifugation (204,428 × g, 10 min, 4 °C). The supernatant was passed through a 1-mL HiPrep SP FF column, desalted into storage buffer, concentrated to 3.5 mg/mL, ultracentrifuged (278,088 × g, 10 min, and 4 °C), and flash frozen in 10 µL aliquots with liquid nitrogen ( Table 2 ). Table 2. Buffers for the purification of recombinant tubulin Buffer Composition Lysis 80 mM PIPES, 1 mM EGTA, 6 mM MgCl 2 , 50 mM imidazole, 100 mM KCl, 2 mM GTP, 1 mM BME, and pH 7.2 + protease inhibitors and DNase Dilution 80 mM PIPES, 1 mM EGTA, 6 mM MgCl 2 , 50 mM imidazole, 2 mM GTP, 1 mM BME, and pH 7.2 His elution 80 mM PIPES, 1 mM EGTA, 5 mM MgCl 2 , 500 mM imidazole, 2 mM GTP, 1 mM BME, and pH 7.2 Strep binding 80 mM PIPES, 1 mM EGTA, 5 mM MgCl 2 , 2 mM GTP, mM BME, and pH 7.2 Strep elution 80 mM PIPES, 1 mM EGTA, 4 mM MgCl 2 , 2.5 mM D-desthiobiotin, 50 mM imidazole, 2 mM GTP, 1 mM BME, and pH 7.2 Storage 80 mM PIPES, 1 mM EGTA, 1 mM MgCl 2 , 0.2 mM GTP, and pH 6.8 Purification of EB3. Monomeric EB3 used for cryo-EM was purified as previously described ( 8 , 33 ). Human EB3 1–200 was inserted into a 2BT vector with a C-terminal His-tag (Macrolab, University of California, Berkeley [UC Berkeley]) and expressed in BL21(DE3)-RIL Escherichia coli . Cell pellets from a 2-L culture were resuspended in 1:2 (vol/vol) lysis buffer and lysed by sonication. Cell debris was pelleted by centrifugation (18,000 × g, 45 min, 4 °C), and supernatant was loaded on a 5-mL HisTrap column (GE Healthcare) and eluted with a 0 to 100% gradient of lysis buffer to elution buffer. The elution was incubated with TEV protease overnight at 4 °C to remove the His-tag, followed by a subtractive nickel purification to remove TEV, uncleaved EB3, and the His-tag. The flow-through was concentrated to 500 µL and loaded on a Superdex 200 10/300 GL pre-equilibrated in SEC buffer for size-exclusion chromatography. Peak fractions were pooled, concentrated to 20 µM, and flash frozen in SEC buffer until needed ( Table 3 ). mGFP-EB3 used for TIRF microscopy was purified as described ( 21 ). Table 3. Buffers for the purification of monomeric EB3 Lysis 50 mM Tris pH 8.0, 150 mM NaCl, 1 mM EDTA, 1 mM DTT + protease inhibitors, DNase, RNase, and Lysozyme His elution 50 mM Tris pH 8.0, 150 mM NaCl, 1 mM EDTA, 1 mM DTT, and 300 mM imidazole SEC buffer 50 mM Tris pH 8.0, 150 mM NaCl, 1 mM EDTA, 1 mM DTT, and 10% glycerol Purification of Kinesin. The kinesin plasmid was generously supplied by the Vale laboratory ( 35 ) and purified as described previously ( 5 ). The plasmid encoding His 6 -tagged, monomeric, catalytically inactive Kif5b (1 to 350aa, E236A) was transformed into BL21(DE3) cells for expression. Upon reaching optical density (OD) 600 = 0.5, the 1-L expression culture was brought to 22 °C and induced with 0.2 mM IPTG (isopropyl ß-D-1-thiogalactopyranoside) for 16 h. The cells were harvested with by centrifugation at 4,000 g for 20 min at 4 °C. Cell pellets were resuspended in lysis buffer and incubated at room temperature for 30 min followed by sonication (3 × 45 s, at power level 7). The lysate was clarified by centrifugation at 30,000 g for 60 min, and the supernatant was then incubated with Nickel-NTA beads (GE Healthcare). The protein was washed with 6 column volumes of wash buffer and eluted with 2 column volumes of elution buffer. The elution was pooled and loaded onto a size-exclusion column equilibrated with SEC buffer. Fractions were analyzed by SDS-PAGE (sodium dodecyl sulphate–polyacrylamide gel electrophoresis) for kinesin, and peak fractions were pooled and concentrated to 20 µM before flash-freezing in liquid nitrogen until needed ( Table 4 ). Table 4. Buffers for the purification of kinesin Lysis 50 mM NaPO 4 pH 8.0, 300 mM KCl, 2 mM MgCl 2 , 10% glycerol, 10 mM Imidazole, and 1 mM DTT Wash 50 mM NaPO 4 pH 8.0, 150 mM KCl, 2 mM MgCl 2 , 10% glycerol, 30 mM Imidazole, 1 mM DTT, and 200 µM ATP Elution 50 mM NaPO 4 pH 8.0, 150 mM KCl, 2 mM MgCl 2 , 10% glycerol, 250 mM Imidazole, and 1 mM DTT SEC buffer 25 mM Tris pH 7.5, 150 mM KCl, 10% glycerol, 2 mM MgCl 2 , and 2 mM DTT Cryo-EM Sample Preparation. Cryo-EM specimens were prepared on CFlat 1.2/1.3-T open-hole grids (Protochips) that were plasma cleaned for 30 s with a Tergeo plasma cleaner (Pie Scientific). A 10-µL aliquot of tubulin was thawed on ice for 10 min and supplemented with 0.05% Nonidet P-40. The tubulin was incubated at 37 °C for 30 to 40 min to form MTs. While polymerizing, the Vitrobot Mark IV was equilibrated to the following conditions: 37 °C, 100% humidity, 15 blot force, and a 4-s blot with 1-s drain time. In total, 2 µL of MT solution was adsorbed onto the grid for 30 s followed by plunge freezing into a eutectic solution of liquid ethane/propane (70:30). For conditions in which Kinesin or EB3 were used to decorate the MT, two 4-µL aliquots of 20 µM kinesin/EB3 were added to the MT grid with a 30-s wait time in between additions to allow binding. Blotting conditions were identical for all mutants and decorating MT-associated proteins to maintain consistency. Cryo-EM Data Collection. All grids were clipped and loaded into a Gatan Autoloader for imaging with a Titan Krios microscope at the Cal-Cryo EM facility in UC Berkeley. The data were collected with a Gatan Imagine Filter (GIF) energy filter and Gatan K2 or K3 camera (depending on the dataset) operating in superresolution mode. Data collection was controlled by SerialEM ( 36 ). Each micrograph had a total electron exposure of 40e − collected over 40 frames and was collected within a defocus range of 0.8 to 2 µm. Collection parameters for each dataset are reported in SI Appendix , Table S1 . The E254A structure was obtained over two different data collection sessions, because a more-thorough classification was necessary. It should be noted that the same grid was used for both sessions, and there was no bias in the number of the 13-pf 4-start particles (MT segments used in the image processing) for either of the data collections. Cryo-EM Analysis and Model Building. Data processing was done mostly within the RELION framework ( 37 ). Final processing steps that are specific to MTs were performed in FREALIGN, which was necessary for identifying the correct seam location for undecorated MTs ( 38 ). Briefly, MotionCorr 2.1 5 × 5 patch-based alignment was performed on each micrograph ( 39 ). CTFFind4 was used to estimate the defocus of each micrograph ( 40 ). MTs were manually picked within RELION, and short, MT segments (“particles”) were extracted with a repeat length of 82 Å. Initial pf classification was performed with RELION’s Class3D function on bin4 data. Once the helical parameters were classified, particles within the same class (primarily 13 pf) were unbinned, recentered, and re-extracted. Unbinned particles were refined within RELION, and then converted into FREALIGN format for pseudohelical Fourier symmetrization to improve resolution, as well as to carry out SeamSearch protocols ( 29 ) to correctly identify the seam location. Data processing procedures are summarized in SI Appendix , Fig. S2 . Atomic models were built using a previous porcine MT structure as a template (Protein Data Bank: 6dpu), changing the necessary residues to account for the differences between porcine and human tubulins as well as the active site mutations. Each tubulin subunit was rigid-body docked with PHENIX and refined using the real-space refinement program within PHENIX ( 41 , 42 ). All refinements were treated with the same number of iterations to minimize variations in the processing procedure. For the seam analysis ( Fig. 5 ), atomic coordinates were rigid-body docked into both the C1 and pseudo-helical symmetry refined maps. The displacement was calculated using the colorbyrmsd.py script within PyMol (PyMOL Molecular Graphics System, Schrödinger LLC) and then normalized so that all samples were on the same scale from 0 to 1 Å. Colorbyrmsd.py was also used to calculate displacements between various MT states in SI Appendix , Fig. S3 . Determination of the MT Nucleotide Content. The nucleotide content of E254N MTs ( SI Appendix , Fig. S1 B ) was determined by HPLC as described ( 21 ).
TIRF Microscopy
Assay with Recombinant Human Tubulin Mutants. Dynamic MT assays with E254N tubulin were performed as described previously ( 21 , 43 ). In brief, flow chambers were prepared from poly-(L-lysine)-polyethylene glycol (PEG) passivated microscopy slides and biotin-PEG–functionalized coverslips ( 44 ). Chambers were further passivated for 5 min at room temperature with 5% Pluronic F-127 (P2443, Sigma-Aldrich) and extensively washed with assay buffer (80 mM PIPES, 1 mM EGTA, 1 mM MgCl 2 , 30 mM KCl, 1 mM GTP, 5 mM 2-ME, 0.15% [wt/vol] methylcellulose [4000 cP, Sigma-Aldrich], and 1% [w/vol] glucose, pH 6.8), followed by two washes with κ-casein (50 µg/mL in assay buffer, C0406, Sigma-Aldrich) in assay buffer. Neutravidin diluted in the κ-casein solution (50 µg/mL, A2666, Thermo Fisher Scientific) was flowed in, incubated for 3 min at room temperature, and washed out with assay buffer, followed by biotinylated GMPCPP porcine brain MT seeds labeled with CF640R (12% labeling ratio) diluted in assay buffer. After a final wash with assay buffer, the final reaction mix was flowed into the flow chamber. This mix included 98% unlabeled recombinant human E254N tubulin diluted in assay buffer containing oxygen scavengers (180 mg/mL catalase [C40, Merck] and 752 mg/mL glucose oxidase [22778.01, Serva]) and 2% mGFP-EB3 diluted in its storage buffer (50 mM Na-phosphate, 400 mM KCl, 5 mM MgCl 2 , and 0.5 mM 2-ME, pH 7.2) to final concentrations of 12.5 mM E254N tubulin and 5 to 40 nM mGFP-EB3. Directly after sealing, the flow chamber was placed inside the microscope incubator at 30 °C and imaged after 2 to 3 min.
Data with E254A
MTs were recorded previously ( 21 ). In brief, E254A MTs were polymerized from (nonimmobilized) fluorescent, biotinylated, GMPCPP-stabilized porcine brain MT seeds (0.5 µM polymerized tubulin) at 1 µM E254A tubulin for 1 h at 37 °C in BRB80 (80 mM PIPES, 1 mM EGTA, and 1 mM MgCl 2 , pH 6.8) with 1 mM GTP. These stable MTs were stored at room temperature until use. Flow chambers were prepared as above, except that κ-casein was added to the chamber placed on a metal block on ice. Prepolymerized, stable MTs diluted in BRB80 were flowed into the chamber and attached to the neutravidin surface at room temperature. The chambers were then washed and imaged using 98% assay buffer with oxygen scavengers as above and supplemented with 2% mGFP-EB3 diluted in its storage buffer, yielding a final mGFP-EB3 concentration between 5 and 50 nM. TIRF Microscopy Imaging. Dynamic TIRF microscopy assays with E254N tubulin and mGFP-EB3 were performed using a TIRF microscope (Cairn Research, Faversham, United Kingom) ( 43 ) with a 100× oil-immersion objective (Nikon CFI SR Apo, NA = 1.49) for 20 min at 1 frame/5 s with 300-ms exposure times for both MT seeds (using 640-nm laser excitation) and mGFP-EB3 (using 488-nm laser excitation). Several images in different fields of view were acquired 25 min after the initial temperature shift for the measurements of mGFP intensity profiles along the MTs. The data for stable E254A MTs with mGFP-EB3 are from a previous study ( 21 ) and were reanalyzed in detail here. TIRF Microscopy Data Analysis. All images were processed using FIJI (version 1.53c, Research Resource Identifier [RRID]: SCR_002285) ( 45 ). Images were first corrected for uneven illumination using the FIJI rolling ball background subtraction algorithm with a radius of 50 pixels. As necessary, channels were aligned using a custom MATLAB script and reference images from a calibration slide (Argo-HM, Argolight, France). Then, segmented lines (3 pixels wide) were drawn along the longer MT segment elongating from the seed, excluding overlapping MTs. Line intensity profiles were averaged over their width. For each intensity profile, the local background was obtained by shifting the segmented line to the closest region without MTs and subtracted pixel-by-pixel. Background-subtracted intensity profiles were pooled together to generate mGFP-EB3 global intensity distributions and calculate their moments using OriginPro2021 (OriginLab, RRID: SCR_014212). Kymographs from individual E245N MTs were obtained using custom FIJI macros to trace maximum-intensity projections. Periods of constant growth speed were inferred manually for each kymograph and their duration used as weight to calculate the mean E245N MT growth speed for the different mGFP-EB3 concentrations studied. Standard errors on the weighted mean were calculated following standard uncertainty propagation. The different mGFP-EB3 binding patterns to E245N MTs were categorized and quantified manually.
Supplementary Material Supplementary File Supplementary File Supplementary File Supplementary File Supplementary File
📊 Figures
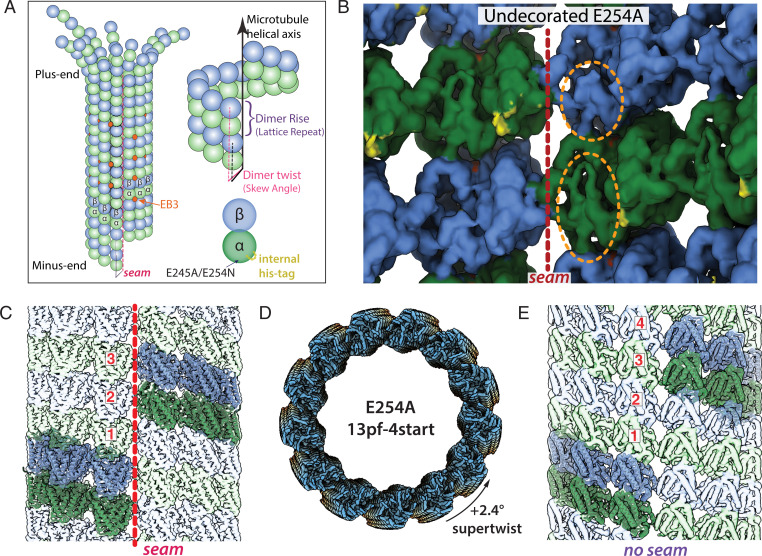
Fig. 1.
Structural characterization of E254A MTs. ( A ) Cartoon diagram of a 13-pf 3-start MT undergoing depolymerization, with u03b1-tubulin in green, u03b2-tubulin in blue, and EB3 in orange (colors maintai...
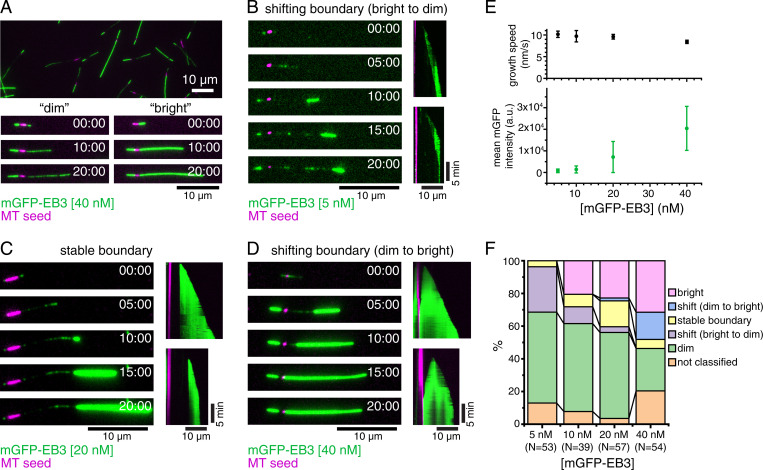
Fig. 2.
Dynamic E254N MTs observed by TIRF microscopy. ( A ) TIRF microscopy image of nonfluorescent E254N MTs after 20 min of growth from CF640R-labeled, GMPCPP-stabilized MT u201cseedsu201d (magenta) in the...
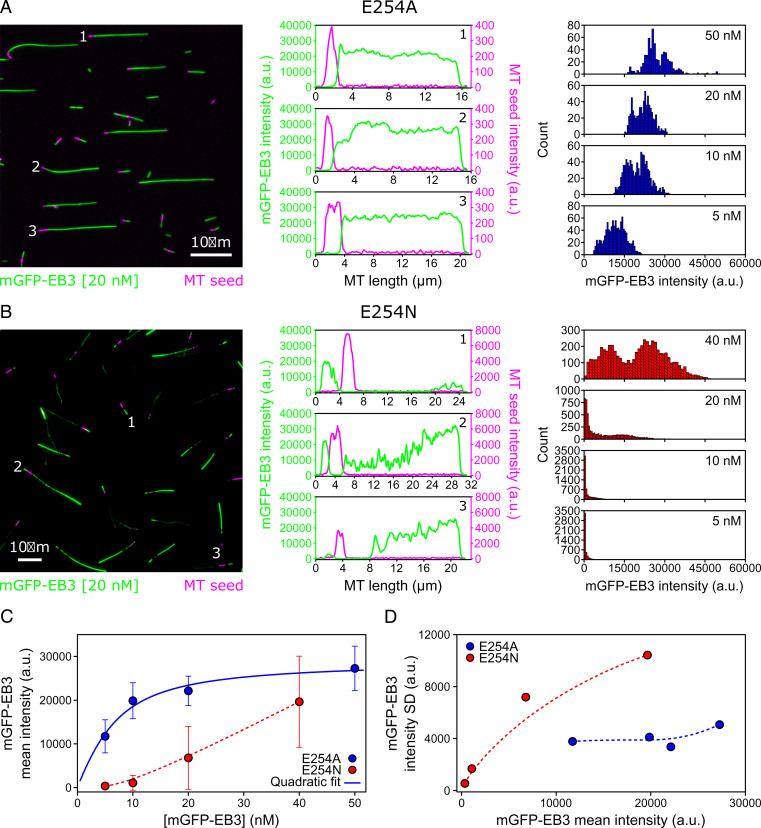
Fig. 3.
Quantitative comparison of mGFP-EB3 binding to E254A and E254N MTs as observed by TIRF microscopy. ( A and B , Left ) TIRF microscopy images of nonfluorescent E254A MTs ( A ) and E254N MTs ( B ) grown...
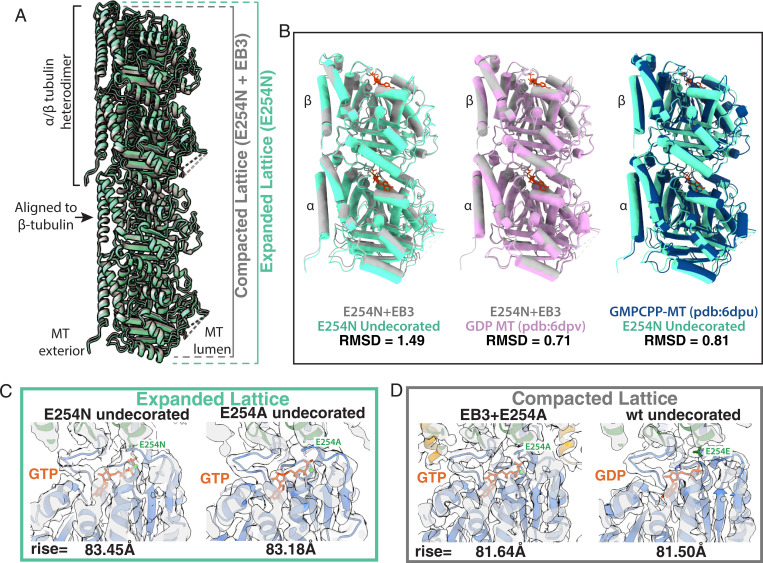
Fig. 4.
GTP state and compaction for wt, E254N, and E254A MTs. ( A ) Visualization of how the MT axial repeat changes, either through hydrolysis of GTP or through EB3 binding to catalytically inactive MTs. Sp...
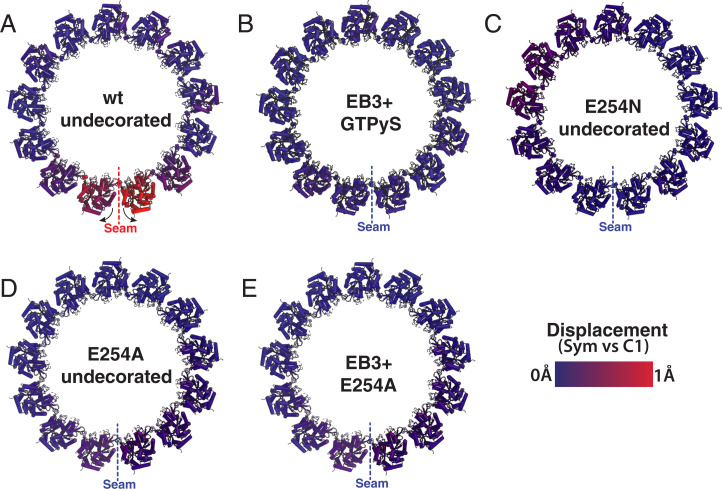
Fig. 5.
Seam opening correlates with GTP hydrolysis and MT instability. The panels correspond to MT cross-sections for both GTP-like and GDP-MTs showing comparison between the symmetrized and C1 maps to illus...
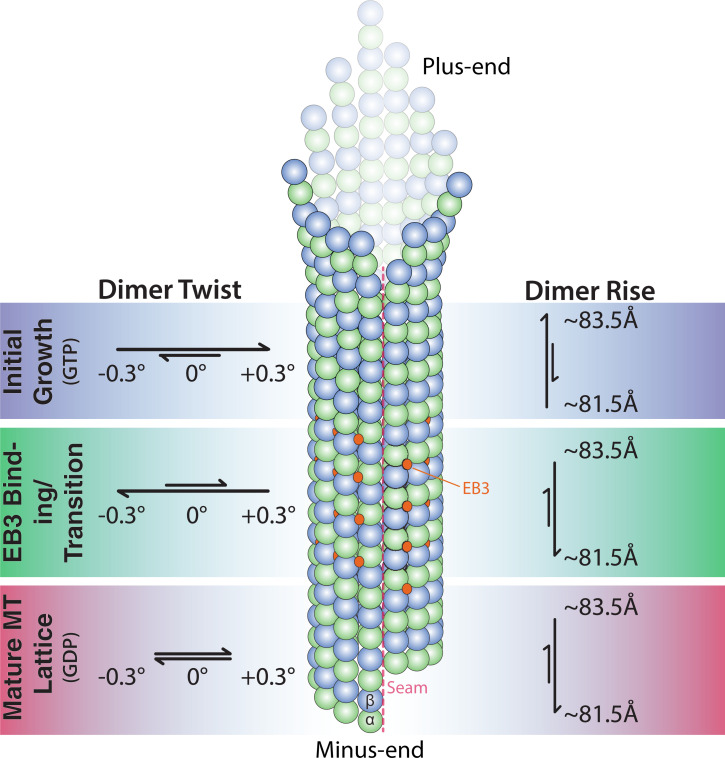
Fig. 6.
Model of MT growth informed by cryo-EM and TIRF microscopy observations.
Figure images are served from the NIH/NLM PubMed Central Open Access Subset or Europe PMC; copyright remains with the publishers and authors.
💬 Discussion
0 commentsNo comments yet. Be the first to start a discussion!
Leave a Comment