Abstract
Tendons attach muscles to bone and thereby transmit tensile forces during joint movement. However, a detailed understanding of the mechanisms that establish the mechanical properties of tendon has remained elusive because of the practical difficulties of studying tissue mechanics in vivo. Here we have performed a study of tendon-like constructs made by culturing embryonic tendon cells in fixed-length fibrin gels. The constructs display mechanical properties (toe-linear-fail stress-strain curve, stiffness, ultimate tensile strength, and failure strain) as well as collagen fibril volume fraction and extracellular matrix (ECM)/cell ratio that are statistically similar to those of embryonic chick metatarsal tendons. The development of mechanical properties during time in culture was abolished when the constructs were treated separately with Triton X-100 (to solubilise membranes), cytochalasin (to disassemble the actin cytoskeleton) and blebbistatin (a small molecule inhibitor of non-muscle myosin II). Importantly, these treatments had no effect on the mechanical properties of the constructs that existed prior to treatment. Live-cell imaging and (14)C-proline metabolic labeling showed that blebbistatin inhibited the contraction of the constructs without affecting cell viability, procollagen synthesis, or conversion of procollagen to collagen. In conclusion, the mechanical properties per se of the tendon constructs are attributable to the ECM generated by the cells but the improvement of mechanical properties during time in culture was dependent on non-muscle myosin II-derived forces.
🔬 Techniques
✨ Fluorophores
🧪 Sample Preparation
🏭 Microscope Brands
🧪 Reagent Suppliers
📷 Detectors
💻 Software Details
🏛️ Research Organizations (ROR)
Affiliated research institutions:
📋 Methods
Cell isolation and tendon-construct formation
Tendon constructs were assembled as previously described ( Kapacee et al., 2008 ). Briefly, day-13 ECMT cells were propagated (not exceeding passage 7) in monolayer in DMEM4 culture medium (Sigma) supplemented with penicillin (100 U/mL), streptomycin (100 μg/mL; Lonza), l-glutamine (2 mM; Lonza), and fetal calf serum (10%; Sigma) until sufficient numbers of cells were available to form constructs. Cells were removed from tissue culture flasks using trypsin–EDTA (Lonza). Each well of a six well plate was lined with 2 mL of Sylgard (type 184 silicone elastomer, Dow Chemical, Midland, MI, USA) and incubated at 55 °C for 15 h to set. Two 0.1 mm minutien pins (Austerlitz, Czech Republic) were each put through one 0.25 cm length of suture (Ethicon) and inserted with a 1 cm gap in the Sylgard. Plates were sterilised by immersion for 1 h in 100% ethanol under UV light. 6.15 × 10 5 cells were suspended in 400 μL of complete medium plus 83 μL of 20 mg/mL fibrinogen and 10 μL of 200 U/mL thrombin (both bovine; Sigma, St. Louis, MO, USA), deposited in each well and incubated at 37 °C, 5% CO 2 . After a 5-min setting time, cell-matrix layers were ‘scored’ with a fine pipette tip to prevent adhesion to the side of the well, then incubated with 5 mL culture medium (as above) supplemented with l-ascorbic acid 2-phosphate (200 μM; Lonza). The gel was scored every two days until, at approximately seven days post seeding, it had contracted to form a linear construct between the pinned sutures. The timepoint of ‘contraction’ was defined as T0.
Show full methods section
Cell isolation and tendon-construct formation
Tendon constructs were assembled as previously described ( Kapacee et al., 2008 ). Briefly, day-13 ECMT cells were propagated (not exceeding passage 7) in monolayer in DMEM4 culture medium (Sigma) supplemented with penicillin (100 U/mL), streptomycin (100 μg/mL; Lonza), l-glutamine (2 mM; Lonza), and fetal calf serum (10%; Sigma) until sufficient numbers of cells were available to form constructs. Cells were removed from tissue culture flasks using trypsin–EDTA (Lonza). Each well of a six well plate was lined with 2 mL of Sylgard (type 184 silicone elastomer, Dow Chemical, Midland, MI, USA) and incubated at 55 °C for 15 h to set. Two 0.1 mm minutien pins (Austerlitz, Czech Republic) were each put through one 0.25 cm length of suture (Ethicon) and inserted with a 1 cm gap in the Sylgard. Plates were sterilised by immersion for 1 h in 100% ethanol under UV light. 6.15 × 10 5 cells were suspended in 400 μL of complete medium plus 83 μL of 20 mg/mL fibrinogen and 10 μL of 200 U/mL thrombin (both bovine; Sigma, St. Louis, MO, USA), deposited in each well and incubated at 37 °C, 5% CO 2 . After a 5-min setting time, cell-matrix layers were ‘scored’ with a fine pipette tip to prevent adhesion to the side of the well, then incubated with 5 mL culture medium (as above) supplemented with l-ascorbic acid 2-phosphate (200 μM; Lonza). The gel was scored every two days until, at approximately seven days post seeding, it had contracted to form a linear construct between the pinned sutures. The timepoint of ‘contraction’ was defined as T0.
Mechanical testing
Constructs were removed from culture at contraction (T0) and 3, 7, 10, 14, 21, 28, 35 and 42 days post-contraction (T3, T7, T10, T12, T21, T28, T35 and T42, respectively). A minimum of ten tendon constructs were tested per time point. Because it was not possible to take histological sections of constructs before mechanical testing (which would damage the tissue) diameters were measured from digital photographs. Construct diameter was then used to calculate transverse area according to the formula πd. This assumed a circular transverse shape, as demonstrated previously from histological sections ( Kapacee et al., 2008 ) and used in mechanical testing of tissue engineered ligament ( Hairfield-Stein et al., 2007 ). An average of three diameter measurements was recorded. Tendon constructs were mounted on a supportive frame of coarse (grade 100) sandpaper using super glue (as performed by McBride et al. (1988) (see Fig. 1 )). The mounting frame was clamped in an Instron 4301 mechanical testing machine fitted with a 100 N load cell (Instron Inc., High Wycombe, UK). The clamps were hand-tightened, and samples were excluded from analysis if they slipped during testing. After clamping, the side-pieces of the frame were cut to prevent stretching or damage of the tendon construct. The original contour length (L O ) of tendon constructs was measured from a digital photograph of the mounted construct (see Fig. 1 ). A tare load of 10 mN was applied at the start of the tensile test to fully straighten the tendon construct. The length at failure was determined from the Instron test (giving change in length L ∆ ). Tendon constructs were tested to failure with a strain rate of 5 mm per minute (equivalent to approximately 1% strain per second). Tensile testing of day-13 ECMT, cut into 1.5 cm lengths, was also performed using this method.
Analysis of output from mechanical tests Instron series
XI software produced a force extension curve from which it was possible to calculate ultimate tensile stress (UTS; MPa; calculated from: maximum force (N) / transverse area (m 2 )), and failure strain (change in length at failure/original length). Elastic modulus (E; MPa) was calculated as the gradient of the linear portion of the stress–strain curve.
Electron microscopy 4.4.1 Tissue fixation and embedding
For ultrastructural analysis a minimum of 2 constructs were examined for each time point (4 samples at T0 and T7 and 3 at T14). Constructs were immersed in primary fixative (100 mM sodium phosphate buffer (pH 7.0) containing 2% glutaraldehyde (Agar Scientific)) for 30 min at room temperature, then cut up into three smaller pieces and placed in fresh primary fixative for 2 h at 4 °C. Samples were transferred to secondary fixative (50 mM sodium phosphate buffer (pH 6.2) containing 2% glutaraldehyde and 1% osmium tetroxide (Agar Scientific)) for 40 min at 4 °C before being thoroughly washed with distilled water and en bloc stained in 1% aqueous uranyl acetate for 16 h at 4 °C. Constructs were dehydrated in graded acetone (30%, 50%, 70%, and 90%) followed by four changes of 100% acetone for 10 min each at room temperature. Samples were treated with propylene oxide for 10 min at room temperature then infiltrated with a mixture of TAAB low viscosity resin (medium hardness; Agar Scientific) and propylene oxide. Samples were put into 50% resin on a rotator overnight at room temperature. The sample was then incubated in 70%, 90% and three changes of 100% resin, each for 1 h at room temperature. Samples were put in resin moulds for polymerization at 60 °C for 24 h.
Sectioning and staining
Ultra-thin sections were taken on a Reichert-Jung Ultracut (Leica Microsystems, UK) ultramicrotome using a diamond knife (Druker International, NL). Sections were stained with 2% uranyl acetate in 70% ethanol for 20 min then washed in distilled water. Sections were counter stained in 0.3% lead citrate in 0.1 M NaOH for 5 min and washed in distilled water. Micrograph capture, sampling technique and ultrastructural measurements Sections were examined using an FEI Tecnai 12 Twin Transmission Electron Microscope (TEM). Images were captured using a 2 k × 2 k cooled CCD camera (F214A, Tietz Video and Image Processing Systems, Gauting, Germany). For each sample a minimum of three different sections were reviewed. A thorough sampling of each section was performed. Three different magnifications were used: 2100× for cell volume fraction (giving a large-area survey), 6800× for fibril volume fraction and 11,000× for fibril diameter. The sampling procedure generated 20 images of each section at 2100×, 40 views per section at 6800× and 60 views per section at 11,000×. This sampling method enabled representative EM quantification of the collagenous matrix. Magnification calibration was performed for each magnification using a diffraction-grating replica grid (2160 lines/mm, Agar Scientific, Stansted, UK). All measurements were made using ImageJ software (NIH freeware, http://rsb.info.nih.gov/nih-image ). Cell volume fraction was calculated from the proportion of the transverse area occupied by cells (total transverse area / cell area). Fibril volume fraction was calculated from the proportion of transverse area occupied by collagenous fibrils (total transverse area / collagen fibril area).
Cell counts and cell-cycle analysis
Three construct samples per timepoint were used for cell counts and 3 samples for cell-cycle analysis. Cell culture medium was removed from tendon constructs and washed twice in PBS. Tendon constructs were digested in 10 mL 0.25% trypsin (Invitrogen) plus 80 mg bacterial collagenase type IV (210 U/mL; Worthington, USA). Digestion was for 1.5 h at 37 °C. Live-cell counts were performed on 10 μL of cell suspension in 40 μL trypan blue solution (Sigma) using a hemocytometer. For cell-cycle analysis, cells were collected by centrifugation (13,000 × g , 5 min), washed in PBS, and resuspended in 500 μL PBS. The cell suspension was mixed with 5 mL 70% −20 °C ethanol and stored at 4 °C, if necessary.
Prior to fluorescence activated cell sorting
(FACS) analysis the cells were collected by centrifugation (13000 × g , 5 min), washed in PBS and then resuspended in 300 μL propridium iodide solution (38 mM sodium citrate pH 7.4; Sigma), treated with 10 μL RNAse solution (20 mg/mL; Invitrogen) and incubated at 37 °C for 30 min. FACS was performed using a CyAn ADP flow cytometry analyser (Beckman Coulter, USA) and processed using Modfit LT software (Verity Software House, USA). Treatment with Triton solution, cytochalasin and blebbistatin Ten constructs per group were used at each timepoint. Triton solution was prepared from 0.5% Triton X-100 solution (Sigma) in 40 mL PBS with 2 protease inhibitor tablets (Sigma). Constructs were washed with PBS twice, incubated with Triton solution for 20 min (2 mL per construct), washed with PBS, and incubated with fresh Triton solution for 20 min. Constructs were washed with PBS, and incubated in the culture medium supplemented with FCS (as above) at 37 °C and 5% CO 2 . In control samples, constructs were treated similarly but without the addition of Triton to the PBS. Two experiments were performed with inhibitors of the actinomyosin complex.
Newly formed constructs
(T0) were incubated for either 2 h or 24 h with either blebbistatin (25 μM, 0.1% v/v dimethylsulfoxide (DMSO); Pfizer, UK) or cytochalasin (10 μM, 0.1% v/v DMSO; Calbiochem, NJ, USA) at 37 °C in 5% CO 2 . Two-hour incubation samples were then taken for mechanical testing immediately, and 24-hour samples examined two days later at T3. Control samples were incubated in 0.1% v/v DMSO. Constructs were also examined post-incubation with Calcein-AM (10 μM for 2 h; Sigma) to detect live cells by light microscopy. Images were collected on a Leica TCS SP2 AOBS inverted confocal microscope using a 20× HCX PL Fluotar objective. The confocal settings were pinhole 1 airy unit, scan speed 1000 Hz unidirectional, format 1024 × 1024. Images were collected using the following detection mirror settings: excitation 496 nm (20%) and emission 500–540 nm.
Molecular biology 4.7.1 Primer sequences
The following primers were used: chicken MYH9 forward primer, ACGCGTACCTCCAGAGAAGA; reverse primer, GGATAGCACAGCTGGAGGAG; chicken MYH10 forward primer, CTGAGGACAAAACGTGAGCA; reverse primer, GAAGTGAAGGTGTTGCAGCA; chicken Col1a1 forward primer, CAGCCGCTTCACCTACAGC; reverse primer, TTTTGTATTCAATCACTGTCTTGCC ( Martin et al., 2001 ); chicken ribosomal 18s forward primer, GTAACCCGTTGAACCCCATT; reverse primer, CTACTACCGATTGGATGG.
RNA isolation from cultured chick tenocytes Total
RNA was extracted from subconfluent (~ 80%) cultures of fibroblasts using TRIzol reagent followed by DNase treatment.
RNA isolation from tendon constructs and RT-PCR
Tendon constructs were rinsed briefly in PBS. TRIzol reagent (Invitrogen, Carlsbad, CA) was added and the tissue rapidly frozen in liquid nitrogen prior to disruption using a Mikro-Dismembrator (Sartorius) (twice at 2000 rpm for 90 s). RNAs were extracted from the tissue following the manufacturer's instructions (Invitrogen, Carlsbad, CA) followed by DNase treatment. cDNA was transcribed from 2 μg of RNA with TaqMan reverse transcriptase (RT) polymerase (Applied Biosystems), using an oligo(dT)16 primer. RT-PCR analysis was performed on mRNAs by using 20-mer primers complementary to MYH9, MYH10, col1a1 and ribosomal 18s from the chick. Amplification of the correctly sized products was verified by electrophoresis on a 2% Tris–borate–EDTA gel. The identities of the product were confirmed by DNA sequencing.
Sequencing of RT-PCR fragments
PCR products (5 ng) were sequenced using a BigDye Terminator v3.1 cycle sequencing kit (Applied Biosystems). Samples were placed in a thermal cycler under the following conditions: initial denaturation was performed at 96 °C for 1 min, followed by 25 cycles of 96 °C for 10 s, 50 °C for 5 s, and 60 °C for 4 min. Samples were precipitated with ethanol–sodium acetate prior to analysis.
Quantitative PCR
RNA was extracted and cDNA synthesized as described above. A total of 50 ng cDNA was loaded per qPCR well. Quantitative RT-PCR was performed using Chromo4 (BioRad) with SYBR Green (Eurogentec). Output was analysed using Opticon monitor 3 software (BioRad). Results were normalized to ribosomal 18s and four samples were used for each time point ( Schmittgen and Livak, 2008 ).
Western blot analyses
Total protein was extracted from tendon constructs by incubation in RIPA buffer overnight on a shaker at 4 °C. Protein extracts were examined by standard western blot procedures and optimal antibody dilutions determined empirically. Anti-MHY10 antibodies (clone CMII 23) were obtained from Developmental Studies, Hybridoma Bank, University of Iowa. Collagen 14 C-proline labeling Continuous labeling experiments were performed at 37 °C in DMEM4 containing 1% (vol/vol) PS, 2 mM l-glutamine, 200 μM ascorbate, and 400 μM βAPN, and supplemented with 2.5 μCi/mL of 14 C-proline and 25 μM blebbistatin as required. Labeling was stopped by transferring the tendons to 25 mM EDTA, and 50 mM Tris–HCl, pH 7.5, at 4 °C. Tendon constructs subjected to continuous labeling analysis in 1 mL aliquots of the supplemented medium were extracted in 100 μL aliquots of salt extraction buffer (1 M NaCl, 25 mM EDTA, and 50 mM Tris–HCl, pH 7.4) containing protease inhibitors and supplemented as required with 1% NP-40 detergent as previously described ( Canty et al., 2004, 2006 ). Tendon constructs were extracted in four changes of salt extraction buffer: overnight (S1), 6 h (S2), overnight (S3), 6 h (S4), and an overnight in NaCl extraction buffer containing NP-40 (N). Extracts were analysed on 4% precast SDS polyacrylamide gels (Invitrogen) under reducing conditions. The gels were fixed in 10% methanol and 10% acetic acid, dried under vacuum, and exposed to a phosphorimaging plate (Fuji BAS-III or BAS-MS). After overnight exposure the phosphorimaging plates were processed using a phosphorimager (Fuji BAS 2000 or 1800).
Live-cell imaging of constructs
Tendon constructs at T6 were treated with either 0.1% DMSO, 10 μM cytochalasin or 25 μM blebbistatin and imaged using an AS MDW live-cell imaging system (Leica) with a 20×/0.5 HC Plan Fluotar objective. Point visiting was used to allow multiple positions to be imaged within the same time-course and cells were maintained at 37 °C and 5% CO 2 . Images were collected every 5 min for 12 h using a Cascade II EM CCD camera for ultra sensitive imaging (Photometrics). Cell tracking was performed using the Particle Analysis manual tracking plugin for ImageJ.
Statistical analysis
Statistical analysis was performed using SPSS version 14.
Mechanical data
(UTS, modulus and failure strain) and ultrastructural data (fibril diameter, cell volume fraction and fibril volume fraction) were examined using 1-way ANOVA. Quantitative PCR data was examined using the Wilcoxon two group test. Significance was set at the p < 0.05 level. Data are presented as mean ± standard error of the mean unless otherwise stated. The following are the supplementary materials related to this article. Supplementary File 1 Supplementary File 2 Supplementary File 3
📊 Figures
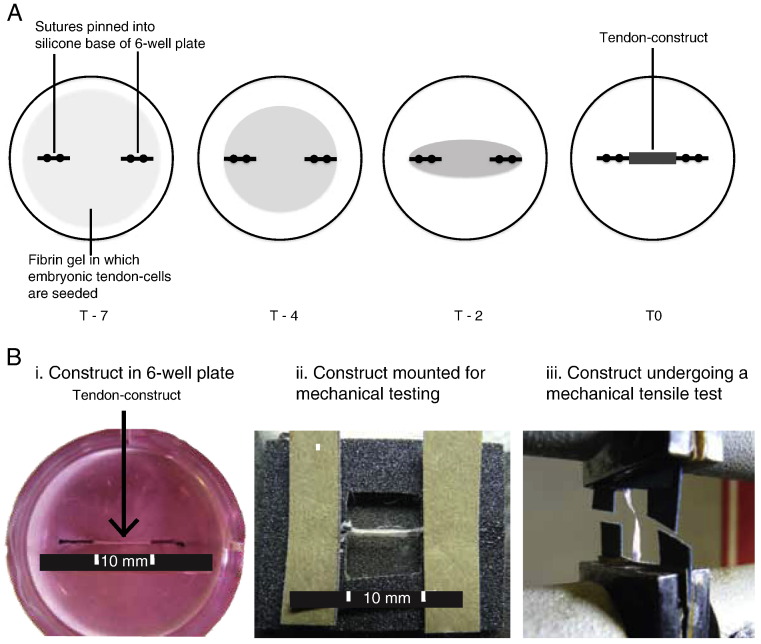
Fig.u00a01
Tendon construct formation and mechanical testing. (A) Schematic representation of the formation of a tendon construct. From left to right, during 7u00a0days in culture, cells contract the fibrin gel,...
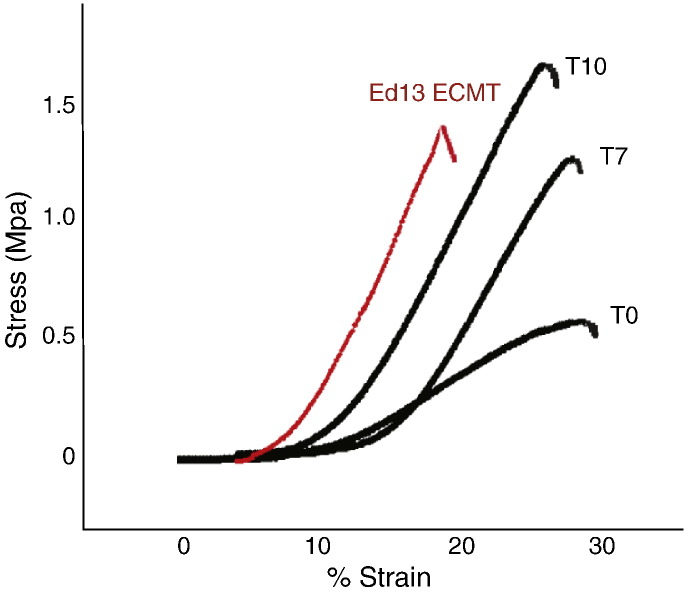
Fig.u00a02
Typical stressu2013strain curves for T0, T7 and T10 tendon constructs shown in comparison with data from 13-day ECMT. All curves show the distinct regions (toe, linear and failure) characteristic of t...
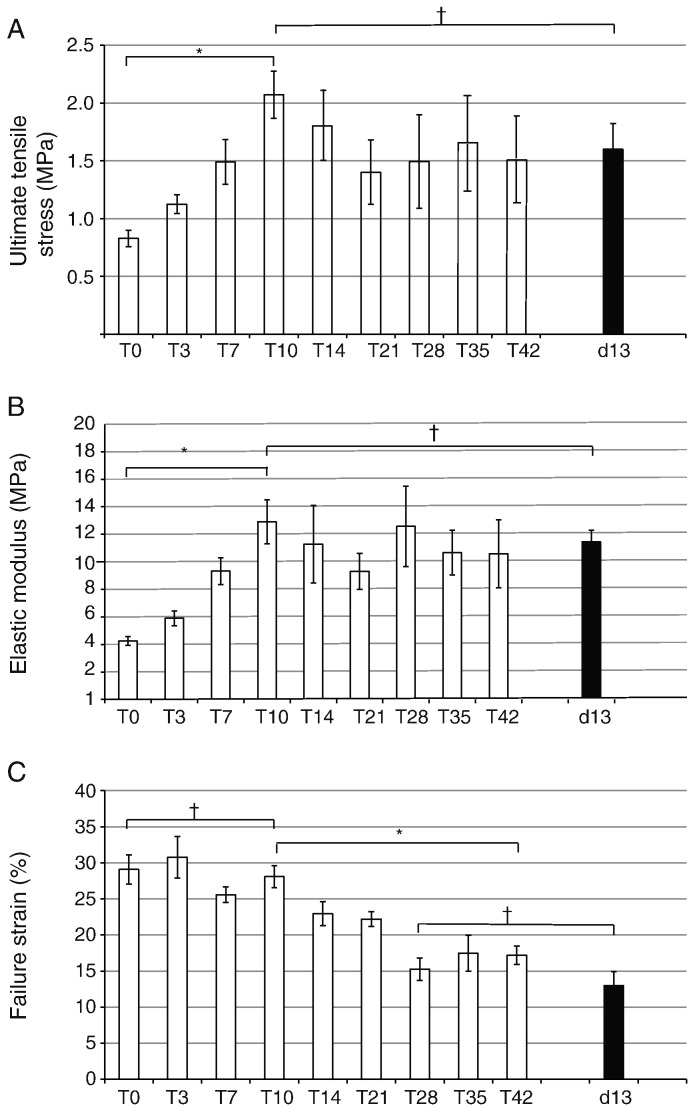
Fig.u00a03
Summary of data for the mechanical properties of tendon constructs (from T0 to T42) shown compared with the corresponding data on 13-day ECMT. (A) The ultimate tensile stress (UTS) of tendon construct...
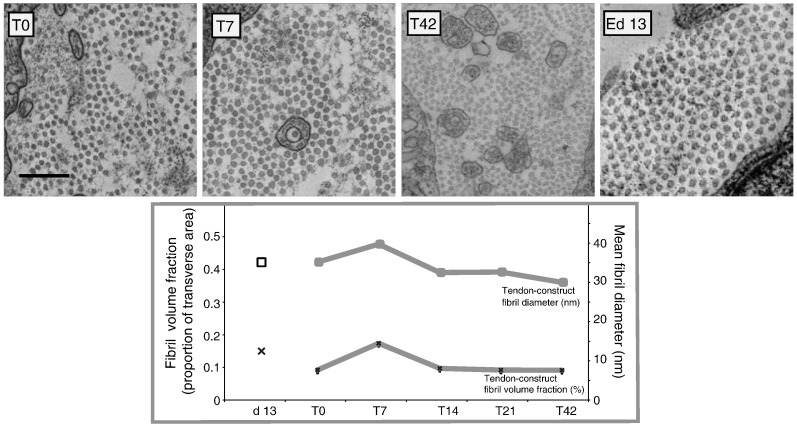
Fig.u00a04
Transmission electron microscopy of tendon constructs and embryonic chick metatarsal tendon (ECMT). Typical images of transverse sections of tendon constructs at T0 (A), T7 (B) and T42 (C) and 13-day ...
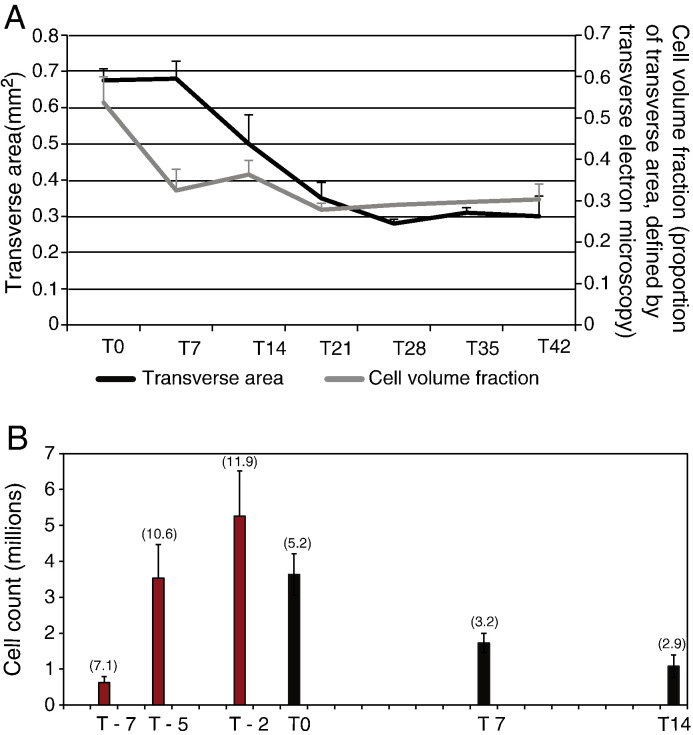
Fig.u00a05
Comparison of construct transverse area, cell volume fraction and cell number. (A) Plots of transverse area and cell volume fraction for the tendon construct as a function of days in culture. The cons...
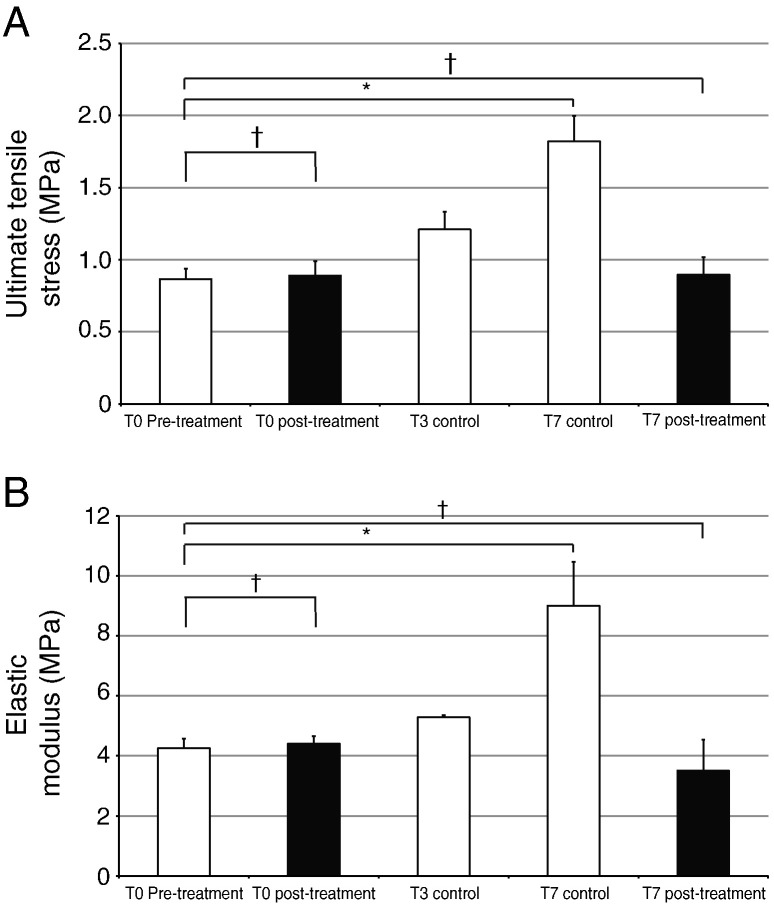
Fig.u00a06
Triton X-100 treatment of T0 tendon constructs arrests development of mechanical properties. (A) Ultimate tensile stress (UTS) of the control tendon constructs increased 2-fold during T0 to T7. In con...
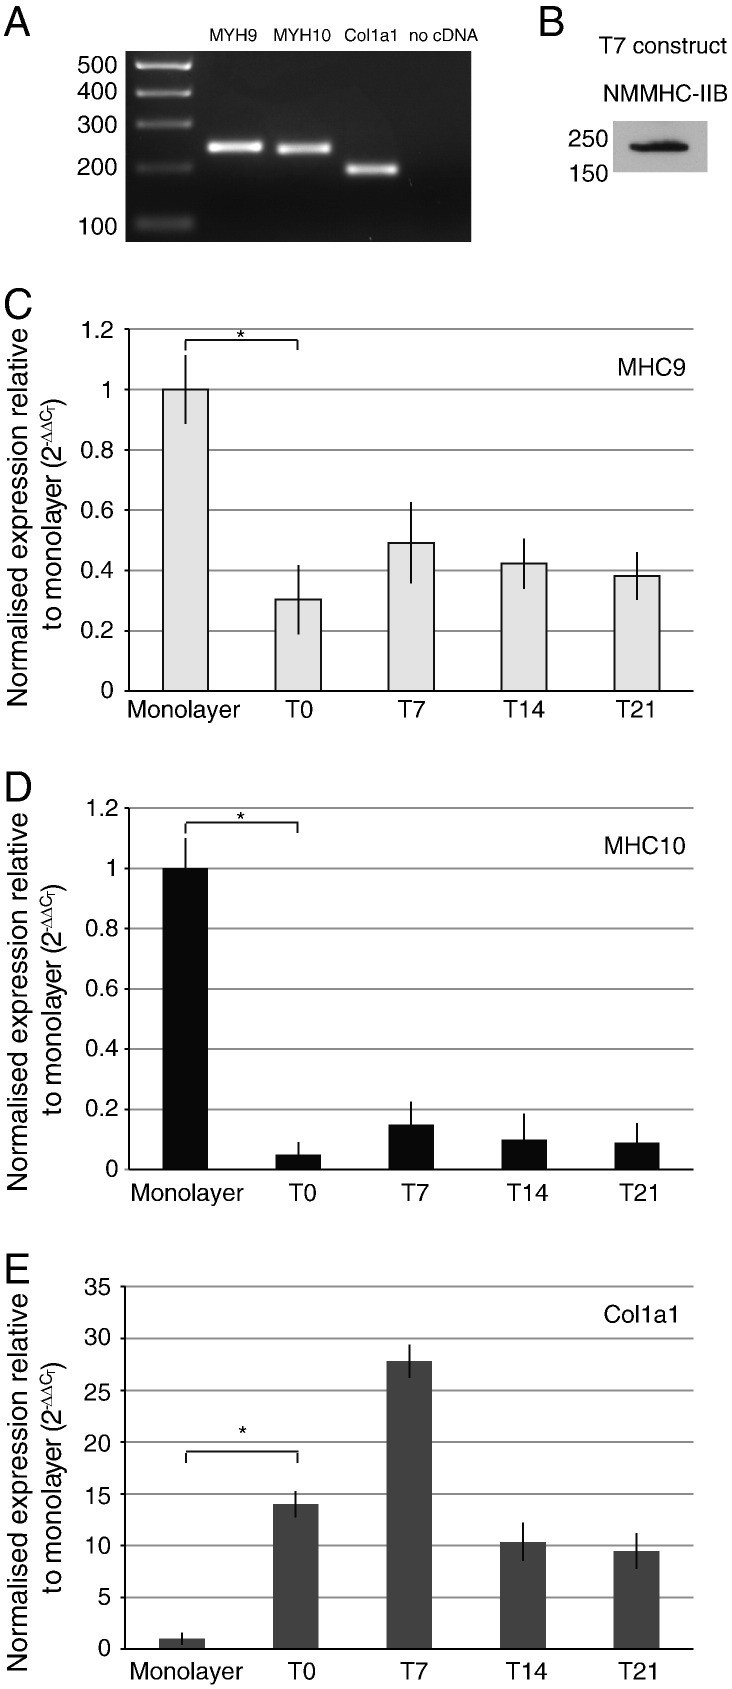
Fig.u00a07
Expression of non-muscle MYH9 and MYH10 by cells in tendon constructs. (A) PCR gel electrophoresis analysis of MYH9 and MYH10 and col1a1 gene expression. (B) Western blot for NMMHC-IIB protein. (C, D,...
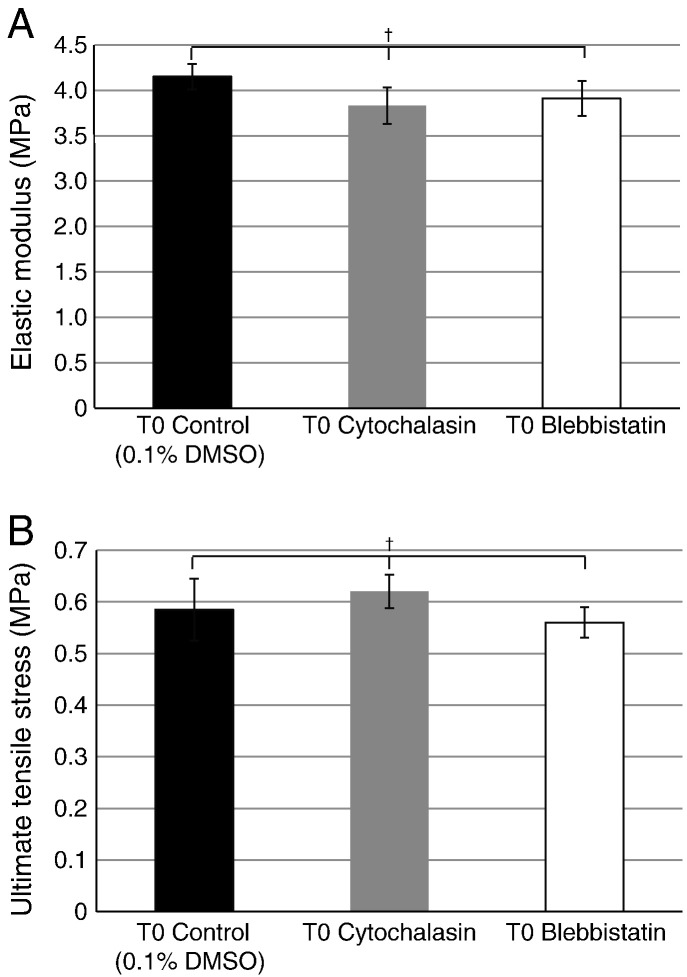
Fig.u00a08
The effect of cytochalasin and blebbistatin treatment on the mechanical properties of tendon constructs at T0. Two-hour incubation with either cytochalasin or blebbistatin was immediately followed by ...
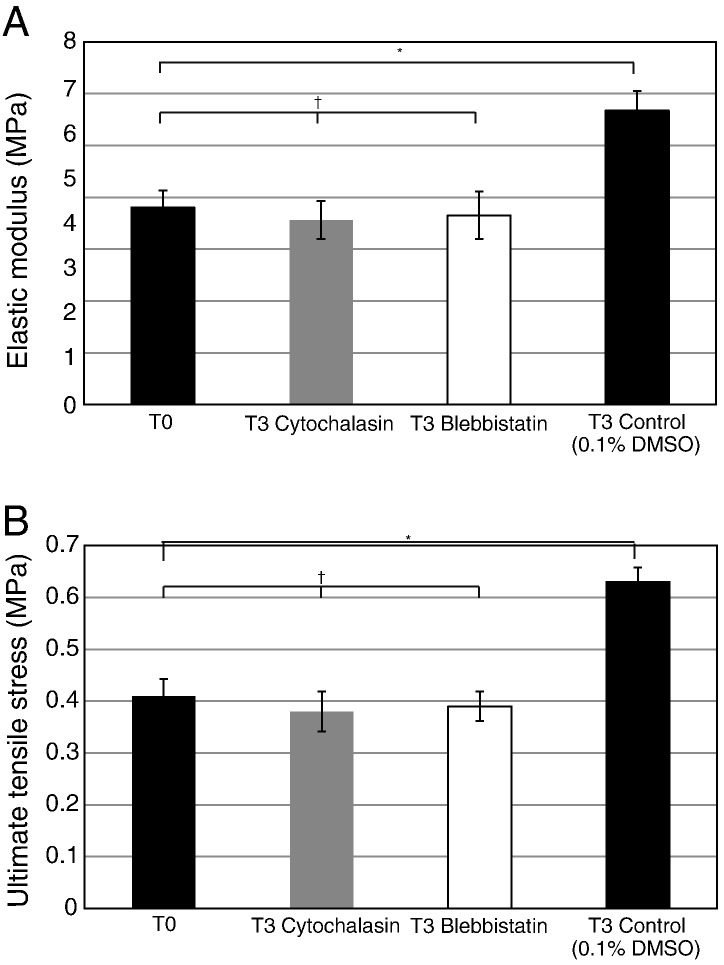
Fig.u00a09
The effects of cytochalasin and blebbistatin on the development of mechanical properties of tendon constructs. T0 tendon constructs were incubated separately with cytochalasin and blebbistatin for 24u...
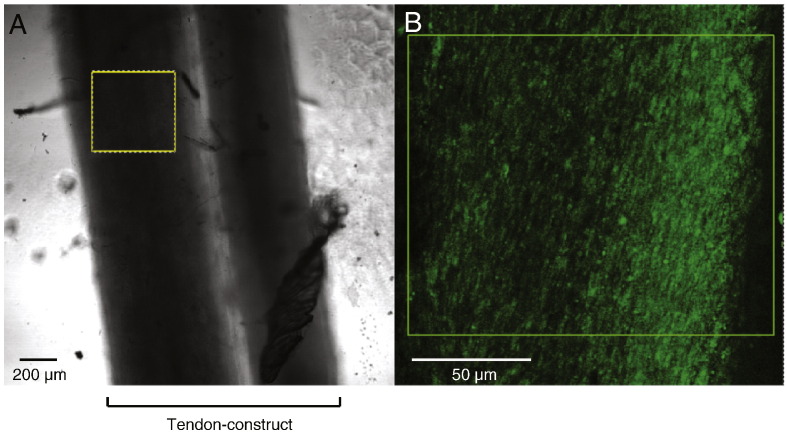
Fig.u00a010
Demonstration of live cells post-treatment with blebbistatin. After 24-hour incubation with blebbistatin constructs were stained with calcein-AM. (A) A transmitted light image of a construct. (B) Conf...
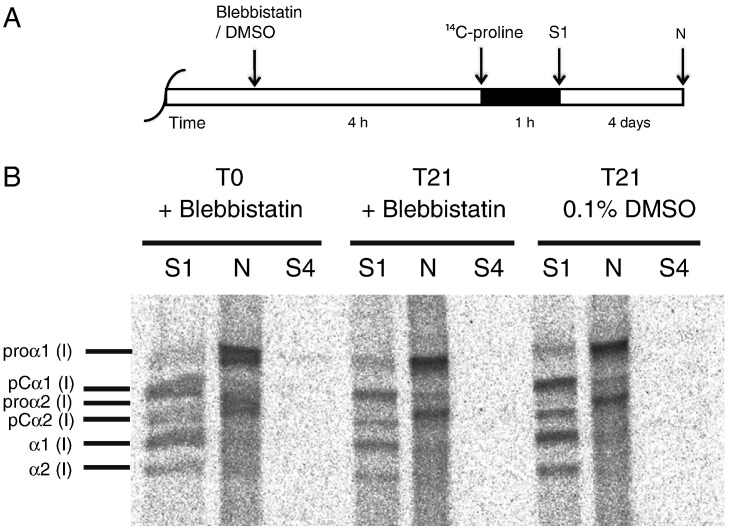
Fig.u00a011
Continuous labeling with 14 C-proline. (A) Tendon constructs (at T0 or at T21) were treated with either blebbistatin or 0.1% DMSO for 4u00a0h and then 14 C-proline was added for a further 1u00a0h. Pro...
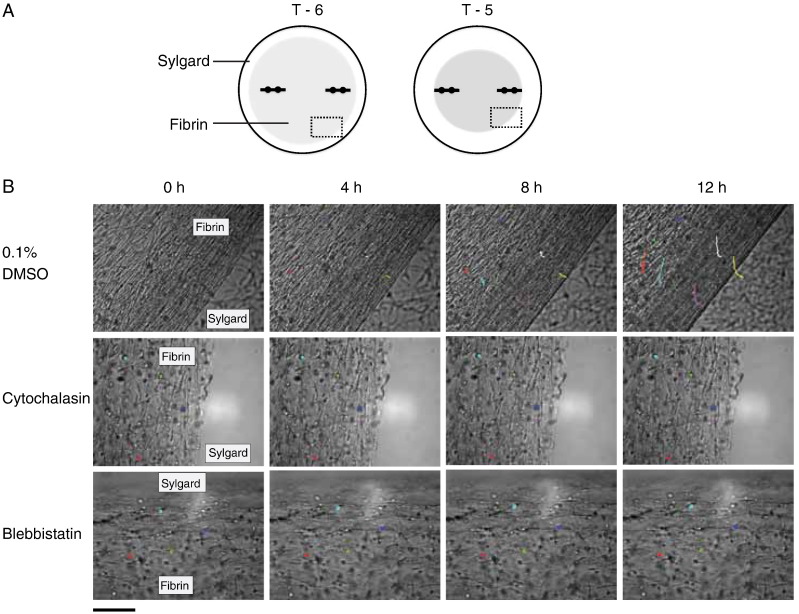
Fig.u00a012
Live-cell imaging of cells in tendon constructs. Cells seeded in fibrin gels at T6 were treated with either DMSO, blebbistatin, or cytochalasin and imaged for 12u00a0h at 5-min intervals. (A) Schemati...
Figure images are served from the NIH/NLM PubMed Central Open Access Subset or Europe PMC; copyright remains with the publishers and authors.
💬 Discussion
0 commentsNo comments yet. Be the first to start a discussion!
Leave a Comment