Abstract
Abstract Background Most odors are perceived to have the same quality over a large concentration range, but the neural mechanisms that permit concentration-invariant olfactory perception are unknown. In larvae of the vinegar fly Drosophila melanogaster , odors are sensed by an array of 25 odorant receptors expressed in 21 olfactory sensory neurons (OSNs). We investigated how subsets of larval OSNs with overlapping but distinct response properties cooperate to mediate perception of a given odorant across a range of concentrations. Results Using calcium imaging, we found that ethyl butyrate, an ester perceived by humans as fruity, activated three OSNs with response thresholds that varied across three orders of magnitude. Whereas wild-type larvae were strongly attracted by this odor across a 500-fold range of concentration, individuals with only a single functional OSN showed attraction across a narrower concentration range corresponding to the sensitivity of each ethyl butyrate-tuned OSN. To clarify how the information carried by different OSNs is integrated by the olfactory system, we characterized the response properties of local inhibitory interneurons and projection neurons in the antennal lobe. Local interneurons only responded to high ethyl butyrate concentrations upon summed activation of at least two OSNs. Projection neurons showed a reduced response to odors when summed input from two OSNs impinged on the circuit compared to when there was only a single functional OSN. Conclusions Our results show that increasing odor concentrations induce progressive activation of concentration-tuned olfactory sensory neurons and concomitant recruitment of inhibitory local interneurons. We propose that the interplay of combinatorial OSN input and local interneuron activation allows animals to remain sensitive to odors across a large range of stimulus intensities.
🔬 Techniques
🔭 Microscopes
🧬 Organisms
💻 Software
✨ Fluorophores
🧪 Sample Preparation
🏭 Microscope Brands
🧪 Reagent Suppliers
💻 Software Details
💾 Data Repositories
🏛️ Research Organizations (ROR)
Affiliated research institutions:
📋 Methods
Drosophila strains Larvae ( D. melanogaster ) were raised on standard medium at 18°C. Genotypes and sources of strains used in this work are: UAS-G-CaMP1.3 on the X chromosome [ 10 ] and UAS-G-CaMP1.3 on III chromosome (from A Wong and R Axel); UAS-G-CaMP1.6 [ 57 ] (from J Nakai via A Fiala); OR-Gal4 lines [ 22 , 58 ]; Or83b 1 , Or83b 2 , UAS- Or83b [ 35 ]; LN1-Gal4 and LN2-Gal4 [ 40 ]; GH146 [ 59 ] and GH298 [ 59 ] (from R Stocker); Or42a -nsyb:tdTomato (described below); Krasavietz-Gal4 [ 39 ] (from J Dubnau). All genotypes and strains used in this paper are listed in Additional data file 1. Only female larvae were used for imaging. Thus, flies for OSN imaging carried eight independent insertions of UAS-G-CaMP1.3. For LN and PN imaging, we used a newer version of G-CaMP (1.6) that is about 40 times brighter and more photostable than G-CaMP1.3 [ 57 ], because G-CaMP1.3 provided insufficient signal-to-noise resolution for LN and PN imaging. pUAST-G-CaMP1.6 [ 57 ] was provided by A Fiala and used to generate transgenic strains by standard methods. Two copies of UAS-G-CaMP1.6 on the X chromosome were sufficient to image LNs and PNs. Or35a - Or83b , Or42a - Or83b and Or42b - Or83b were constructed by first subcloning the Or83b cDNA coding sequence into pCasPeR-AUG-Gal4-X [ 60 ], and subsequently inserting the promoter of Or35a , Or42a or Or42b [ 22 , 58 ] upstream of the Or83b coding sequence. These insertions were used to create Or35a , Or42a , Or42b and Or42a + Or42b OSN functional larvae for PN and LN2 imaging. Or42a -nsyb:tdTomato was constructed by first fusing the first 549 base pairs of Drosophila n-synaptobrevin coding sequence [ 61 ] and the entire tdTomato coding sequence derived from pRSETB-tdTomato [ 62 ] (from R Tsien) and subcloning the fused sequence into pCasPeR-AUG-GAL4-X [ 60 ], such that the Or42a promoter [ 58 ] was inserted upstream of the nsyb:tdTomato coding sequence. OR-Gal4 lines inserted on the second chromosome [ 22 , 58 ] were used to express G-CaMP in specific OSNs. As described elsewhere [ 22 ], larvae with a single or a pair of functional OSNs were engineered by restoring the expression of Or83b with OrX -Gal4 and UAS- Or83b transgenes in an Or83b -null background [ 35 ].
Show full methods section
Drosophila strains Larvae ( D. melanogaster ) were raised on standard medium at 18°C. Genotypes and sources of strains used in this work are: UAS-G-CaMP1.3 on the X chromosome [ 10 ] and UAS-G-CaMP1.3 on III chromosome (from A Wong and R Axel); UAS-G-CaMP1.6 [ 57 ] (from J Nakai via A Fiala); OR-Gal4 lines [ 22 , 58 ]; Or83b 1 , Or83b 2 , UAS- Or83b [ 35 ]; LN1-Gal4 and LN2-Gal4 [ 40 ]; GH146 [ 59 ] and GH298 [ 59 ] (from R Stocker); Or42a -nsyb:tdTomato (described below); Krasavietz-Gal4 [ 39 ] (from J Dubnau). All genotypes and strains used in this paper are listed in Additional data file 1. Only female larvae were used for imaging. Thus, flies for OSN imaging carried eight independent insertions of UAS-G-CaMP1.3. For LN and PN imaging, we used a newer version of G-CaMP (1.6) that is about 40 times brighter and more photostable than G-CaMP1.3 [ 57 ], because G-CaMP1.3 provided insufficient signal-to-noise resolution for LN and PN imaging. pUAST-G-CaMP1.6 [ 57 ] was provided by A Fiala and used to generate transgenic strains by standard methods. Two copies of UAS-G-CaMP1.6 on the X chromosome were sufficient to image LNs and PNs. Or35a - Or83b , Or42a - Or83b and Or42b - Or83b were constructed by first subcloning the Or83b cDNA coding sequence into pCasPeR-AUG-Gal4-X [ 60 ], and subsequently inserting the promoter of Or35a , Or42a or Or42b [ 22 , 58 ] upstream of the Or83b coding sequence. These insertions were used to create Or35a , Or42a , Or42b and Or42a + Or42b OSN functional larvae for PN and LN2 imaging. Or42a -nsyb:tdTomato was constructed by first fusing the first 549 base pairs of Drosophila n-synaptobrevin coding sequence [ 61 ] and the entire tdTomato coding sequence derived from pRSETB-tdTomato [ 62 ] (from R Tsien) and subcloning the fused sequence into pCasPeR-AUG-GAL4-X [ 60 ], such that the Or42a promoter [ 58 ] was inserted upstream of the nsyb:tdTomato coding sequence. OR-Gal4 lines inserted on the second chromosome [ 22 , 58 ] were used to express G-CaMP in specific OSNs. As described elsewhere [ 22 ], larvae with a single or a pair of functional OSNs were engineered by restoring the expression of Or83b with OrX -Gal4 and UAS- Or83b transgenes in an Or83b -null background [ 35 ].
Calcium imaging
Calcium imaging was performed with an Eclipse E600FN microscope (Nikon Instruments) with a 60× water immersion lens using software (TILL VisION; TILL Photonics, Inc.) and instrumentation previously described [ 40 ]. Adult hemolymph-like (AHL) saline [ 10 ] was used for all imaging experiments. Female feeding third instar larvae were rinsed in 1× PBS and transferred to chilled AHL saline for dissection. The larval head was removed, and fat body, salivary gland, and the digestive system posterior to the proven-triculus were removed. The preparation was inserted into a hole punched through a western blot vinyl membrane glued to a 24 mm × 20 mm plastic cover slip (HybriSlip, Grace Bio-Labs), with the head facing down and the brain facing up. Low melting agarose (1.5%; Type IX-A, Sigma-Aldrich) in AHL was applied to the brain side of the preparation and the sample was chilled for 3 minutes at 4°C. Samples were then transferred to the imaging microscope, and saline was applied on top of the agarose layer. Although peristaltic motion of the head and stable odor-evoked responses in each sample were typically obtained for up to 3 h, each sample preparation was imaged for only 1 h. Odors were obtained from Sigma-Aldrich or Fluka at high purity and were diluted in paraffin oil. Odor concentrations for imaging are indicated as dilutions of odor in paraffin oil (v:v, hence (Volume of odor)/(Volume of paraffin oil)). For example, 10 -2 dilution indicates that one volume of an odor is diluted with 100 volumes of paraffin oil. Fresh dilutions were prepared monthly. Common names and Chemical Abstracts Service (CAS) numbers are: geranyl acetate (105-87-3), ethyl acetate (141-78-6), ethyl butyrate (105-54-4), isoamyl acetate (123-92-2), pentyl acetate (628-63-7), hexyl acetate (142-92-7), octyl acetate (112-14-1), 1-Hexanol (111-27-3), 1-Octen-3-ol (3391-86-4), isoamyl alcohol (123-51-3), cyclohexanol (108-93-0), 2-Phenyl ethanol (60-12-8), 2-Heptanone (110-43-0), cyclohexanone (108-94-1), E2-Hexenal (6728-26-3), octanal (124-13-0), acetophenone (98-86-2), anisole (100-66-3), methyl salicylate (119-36-8), 4-Methyl phenol (106-44-5), acetyl furan (1192-62-7), and propyl sulfide (111-47-7). Ten microliters of diluted odor solution was applied to a 0.25-inch filter paper (Whatman) inside a 1 ml plastic syringe (Becton-Dickinson) attached to Nalgene 890 PTFE FEP tubing (1/8 inch; Fisher Scientific) connected to a switching solenoid valve (The Lee Co.). The valve was controlled by a BPS-4 valve control box (ALA Scientific Instruments) via computer and alternated between clean air flow and the odor syringe. The tip of the odor syringe was positioned about 1 cm away from the sample. To avoid contamination, the tubing directly connecting an odor syringe was replaced after each use, an odor syringe was not used more than three times, and air around the samples was continually removed by ventilation. Charcoal-filtered and humidified air was adjusted to a flow rate of 1000 ml/minute with a flowmeter (Gilmont Instruments). Each odor, at intervals of approximately 100 s, was applied only once unless the sample moved out of the square region of interest (typically 9 × 9 pixels) during the experiment, according to the following protocol for OSNs: 3 s pre-stimulus, 1 s odor stimulus, and 8 s post-stimulus. For PNs and LNs, the protocol was 6 s pre-stimulus, 1 s odor stimulus, and 8 s post-stimulus. The order of the odors to be tested was randomly determined for each sample and saline was replaced every 15 minutes. Images were acquired at five frames per second at an exposure time of 50 ms and a resolution of 72 × 72 pixels (binned 8 × 8) for OSNs and 96 × 96 pixels (binned 8 × 8) for PNs and LNs. Samples were excluded from analysis if responses to reference odors inserted during and at the end of each imaging experiment showed deterioration in response magnitude or onset. Calcium-imaging data were analyzed by a custom program in IDL (ITT Visual Information Solutions, written and provided by CG Galizia and M Ditzen). Samples that showed excessive movement were discarded, and the rest underwent movement correction if necessary by shifting each frame so that a region of interest was situated on the same coordinate throughout the imaging experiment. The fluorescence value was then calculated by averaging the fluorescence intensity within the region of interest for each OSN in each frame (designated as F n for the nth frame). The relative change in fluorescence, or Δ F / F , for an OSN was then calculated as follows: ( Δ F F ) n = ( F n − ∑ i = 10 14 F i 5 ) / ∑ i = 10 14 F i 5 For PNs and LNs, Δ F / F was calculated as follows: ( Δ F F ) n = ( F n − ∑ i = 25 29 F i 5 ) / ∑ i = 25 29 F i 5 In both cases, (Δ F / F ) n is thus defined as fluorescence intensity relative to the average fluorescence intensity during 1 s immediately before the onset of odor stimulation. The first 1 s of OSN imaging and the first 4 s of PN and LN imaging were excluded from the false color-coded plots as bleaching of fluorescence was significant. No correction was made for bleaching thereafter, as odor-evoked responses were strong despite bleaching. We noticed a consistent mechanical artifact in imaging PNs in Or35a -functional animals, which we believe is due to the sensitivity of these cells to mechanical stimulation by changes in air flow. The time courses of Δ F / F were converted to false color-coded plots using Matlab (The Mathworks). Response delays in the imaging data were not corrected. The only criterion we applied to an imaged sample is that the onset of response to a reference odor (for example, ethyl butyrate for the Or42a OSN) must fall within 200 ms after odor application. We discovered empirically that samples showing delayed responses often became unresponsive to odors after 10–15 minutes rather than the 1–3 h timeframe found for good samples. Accordingly, samples showing greater than 200 ms latency in response to reference odor were discarded from further experiments. Subtle differences in odor onset can be seen in our data set (Additional data file 1 (Figure S1: 4-Methyl phenol stimulation of Or1a , Or45b , and Or83a )), but given the low temporal resolution of calcium imaging, we have not emphasized these possible latency differences in our paper. The half-maximal effective concentrations for ethyl butyrate to activate a given OSN (EC 50 values) were calculated from calcium-imaging data in wild-type (Figure 2b ) and single-OSN-functional animals (Additional data file 1 (Figure S2)). Response values at a given odor concentration were obtained by integrating the Δ F / F value for 1 s after odor onset and EC 50 values were calculated from these data using Prism (GraphPad Software) to fit the data to the Hill equation. EC 50 values (95% confidence interval) are as follows: Or35a wild-type: 1.1 × 10 -2 -2.2 × 10 -3 Or35a -functional: 1.2 × 10 -2 -3.9 × 10 -3 Or42a wild-type: 1.3 × 10 -3 -6.3 × 10 -4 Or42a -functional: 8.4 × 10 -4 -3.1 × 10 -4 Or42b wild-type: 7.9 × 10 -5 -2.6 × 10 -5 Or42b -functional: 1.3 × 10 -4 -3.9 × 10 -5 Because the 95% confidence intervals overlap, the sensitivity to ethyl butyrate does not differ statistically between wild-type and OrX -functional OSNs ( p > 0.05). The same EC 50 calculations were carried out for imaging at PN terminals with the exception that response values at a given odor concentration were obtained by integrating the Δ F / F value for 1 s. PN response durations are much shorter than those for OSNs (compare Figures 2b and 5e ). EC 50 values, displayed as 95% confidence intervals, are as follows: Or35a 5.3 × 10 -3 -2.6 × 10 -2 Or42a 1.4 × 10 -4 -4.2 × 10 -4 Or42b (subdomain 1) 5.1 × 10 -5 -1.7 × 10 -4 Or42b (subdomain 2) 4.6 × 10 -5 -2.6 × 10 -4 Larval behavior Single and multiple odor source devices (Figures 3a and 4a ) were constructed as previously described [ 26 ]. The concentration of ethyl butyrate was measured in gas phase by integrating infrared (IR) light absorbance along sections of the arena at a rate of one per minute and at wave number 1,758 cm -1 . Absolute odor concentration was calculated from the Beer-Lambert law. The molar extinction coefficient of ethyl butyrate was determined in gas phase with a standard gas-flow cell: ε ethyl butyrate = 315 M -1 cm -1 . Odor dilutions were prepared in paraffin oil using a digital scale to measure the amounts of solvent and odor mixed in each dilution [ 29 ]. Using IR spectroscopy, the concentration of a representative subset of odor dilutions was systematically controlled in liquid phase (data not shown). All odor sources had a volume of 10 μl. Odor-evoked behavior of single larvae was monitored and quantified as previously described [ 26 ]. Approximately 30 s after odor source loading, a single larva was introduced under the source (single odor source assay) or at the low concentration end of the odorant line (multiple odor source assay). For the single odor source assay, recordings lasted 5 minutes unless the animal contacted any walls of the arena. Fifteen individuals were tested for each genotype and source concentration (Figure 3 ), and each animal was tested in a fresh arena. For the multiple odor source assay, recordings lasted a maximum of 3 minutes and were stopped as soon as the animals reached the highest odor concentration. Twenty to thirty individuals were tested for each genotype and gradient amplitude (Figure 4 ), and each arena was used to test five consecutive animals before being replaced. For the single odor source assay, spatial dispersion of paths was quantified relative to the odor source, which produced a radially symmetric odor distribution (Figure 3b ). The arena was partitioned into concentric 0.25-cm rings (distance bins) centered on the source position. Positions falling out of the largest ring contained in the arena are not reported in Figure 3 . The fraction of positions comprising each distance bin was computed for every path. Medians were then calculated over the relative occupancy distributions of 15 larvae. For a given genotype and source concentration, medians associated with each distance bin were compared to the Or83b -/- control using a Wilcoxon rank-sum test, adjusted by a Bonferroni correction to maintain the confidence level at 5%. For the multiple odor source assay, binary dilutions of source concentrations were used to generate gradients with an exponential profile along their length (Figure 4a–c ). The surface of the arena was partitioned into three zones (Z1, Z2, and Z3) on the basis of the topography of the gradient displayed in Figure 4c . The fraction of positions comprising each zone was computed for individual tracks, and distributions of n = 30 larvae were calculated and are presented as boxplots (Figure 4d ). The alignment of individual paths with the odor gradient was quantified by a previously described combined chemotaxis score [ 26 ], ranging between 0 (disregard for odorant line) and 1 (perfect alignment with odorant line). Immunostaining Whole-mount larval brain immunostaining was carried out as previously described [ 22 ] with the following antibodies: mouse anti- Drosophila choline acetyltransferase (ChAT4B1, 1:100; this monoclonal antibody developed by PM Salvaterra was obtained from the Developmental Studies Hybridoma Bank developed under the auspices of the NICHD and maintained by Department of Biological Sciences, University of Iowa, Iowa City, IA 52242, USA); rabbit anti-GFP (Molecular Probes, 1:1000); mouse anti-GABA (Sigma, 1:1000); mouse nc82 (gift from R Stocker, 1:10); goat anti-rabbit Alexa 488 (Molecular Probes, 1:100); goat anti-mouse Cy3 (Jackson ImmunoResearch, 1:100). Images were acquired with a Zeiss LSM510 confocal microscope.
Supplementary Material Additional file 1 Additional Figures S1–S6 and information on genotypes of all Drosophila strains used in this paper. Click here for file
📊 Figures
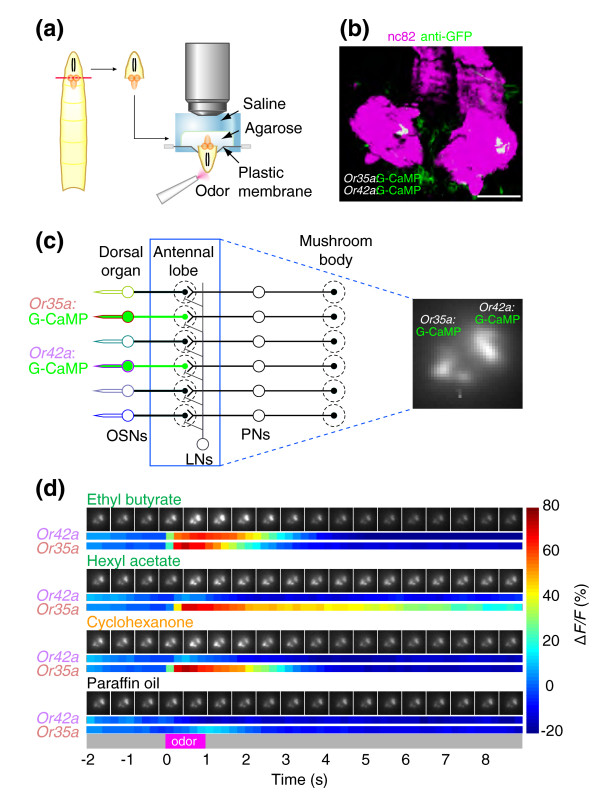
Figure 1
Imaging odor-evoked activity in larval olfactory neurons. (a) Schematic of the larval imaging preparation showing head dissection (left) and mounting of inverted sample for G-CaMP imaging (right). (b)...
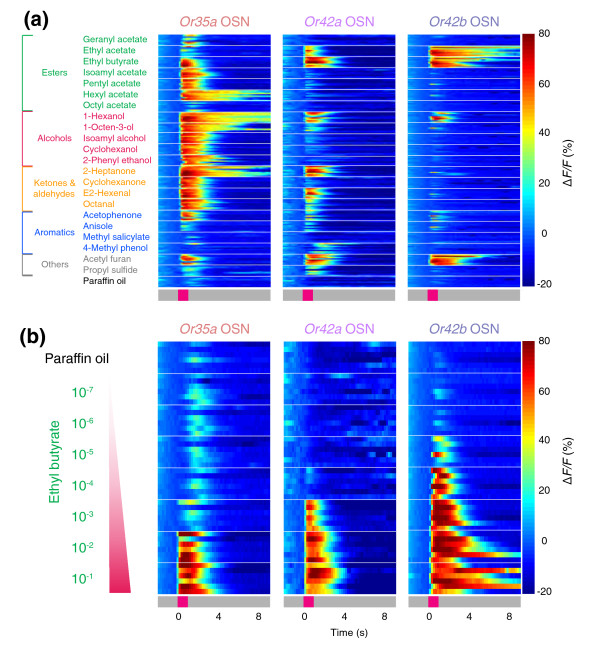
Figure 2
Ligand tuning of larval olfactory neurons in wild-type animals. (a) Odor-response profiles of the three OSNs most sensitive to ethyl butyrate, measured at axon termini of a given OSN in the antennal l...
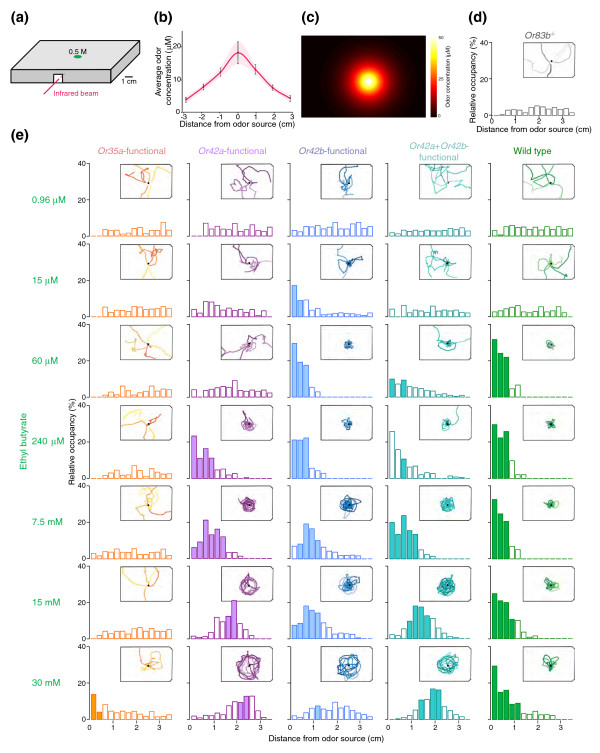
Figure 3
Behavioral sensitivity to ethyl butyrate in wild-type and manipulated larvae. (a) Schematic of the single odor source assay, with a 0.5 M ethyl butyrate source at position E7 on the lid of a 96-well p...
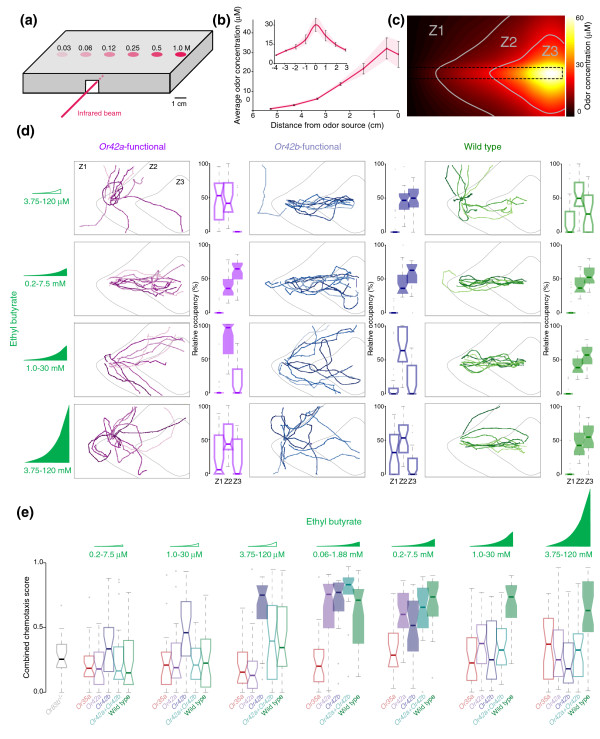
Figure 4
Chemotaxis to ethyl butyrate in wild-type and manipulated larvae. (a) Schematic of the multiple odor source assay. Source concentrations (M) used to generate ethyl butyrate gradients. (b) Average odor...
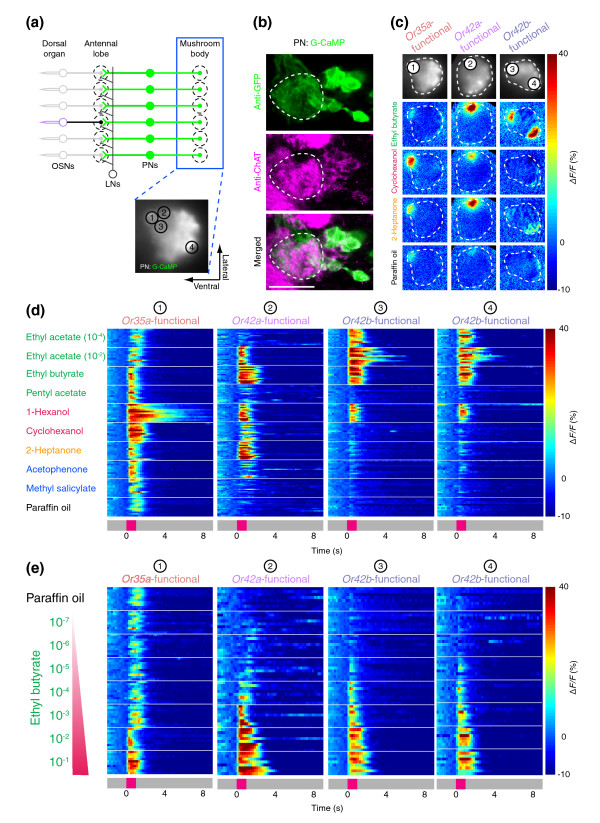
Figure 5
Odor responses of larval projection neurons. (a) Schematic for measuring functional activation of larval PNs in Or35a -, Or42a -, or Or42b -functional larvae at axon terminals in the mushroom body (bl...
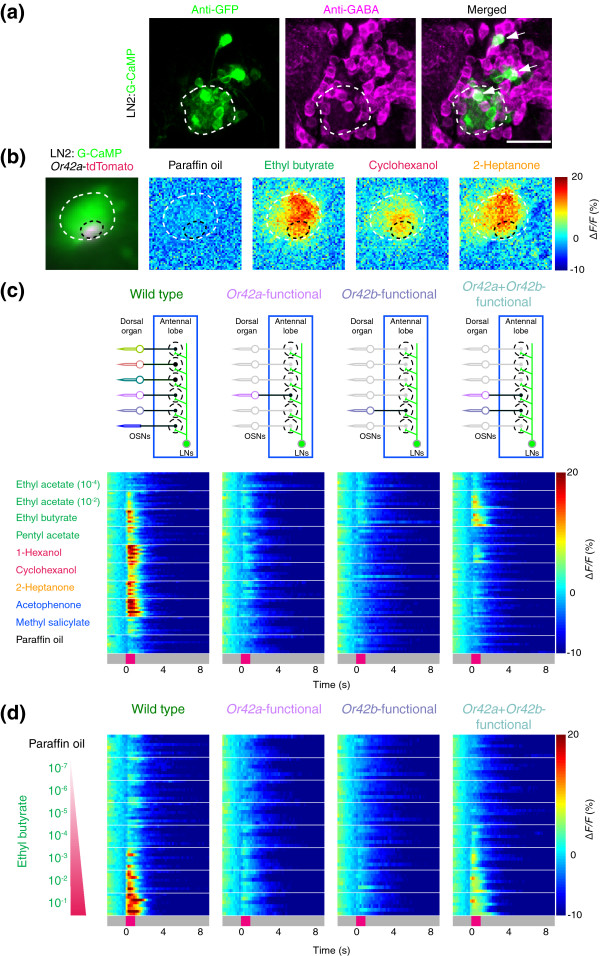
Figure 6
Threshold response properties of larval local interneurons. (a) LN2 cells in the antennal lobe stained to reveal G-CaMP (left; anti-GFP antibody, green) and gamma-aminobutyric acid (middle; anti-GABA,...
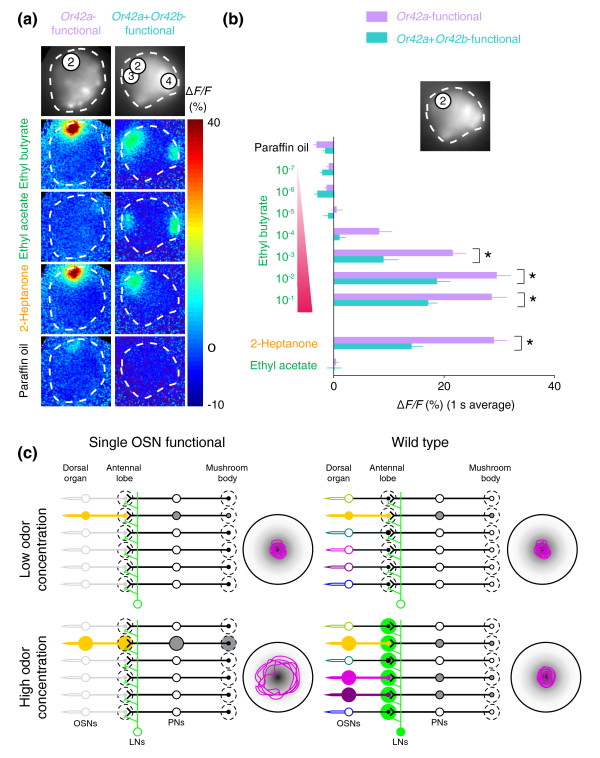
Figure 7
Modulation of odor-evoked signals in the mushroom body by addition of a second functional OSN. (a) Representative G-CaMP activity in PN terminals in mushroom body elicited by three odorants (10 -2 dil...
Figure images are served from the NIH/NLM PubMed Central Open Access Subset or Europe PMC; copyright remains with the publishers and authors.
💬 Discussion
0 commentsNo comments yet. Be the first to start a discussion!
Leave a Comment