Abstract
Many primary sensory cilia exhibit unique architectures that are critical for transduction of specific sensory stimuli. Although basic ciliogenic mechanisms are well described, how complex ciliary structures are generated remains unclear. Seminal work performed several decades ago provided an initial but incomplete description of diverse sensory cilia morphologies in C. elegans. To begin to explore the mechanisms that generate these remarkably complex structures, we have taken advantage of advances in electron microscopy and tomography, and reconstructed three-dimensional structures of fifty of sixty sensory cilia in the C. elegans adult hermaphrodite at high resolution. We characterize novel axonemal microtubule organization patterns, clarify structural features at the ciliary base, describe new aspects of cilia-glia interactions, and identify structures suggesting novel mechanisms of ciliary protein trafficking. This complete ultrastructural description of diverse cilia in C. elegans provides the foundation for investigations into underlying ciliogenic pathways, as well as contributions of defined ciliary structures to specific neuronal functions. DOI: http://dx.doi.org/10.7554/eLife.01948.001.
🔬 Techniques
🔭 Microscopes
🧬 Organisms
💻 Software
✨ Fluorophores
🧪 Sample Preparation
🏭 Microscope Brands
🧪 Reagent Suppliers
📷 Detectors
💻 Software Details
📋 Protocols
💾 Data Repositories
🏛️ Research Organizations (ROR)
Affiliated research institutions:
📋 Methods
Strains and growth conditions
C. elegans animals were maintained at 20°C on standard nematode growth media plates seeded with E. coli OP50 bacteria. Wild-type C. elegans (Bristol strain N2) was obtained from the Caenorhabditis Genetics Center.
Specimen preparation
Worm samples were prepared by transferring 1-day-old adult hermaphrodite worms to 20% bovine serum albumin (BSA) in M9 buffer in the cavity of an aluminum planchette (type ‘A’ hat; 100 µm deep, Wohlwend, Switzerland) for high-pressure freezing ( McDonald et al., 2007 ). In some cases, animals were treated with 10 mM levamisole and embedded in 2.4% low-melting point agarose pads ( Kolotuev et al., 2009 ). We noted that levamisole treatment and agarose embedding resulted in shortened channel cilia lacking distal segments; thus, this method was not used to model the distal ends of amphid channel cilia. The flat surface of another planchette (type ‘B’ hat) was placed on top to enclose the worms in the planchette’s cavity. The specimen–planchette sandwich was rapidly frozen using a Leica EM HPM100 high-pressure freezing system (Leica Microsystems, Vienna, Austria). Freeze-substitution was performed at low temperature (−90°C) over 3 days in a solution containing 1% osmium tetroxide (19,100, EMS), 0.5% glutaraldehyde (16,530, EMS) and 2% water in anhydrous acetone (AC32680-1000, Fisher) using a Leica EM AFS2 freeze-substitution system. The temperature was progressively increased up to 0°C (5°C/hr), and finally brought to 4°C and maintained at this temperature for 1 hr. Samples were washed four times with anhydrous acetone (30 min each), then infiltrated and embedded in Araldite 502/Embed-812 Resin (Araldite—10,900, EMS, Embed-812—14,900, EMS, DDSA—13,710, EMS) at room temperature and polymerized in an oven at 60°C for 3–4 days. Serial section TEM Resin blocks with specimens were in most cases trimmed so that the block face was perpendicular to the longitudinal axis of the worm nose for serial cross-sections, while keeping a small amount of resin around the specimen. For longitudinal images of the nose sensilla, the block face was aligned parallel to the longitudinal axis of the worm nose. Serial ultrathin sections (70-nm thickness) were collected on slot grids covered with Formvar support film, and post-stained with 2% uranyl acetate (0379, Polysciences, Inc., Warrington, PA) for 30 min, and Reynold’s lead citrate (Lead nitrate—17,900, EMS, and Sodium citrate—S-279, Fisher) for 15 min. Serial sections were imaged on a Tecnai F20 (200 keV) or F30 (300 keV) transmission electron microscope (FEI, Hillsboro, OR) and recorded using a 2K × 2K charged-coupled device (CCD) camera at 14,500X magnification on the F20 (1.25 nm pixel size), or at 23,000X magnification on the F30 (1 nm pixel size). For large overviews of the cross and longitudinal sections, we acquired montages of overlapping high-magnification images in an automated fashion using the microscope control software SerialEM ( Mastronarde, 2005 ). Serial section ET After analyzing TEM images of the serial sections, grids, and sections with structures of interest were prepared for ssET by coating both sides of the serial sections on Formvar with 10-nm colloidal gold fiducials (Sigma-Aldrich, St. Louis, MO) that were previously incubated for 30 min in 5% BSA (SC-2323, Santa Cruz Biotechnology, Inc.) ( Iancu et al., 2006 ). Dual-axis tilt series, that is, two orthogonal tilt series of regions of interest, were acquired by tilting the sample from −60 to +60 with 1° increments using the microscope control software SerialEM ( Mastronarde, 2005 ) on a Tecnai F20 (200 keV). All images were digitally recorded on a 2K × 2K CCD camera, at 14,500X or 19,000X magnification, resulting in a pixel size of 1.25 nm or 1.04 nm, respectively.
Show full methods section
Strains and growth conditions
C. elegans animals were maintained at 20°C on standard nematode growth media plates seeded with E. coli OP50 bacteria. Wild-type C. elegans (Bristol strain N2) was obtained from the Caenorhabditis Genetics Center.
Specimen preparation
Worm samples were prepared by transferring 1-day-old adult hermaphrodite worms to 20% bovine serum albumin (BSA) in M9 buffer in the cavity of an aluminum planchette (type ‘A’ hat; 100 µm deep, Wohlwend, Switzerland) for high-pressure freezing ( McDonald et al., 2007 ). In some cases, animals were treated with 10 mM levamisole and embedded in 2.4% low-melting point agarose pads ( Kolotuev et al., 2009 ). We noted that levamisole treatment and agarose embedding resulted in shortened channel cilia lacking distal segments; thus, this method was not used to model the distal ends of amphid channel cilia. The flat surface of another planchette (type ‘B’ hat) was placed on top to enclose the worms in the planchette’s cavity. The specimen–planchette sandwich was rapidly frozen using a Leica EM HPM100 high-pressure freezing system (Leica Microsystems, Vienna, Austria). Freeze-substitution was performed at low temperature (−90°C) over 3 days in a solution containing 1% osmium tetroxide (19,100, EMS), 0.5% glutaraldehyde (16,530, EMS) and 2% water in anhydrous acetone (AC32680-1000, Fisher) using a Leica EM AFS2 freeze-substitution system. The temperature was progressively increased up to 0°C (5°C/hr), and finally brought to 4°C and maintained at this temperature for 1 hr. Samples were washed four times with anhydrous acetone (30 min each), then infiltrated and embedded in Araldite 502/Embed-812 Resin (Araldite—10,900, EMS, Embed-812—14,900, EMS, DDSA—13,710, EMS) at room temperature and polymerized in an oven at 60°C for 3–4 days. Serial section TEM Resin blocks with specimens were in most cases trimmed so that the block face was perpendicular to the longitudinal axis of the worm nose for serial cross-sections, while keeping a small amount of resin around the specimen. For longitudinal images of the nose sensilla, the block face was aligned parallel to the longitudinal axis of the worm nose. Serial ultrathin sections (70-nm thickness) were collected on slot grids covered with Formvar support film, and post-stained with 2% uranyl acetate (0379, Polysciences, Inc., Warrington, PA) for 30 min, and Reynold’s lead citrate (Lead nitrate—17,900, EMS, and Sodium citrate—S-279, Fisher) for 15 min. Serial sections were imaged on a Tecnai F20 (200 keV) or F30 (300 keV) transmission electron microscope (FEI, Hillsboro, OR) and recorded using a 2K × 2K charged-coupled device (CCD) camera at 14,500X magnification on the F20 (1.25 nm pixel size), or at 23,000X magnification on the F30 (1 nm pixel size). For large overviews of the cross and longitudinal sections, we acquired montages of overlapping high-magnification images in an automated fashion using the microscope control software SerialEM ( Mastronarde, 2005 ). Serial section ET After analyzing TEM images of the serial sections, grids, and sections with structures of interest were prepared for ssET by coating both sides of the serial sections on Formvar with 10-nm colloidal gold fiducials (Sigma-Aldrich, St. Louis, MO) that were previously incubated for 30 min in 5% BSA (SC-2323, Santa Cruz Biotechnology, Inc.) ( Iancu et al., 2006 ). Dual-axis tilt series, that is, two orthogonal tilt series of regions of interest, were acquired by tilting the sample from −60 to +60 with 1° increments using the microscope control software SerialEM ( Mastronarde, 2005 ) on a Tecnai F20 (200 keV). All images were digitally recorded on a 2K × 2K CCD camera, at 14,500X or 19,000X magnification, resulting in a pixel size of 1.25 nm or 1.04 nm, respectively.
Image processing ssTEM
Image processing to generate and analyze ssTEM 3D reconstructions was automated using manual correction only as needed. Blendmont, a utility of the IMOD software package ( Kremer et al., 1996 ) was used to finely align and stitch image tiles into a single montage image for each whole worm cross section. Images were converted from MRC to TIFF format with mrc2tif (IMOD) and then to PNG format (ImageJ) while preserving image resolution. The ir-tools ( http://www.sci.utah.edu/download/ncrtoolset ) were modified and used for automated section-to-section image registration ( Tasdizen et al., 2010 ). Nornir Build Manager software ( http://github.com/nornir ) was used to coordinate execution of the ir-tools, including the calculation of transforms for each section and the generation of the final volume with registered images ( Anderson et al., 2009 ). Briefly, volume assembly began with automatic image registration of all adjacent section pairs. The centermost section was not warped and designated as reference in the volume center. The remaining sections were mapped in relation to the center by serially applying the intervening adjacent section-to-section transforms and warped to correct for distortions resulting from the sectioning process or section folds. Where automatic registration failed between adjacent sections, the alignment was done interactively using Pyre (Nornir) or ir-tweak (ir-tools). The registered serial section images were then converted from PNG format to TIFF (ImageJ) and then to MRC format (tif2mrc/IMOD) to allow stacking of the aligned images into the ssTEM 3D reconstruction (newstack/IMOD) ( Kremer et al., 1996 ). Contours of cell membranes and other features were manually traced in IMOD to generate 3D graphical models (3dmod, imodmesh/IMOD) ( Kremer et al., 1996 ). ssET 3D tomographic reconstructions (dual axis) were generated using etomo from the IMOD software package ( Kremer et al., 1996 ; Mastronarde, 1997 ); gold fiducial markers were used for alignment of the tilt series images and the tomograms were calculated in silico using weighted back projection. Serial section tomograms were then aligned, joined, and modeled in 3D using IMOD tools.
Additional files 10.7554/eLife.01948.037 Supplementary file 1. ( A ) isMTs in amphid neuron cilia. ( B ) Location of vesicles in sensory cilia. DOI: http://dx.doi.org/10.7554/eLife.01948.037
📊 Figures
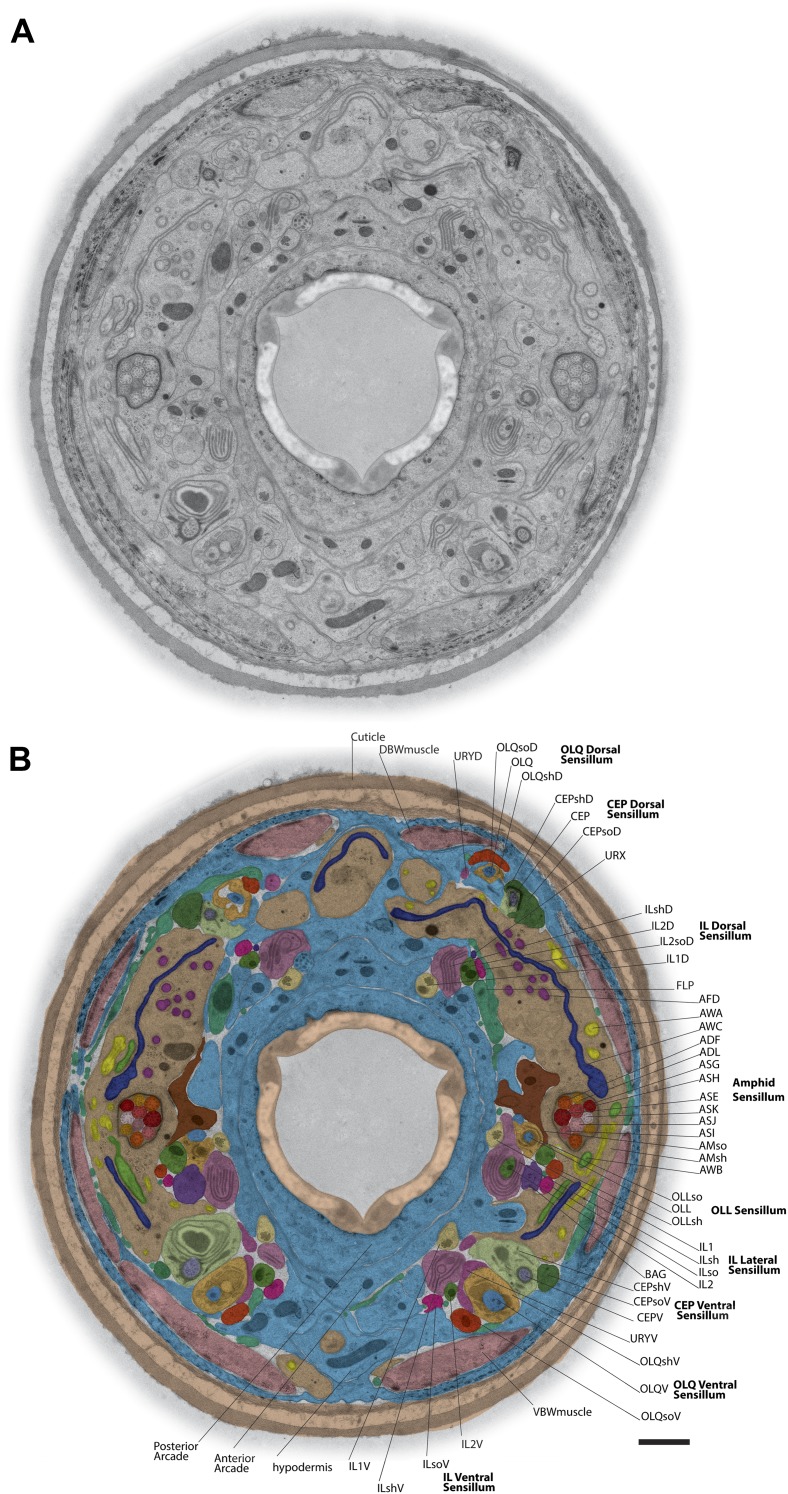
Figure 1.
TEM cross-section with identified ciliary and glial endings.
( A ) Example TEM cross-section of a high-pressure frozen/freeze-substituted (HPF-FS) C. elegans hermaphrodite animal (70-nm cross-section, 5.9 u00b5m from the anterior nose tip). Edges surrounding th...
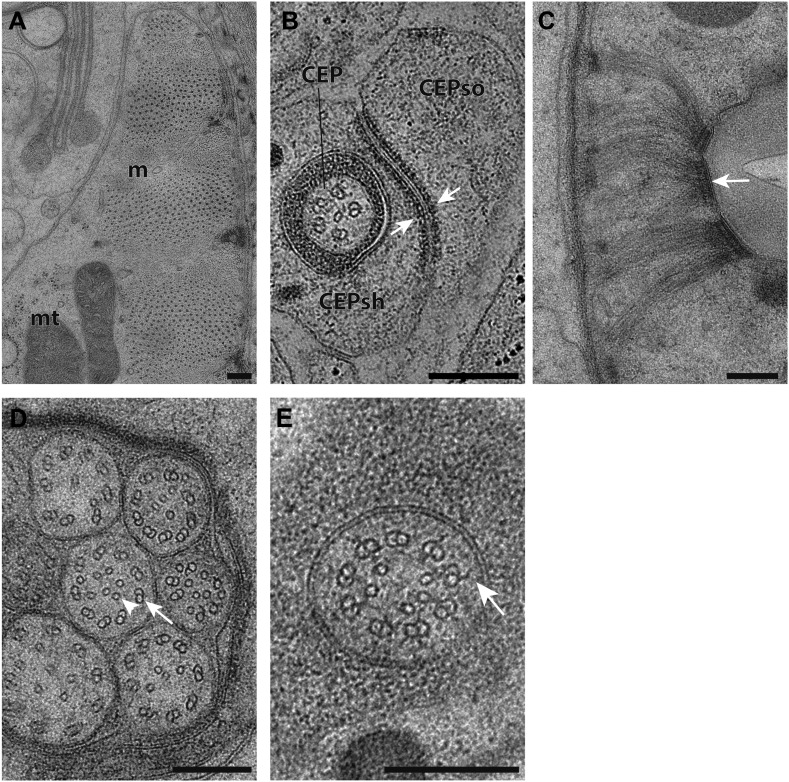
Figure 1u2014figure supplement 1.
Ultrastructural features maintained by HPF-FS.
( A ) TEM cross-section images of striated ventral body wall muscle (m) with myosin and actin filaments. Mitochondria (mt) with cristae are also shown. ( B ) Cross-section TEM image showing an apical ...
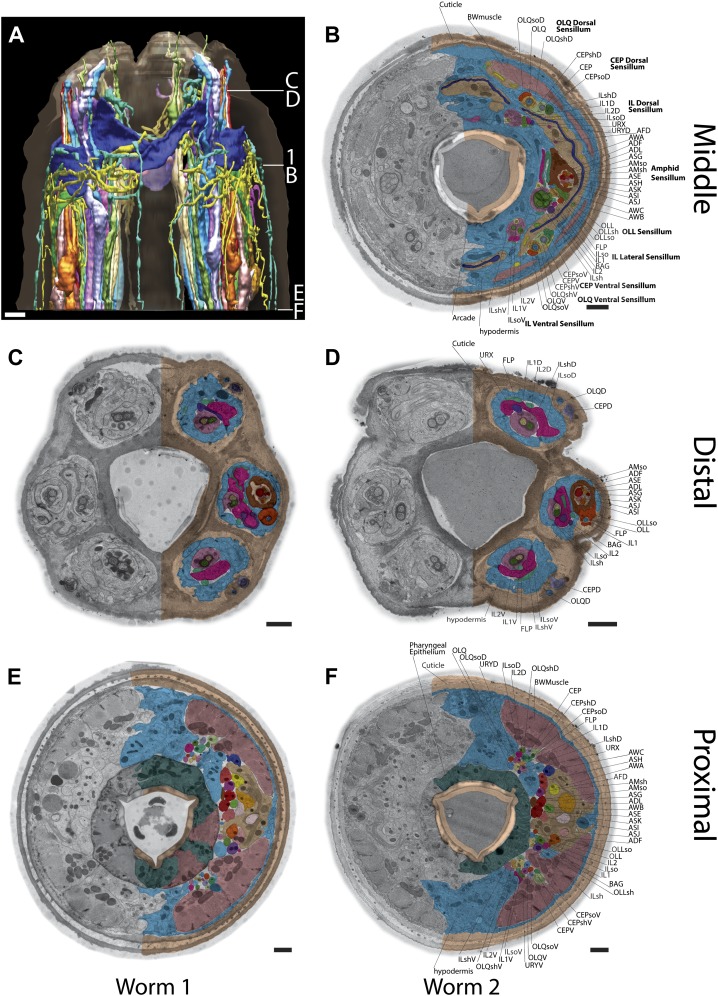
Figure 1u2014figure supplement 2.
Example TEM cross-section images of the C. elegans nose.
( A ) 3D reconstruction of the anterior endings. The location of sections B u2013 F and the section shown in Figure 1 are indicated. ( B u2013 F ) Anterior cross-section TEM images from two animals ( ...
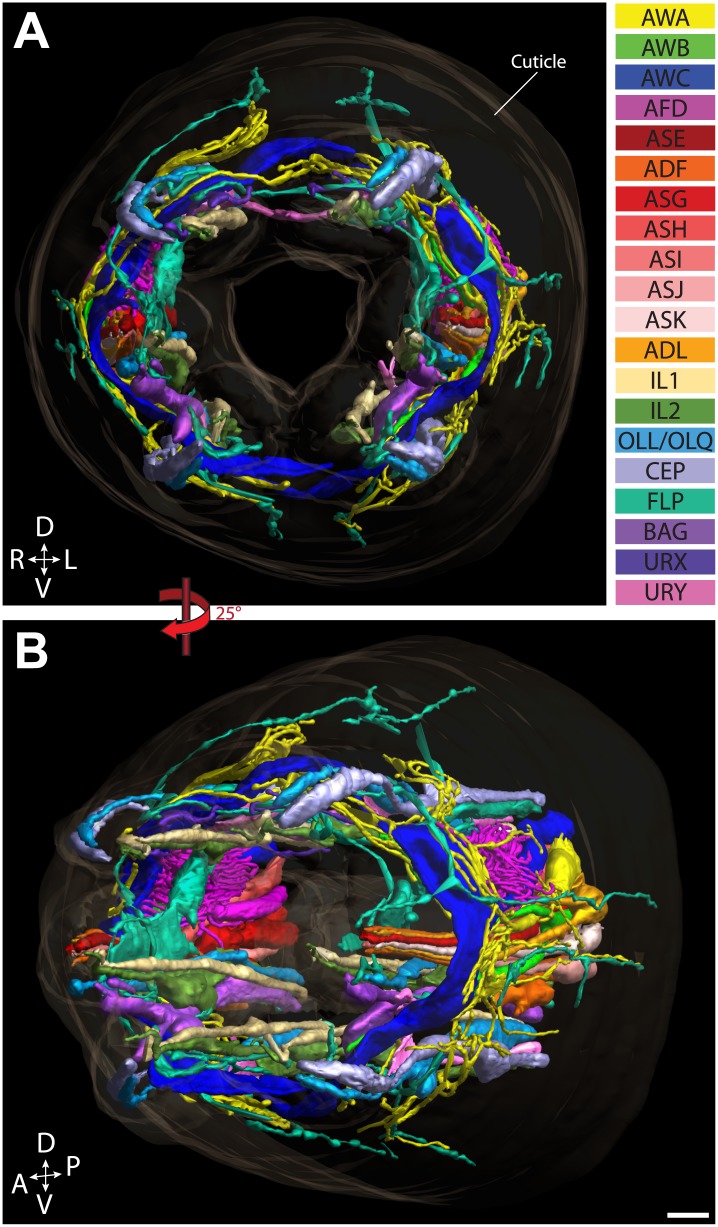
Figure 2.
Graphical model of a high-resolution ssTEM 3D reconstruction of the anterior sensory endings.
3D reconstruction of the cilia and dendritic endings of anterior sensory neurons modeled from 166 thin serial sections (14 u00b5m, starting at the nose). Front ( A ) and angled ( B ) profile views are...
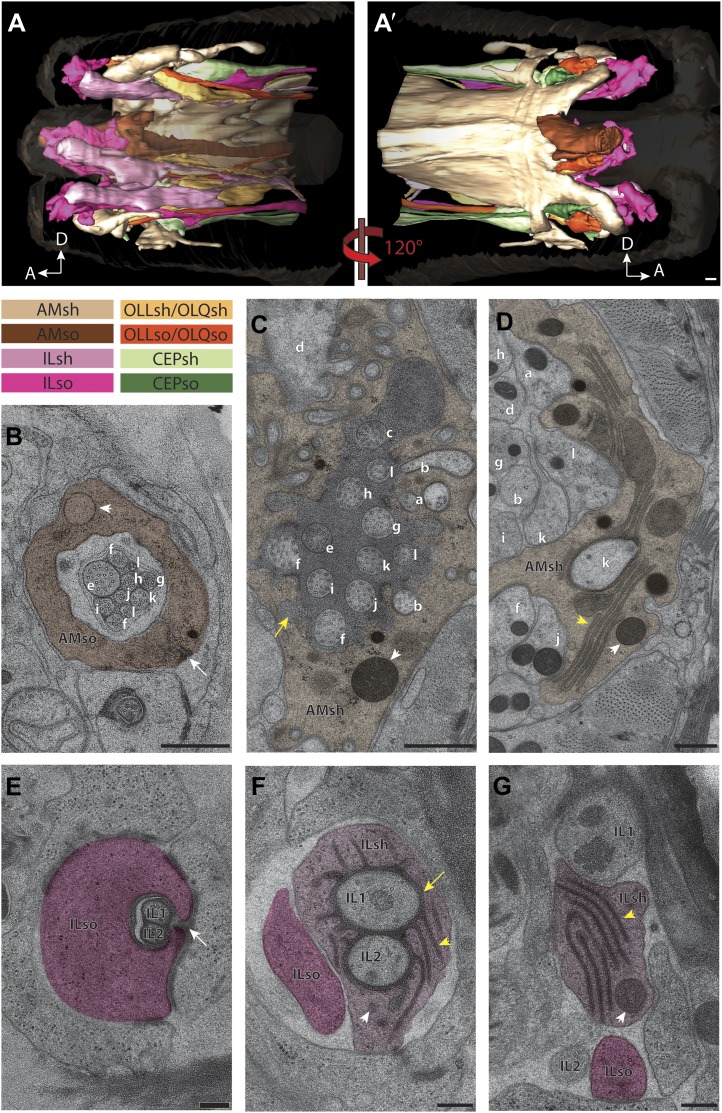
Figure 3.
Two glial cell types are associated with each ciliated sensillum.
( A and Au2032 ) 3D reconstruction models of sheath (sh) and socket (so) glia for left side of the worm for amphid (AM), inner labial (IL), outer labial (OLL/OLQ), and cephalic (CEP) glia. Glial types...
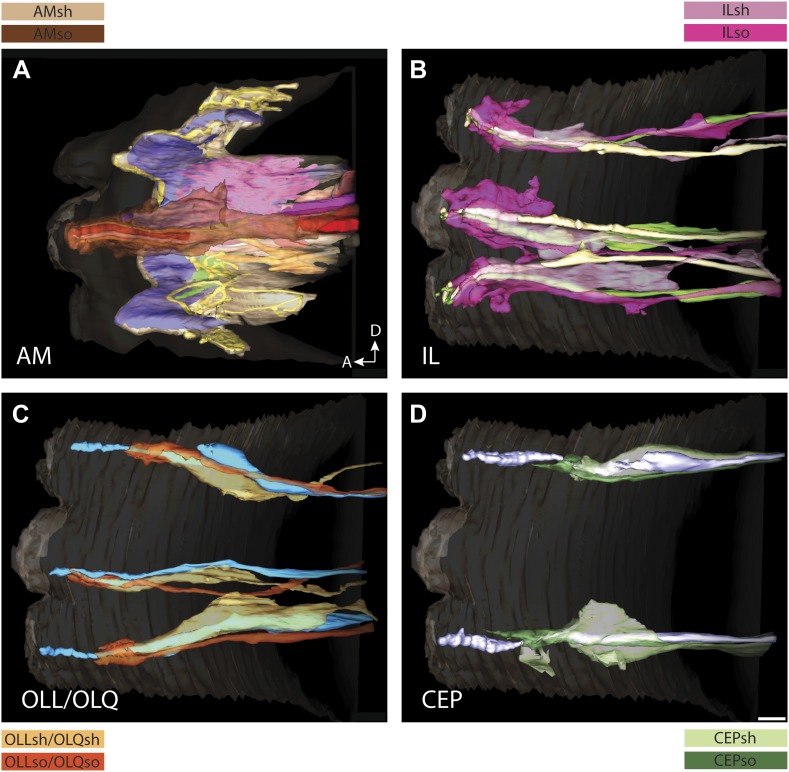
Figure 3u2014figure supplement 1.
3D reconstruction models of glia associated with different sensilla.
( A ) amphid, ( B ) IL, ( C ) OLL/OLQ, and ( D ) CEP sheath and socket glial endings associate closely with the cilia of their respective neurons. Glial subtypes are color coded. Scale bars: 1 u00b5m....
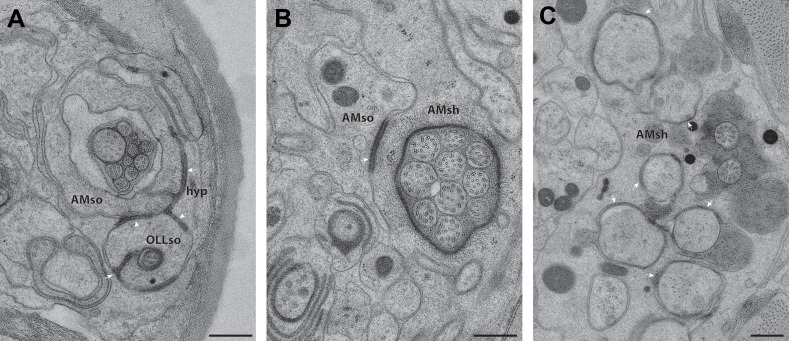
Figure 3u2014figure supplement 2.
CeAJ connections between glial processes and surrounding cells.
ssTEM cross-section images showing CeAJ connections (arrowheads) between ( A ) AMso, OLLso and hypodermal (hyp) syncytial cells, ( B ) AMso and AMsh, and ( C ) AMsh and amphid neuron cilia at their PC...
Video 1.
ssTEM 3D reconstruction model of all ciliated and non-ciliated anterior sensory endings in the C. elegans adult hermaphrodite. Color codes are as indicated in Figure 2 .
DOI: http://dx.doi.org/10.7554/eLife.01948.010
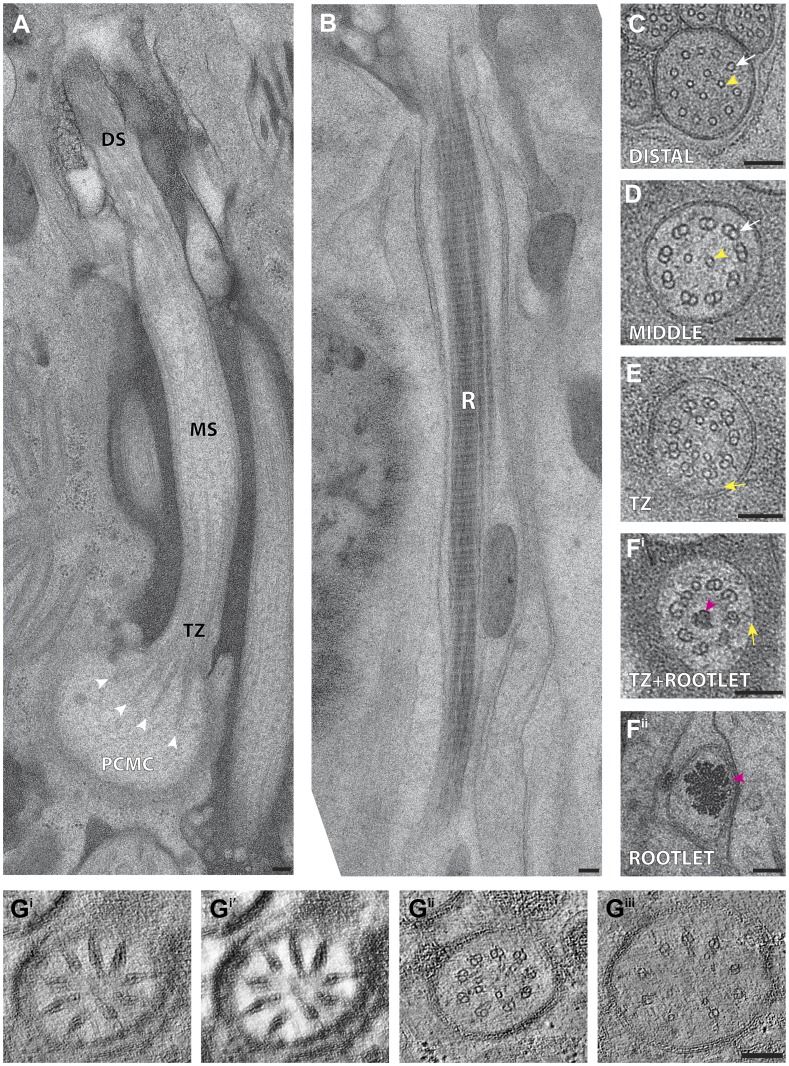
Figure 4.
C. elegans ciliary ultrastructure.
( A ) Longitudinal section of an amphid channel cilium (ASE), showing distal segment (DS), middle segment (MS), TZ and PCMC. Flaring of the MTs at the ciliary base is indicated by arrowheads. ( B ) Lo...
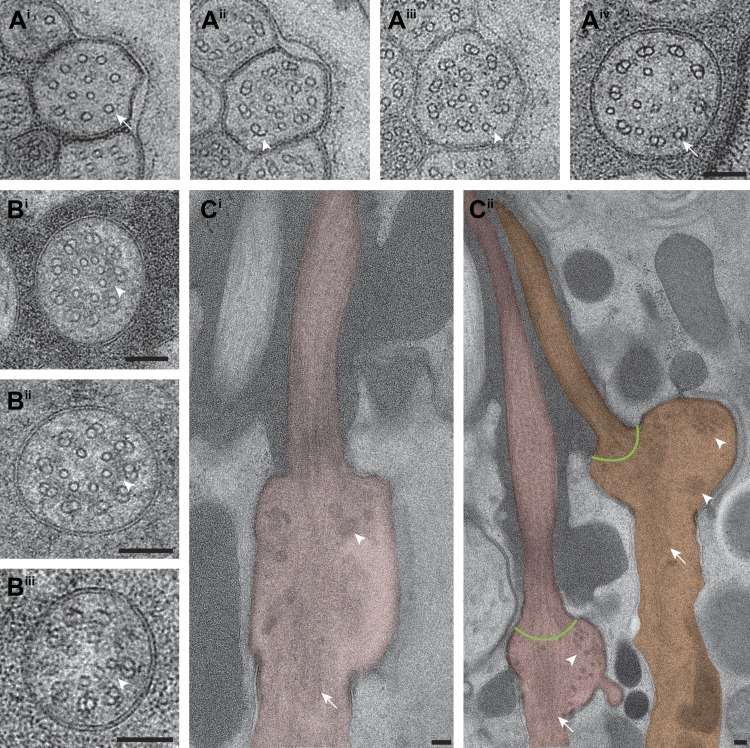
Figure 4u2014figure supplement 1.
Subcellular features of amphid cilia.
( A iu2013iv ) Cross-section TEM series of an ASE cilium showing doublet-to-singlet MT transition from distal ( A i ) to proximal ( A iv ). B-tubule hooks are indicated by arrowheads; dsMTs and sMTs a...
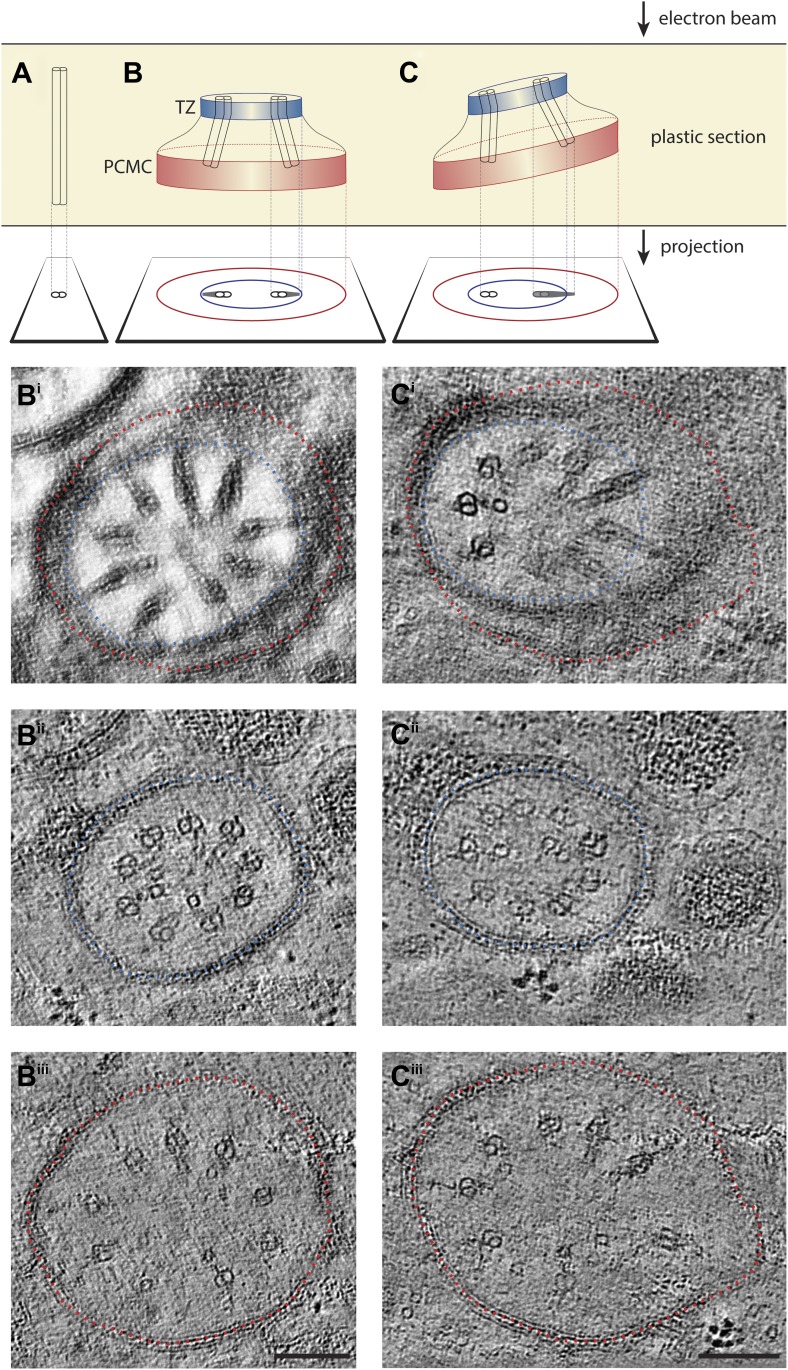
Figure 4u2014figure supplement 2.
ET analyses of flared dMTs at the ciliary base.
( A u2013 C ) Diagrammatic representations of 2D TEM projections of ciliary structures through plastic sections and images of corresponding ET slices below. Only one or two dMTs are represented in the...
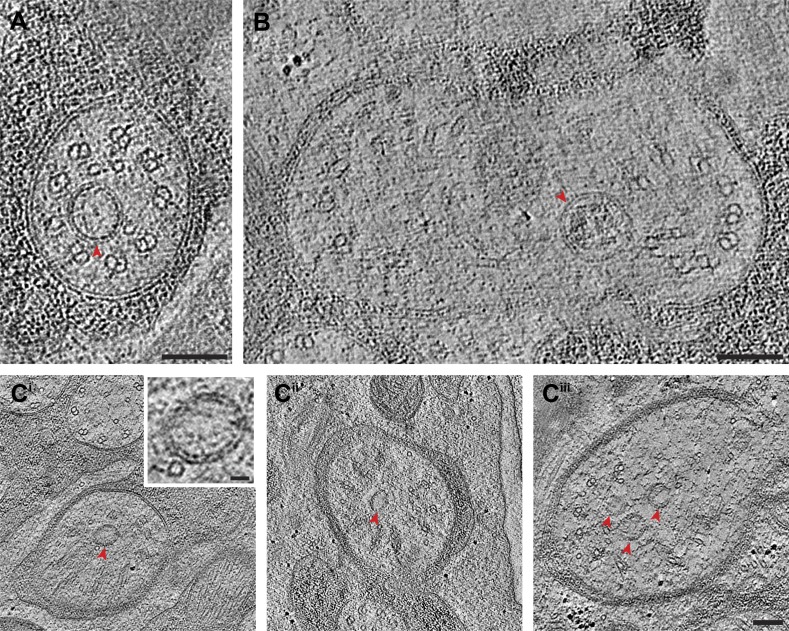
Figure 5.
Vesicles at the ciliary base and in the TZ.
Cross-section ET slices showing vesicles (red arrowheads) present ( A ) at the cylindrical region of the TZ in the ASI amphid neuron cilium, ( B ) between the axoneme and ciliary membrane of one of th...
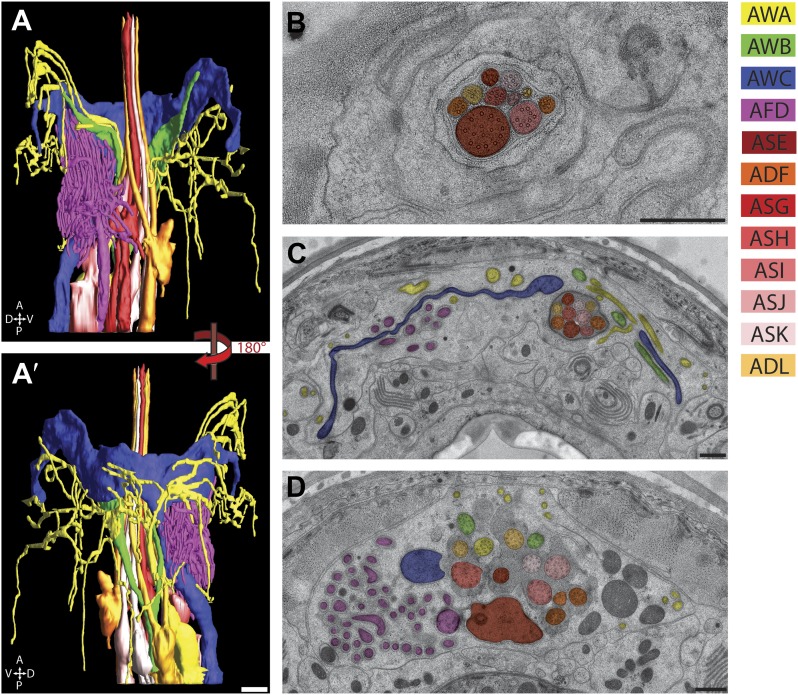
Figure 6.
The amphid sensillum.
( A and Au2032 ) 3D graphical model of the reconstructed amphid sensilla on the right side indicating the endings of twelve sensory neurons. Scale bar: 1 u00b5m. ( B ) Distal, ( C ) middle, and ( D ) ...
Video 2.
ssTEM 3D reconstruction model of all amphid neuron cilia and associated socket and sheath cell processes. Color codes as indicated in Figure 2 .
DOI: http://dx.doi.org/10.7554/eLife.01948.016
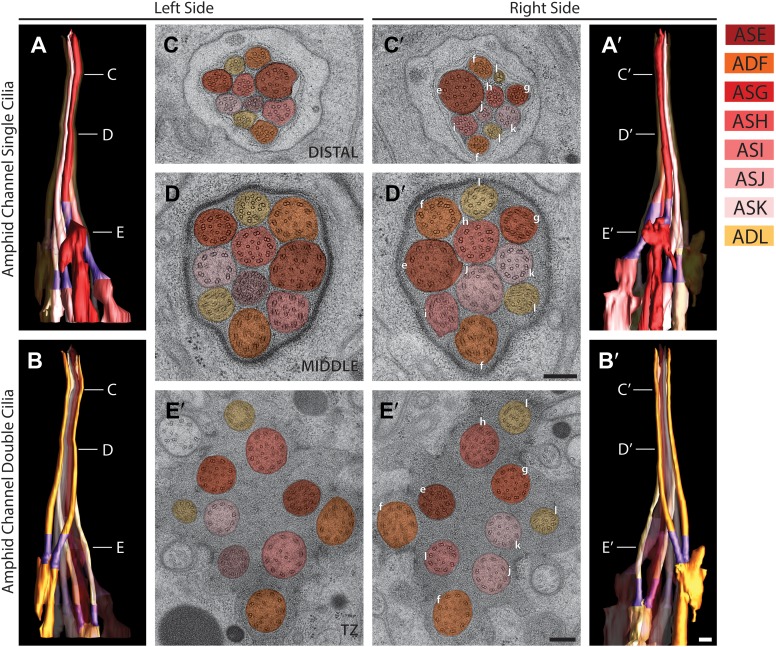
Figure 7.
Morphology and ultrastructure of amphid channel cilia.
Reconstructed 3D models of amphid channel cilia containing single ( A and Au2032 ) or double ( B and Bu2032 ) rods on the left ( A and B ) and right ( Au2032 and Bu2032 ) sides. Labels indicate approx...
Video 3.
3D reconstruction model of axonemal MTs twisting as the ASI cilium projects distally. Dark purpleu2014A-tubules; light purpleu2014B-tubules.
DOI: http://dx.doi.org/10.7554/eLife.01948.018
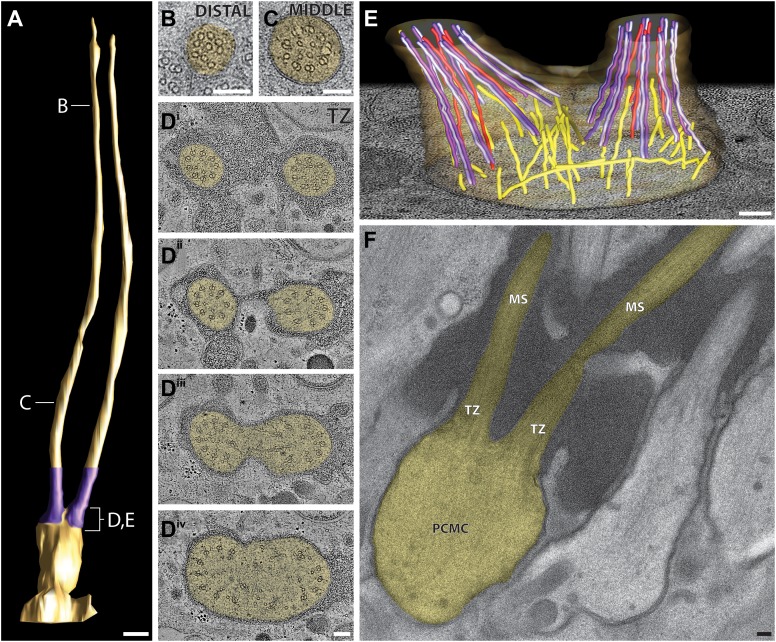
Figure 8.
Ultrastructure of the ADL neuron cilia.
( A ) 3D reconstruction model of the two ADL channel cilia, indicating TZs (purple) at the base of each cilium. Labels indicate approximate location of sections shown in B u2013 E . Scale bar: 500 nm....
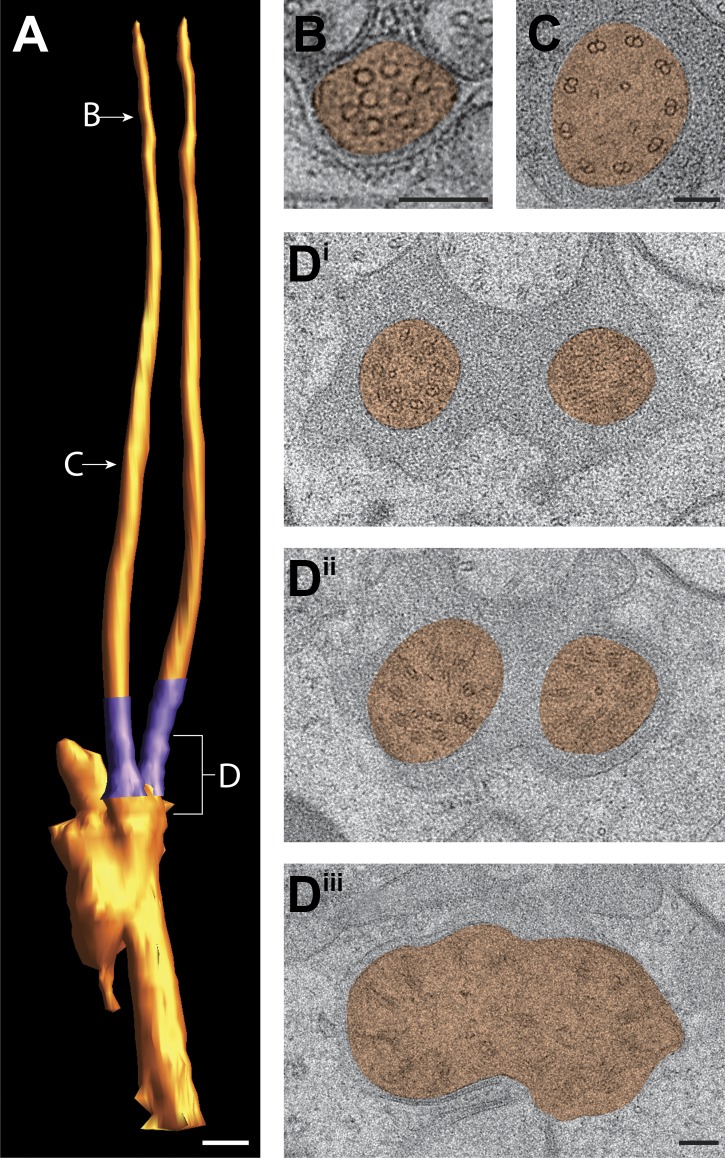
Figure 8u2014figure supplement 1.
Ultrastructure of the ADF neuron cilia.
( A ) 3D reconstruction model of ADF channel cilia, indicating two TZs (purple). Labels indicate approximate location of sections shown in B u2013 D . ( B and C ) Cross-section TEM images of distal se...
Video 4.
3D reconstruction model of MT distribution at the TZs of the two cilia in ADL amphid neurons. Color codes for MTs as indicated in Figure 8 legend.
DOI: http://dx.doi.org/10.7554/eLife.01948.021
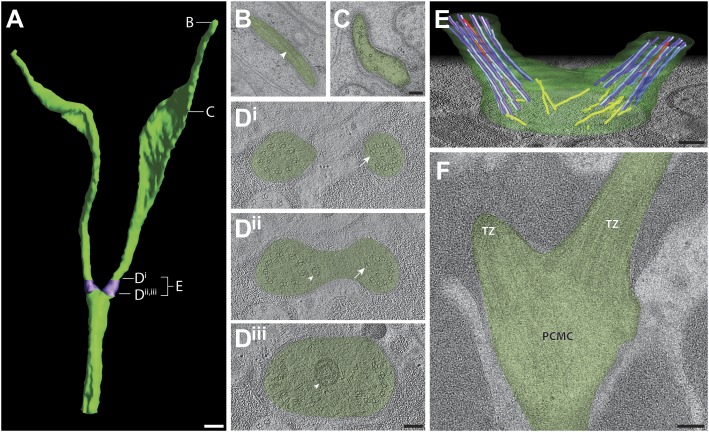
Figure 9.
Ultrastructure of the AWB neuron cilia.
( A ) 3D reconstruction model of AWB cilia, indicating TZs (purple). Labels indicate approximate location of sections and models shown in B u2013 E . Scale bar: 500 nm. ( B and C ) Cross-section TEM i...
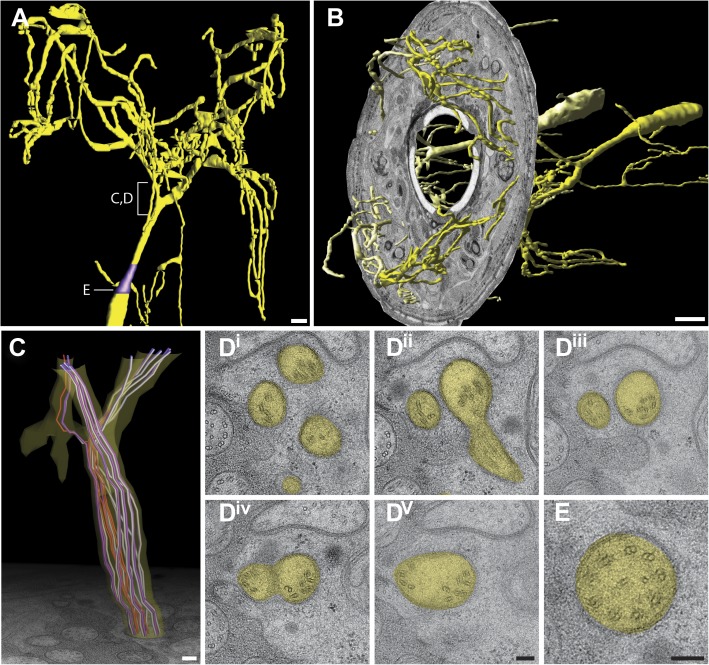
Figure 10.
Ultrastructure of the AWA cilium.
( A ) 3D reconstruction model of an AWA cilium, indicating TZ (purple). Scale bar: 1 u03bcm. ( B ) 3D reconstruction model of AWA cilia with a single cross-sectional view indicating the spread of AWA ...
Video 5.
3D reconstruction model of MT distribution in the branches of the AWA cilium. Color codes for MTs as indicated in Figure 10 legend.
DOI: http://dx.doi.org/10.7554/eLife.01948.024
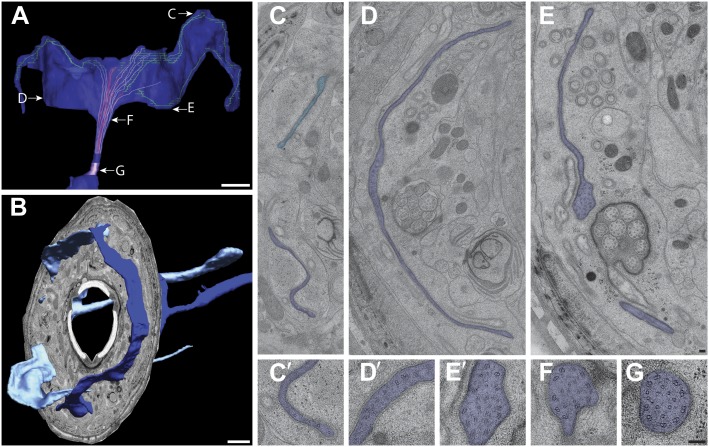
Figure 11.
Ultrastructure of the AWC cilium.
( A ) 3D reconstruction model of an AWC winged cilium, indicating TZ (purple) and MTs. Light purpleu2014dMTs; redu2014isMTs; greenu2014MTs (undetermined). Labels indicate approximate location of secti...
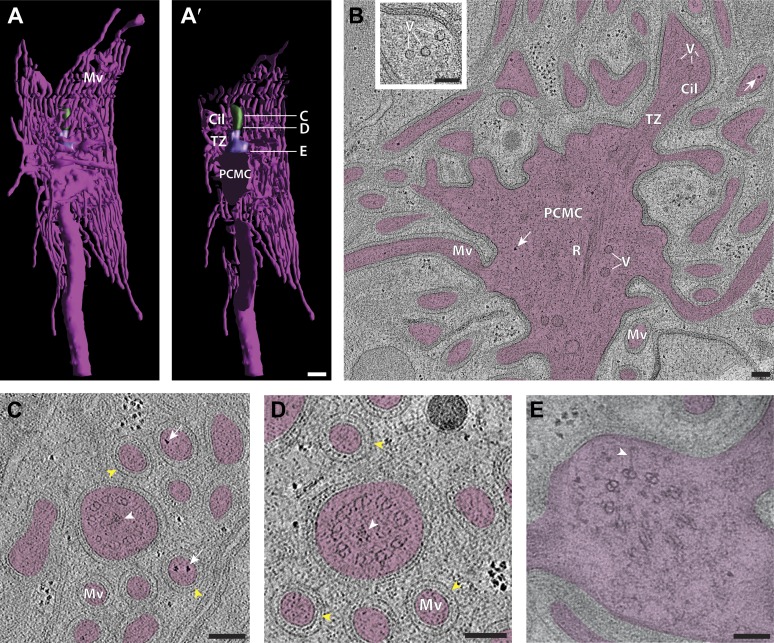
Figure 12.
Ultrastructure of the sensory endings of AFD.
( A and Au2032 ) 3D reconstruction model of an AFD finger cell sensory ending with microvilli branches (magenta) and cilium (green). ( Au2032 ) Clipped view allowing visualization of the TZ (purple) a...
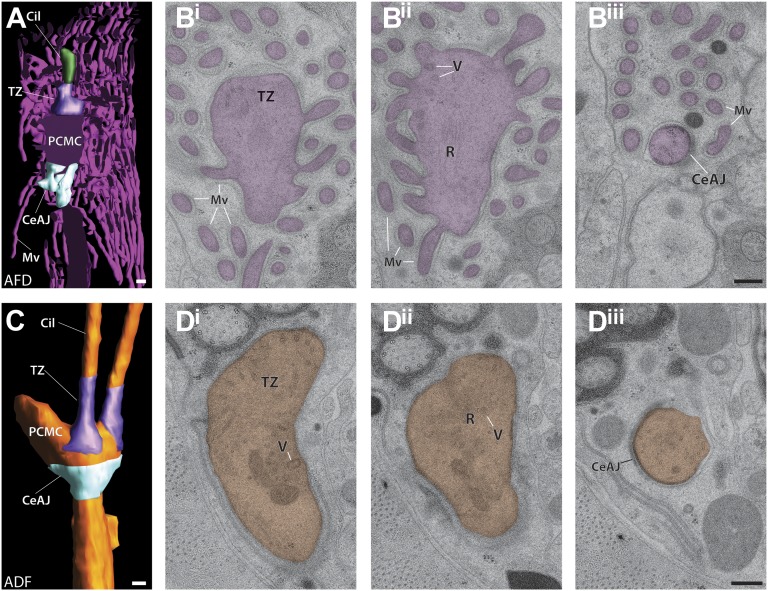
Figure 12u2014figure supplement 1.
Periciliary membrane compartments.
( A ) Clipped view of a 3D reconstruction model of AFD and its PCMC, TZ (purple) and the CeAJ (light blue). Scale bar: 200 nm. ( B iu2013iii ) ssTEM images of the ( B i ) TZ/apical region of the PCMC,...
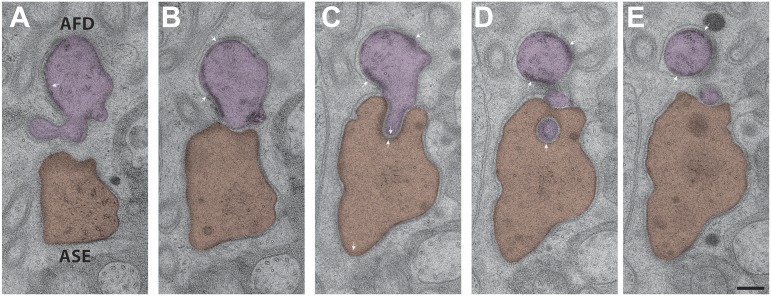
Figure 12u2014figure supplement 2.
Interactions between the PCMCs of AFD and ASE.
The AFD PCMC has a stereotypical projection into the ASE PCMC. Both of these PCMC regions are bound by CeAJs (arrowheads) between the cilium and the sheath cell process. Sections are from distal ( A )...
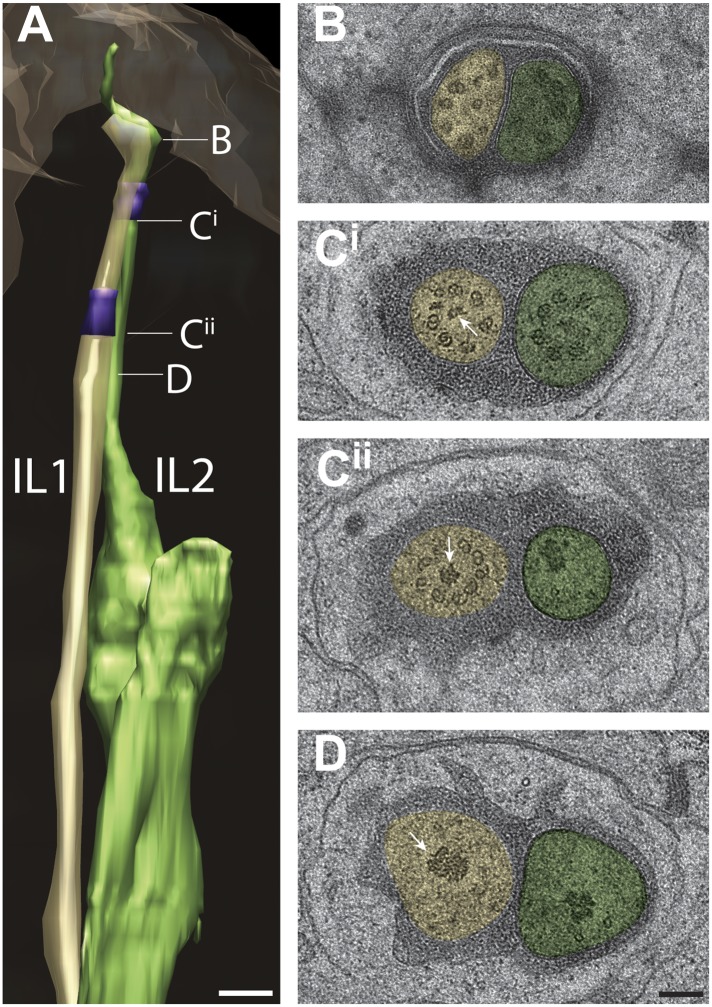
Figure 13.
Ultrastructure of IL1 and IL2 neurons.
( A ) 3D reconstruction model of lateral IL1 (yellow-tan) and IL2 (green) cilia indicating TZs (purple) and the long striated IL1 rootlet (white). Labels indicate approximate positions of cross-sectio...
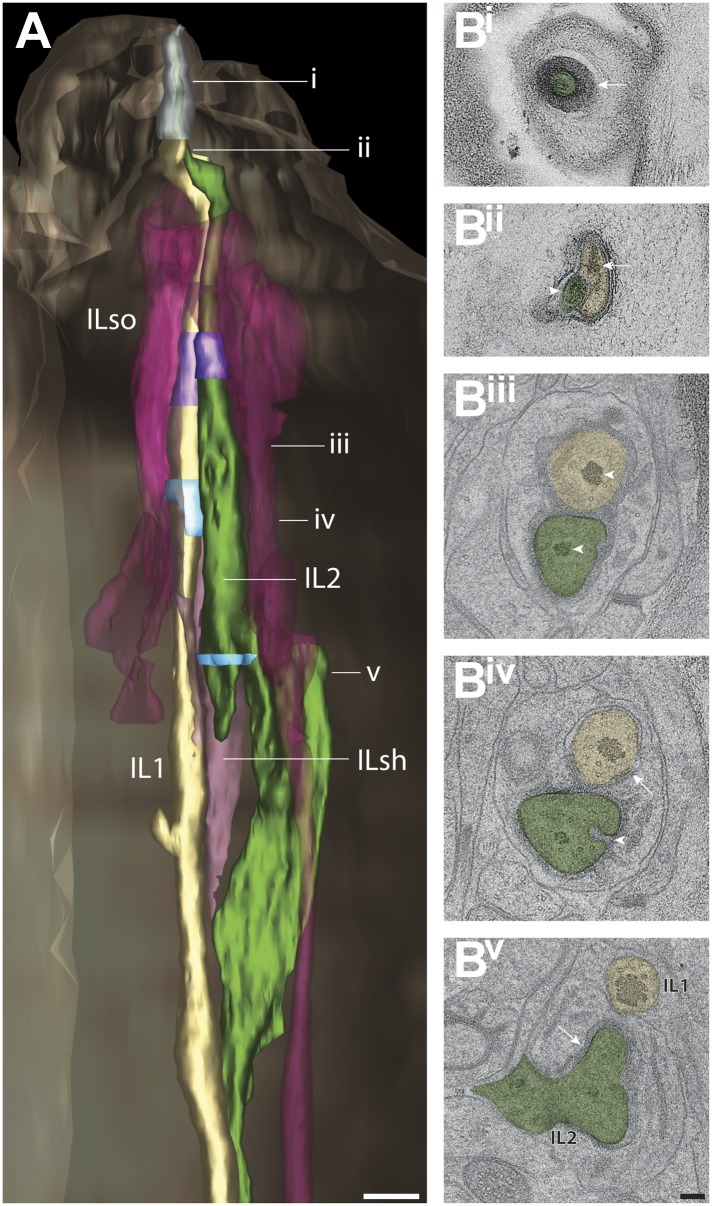
Figure 13u2014figure supplement 1.
Structural features associated with lateral IL1 and IL2 cilia.
( A ) 3D reconstructed models of lateral IL1 and IL2 cilia and processes of associated support cells. TZs and CeAJs are indicated in purple and light blue, respectively. Approximate locations of cross...
Video 6.
3D reconstruction model of the sensory endings and associated glial cells processes of the IL, OLL/OLQ and CEP neurons.
DOI: http://dx.doi.org/10.7554/eLife.01948.031
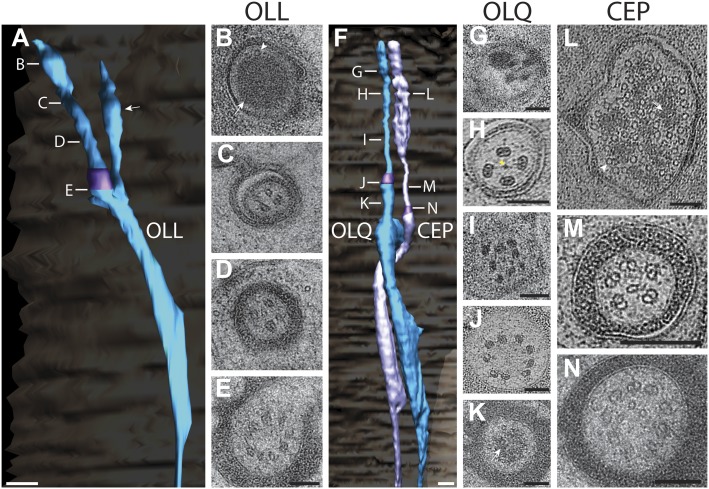
Figure 14.
Ultrastructure of the OLL/OLQ and CEP neuron cilia.
( A ) 3D reconstruction model of OLL cilium indicating TZ (purple) and a non-ciliary type III dendritic branch (arrow). Approximate locations of cross sections in B u2013 E are shown. Scale bar: 500 n...
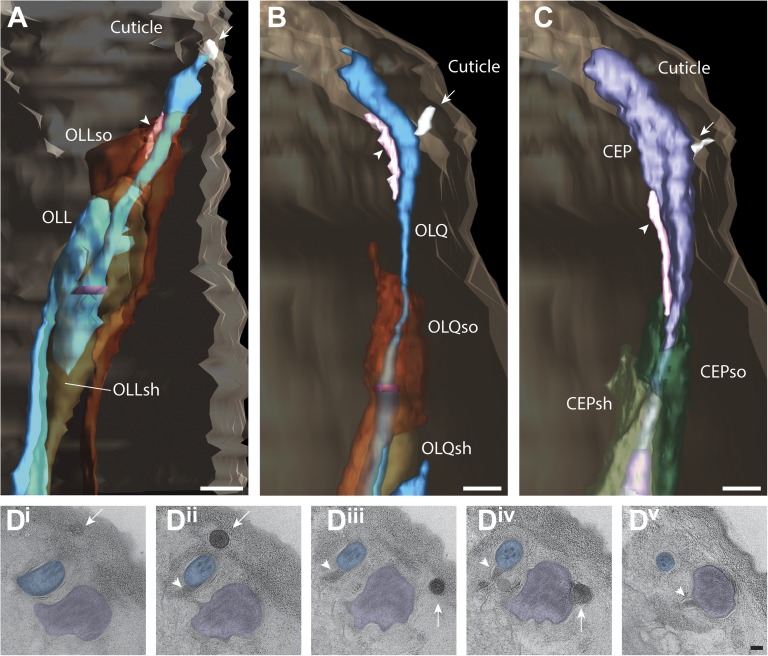
Figure 14u2014figure supplement 1.
Structural features associated with OLQ and CEP cilia.
( A u2013 C ) 3D reconstructed models of an OLL ( A ), OLQ ( B ), and CEP ( C ) cilium with processes of associated glial cells. Spurs and cuticular strings are indicated by arrowheads and arrows, res...
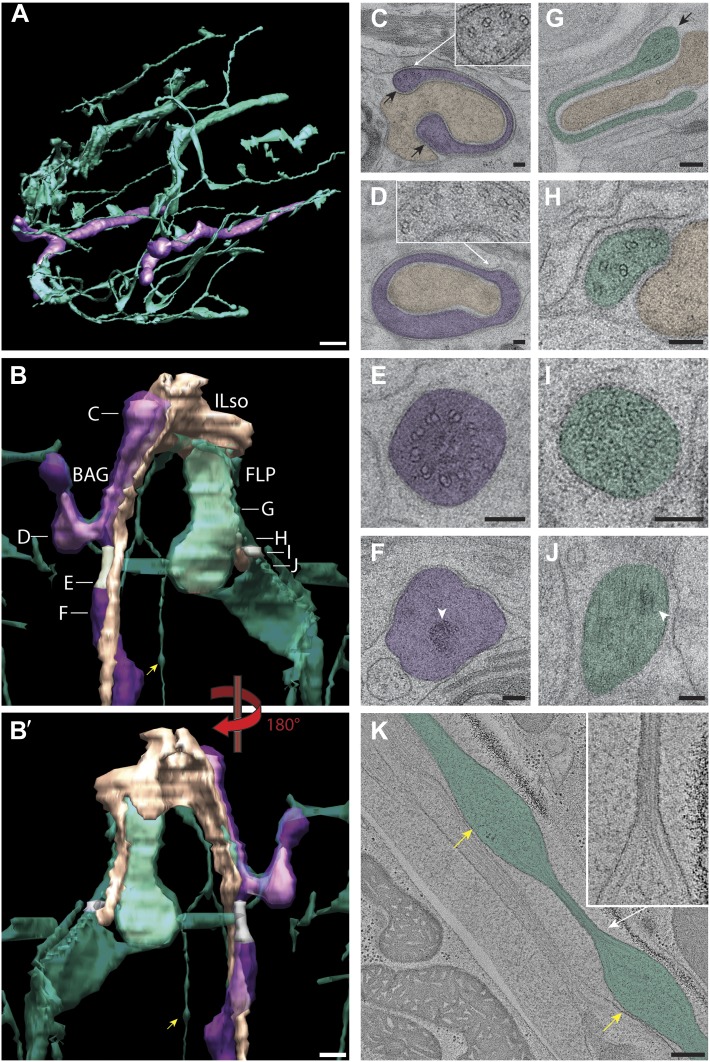
Figure 15.
Ultrastructure of BAG and FLP cilia.
( A ) 3D reconstruction model of BAG (purple) and FLP (green) sensory endings. BAG and FLP sensory endings are positioned laterally. FLP has an extensive dendritic branching network. Scale bar: 1 u00b...
Video 7.
3D reconstruction model of BAG and FLP cilia associated with the ILso process.
DOI: http://dx.doi.org/10.7554/eLife.01948.035
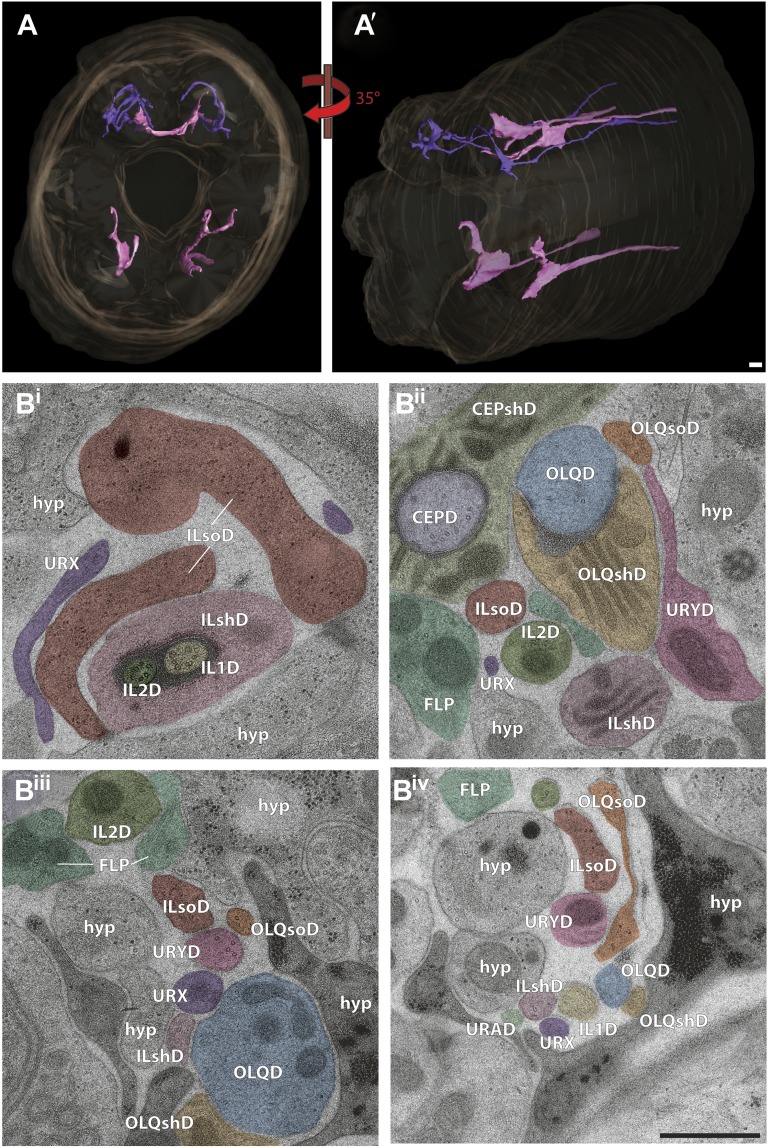
Figure 16.
Non-ciliated endings of URX and URY.
( A and Au2032 ) 3D reconstruction of two dorsal URX (purple) and four dorsal and ventral URY (pink) dendritic endings. ( B iu2013iv ) Selected cross-sections from distal ( B i ) to proximal ( B iv )....
Figure images are served from the NIH/NLM PubMed Central Open Access Subset or Europe PMC; copyright remains with the publishers and authors.
💬 Discussion
0 commentsNo comments yet. Be the first to start a discussion!
Leave a Comment