Abstract
Current optical microscope objectives of low magnification have low numerical aperture and therefore have too little depth resolution and discrimination to perform well in confocal and nonlinear microscopy. This is a serious limitation in important areas, including the phenotypic screening of human genes in transgenic mice by study of embryos undergoing advanced organogenesis. We have built an optical lens system for 3D imaging of objects up to 6 mm wide and 3 mm thick with depth resolution of only a few microns instead of the tens of microns currently attained, allowing sub-cellular detail to be resolved throughout the volume. We present this lens, called the Mesolens, with performance data and images from biological specimens including confocal images of whole fixed and intact fluorescently-stained 12.5-day old mouse embryos.
🔬 Techniques
🔭 Microscopes
💻 Software
✨ Fluorophores
🧪 Sample Preparation
🔬 Cell Lines
🏭 Microscope Brands
🧪 Reagent Suppliers
📷 Detectors
🔎 Objectives
🎨 Filters
💻 Software Details
📋 Protocols
💾 Data Repositories
🏛️ Research Organizations (ROR)
Affiliated research institutions:
📋 Methods
The Mesolens The excitation and detection beam path for laser scanning confocal microscopy with the Mesolens is illustrated in Figure 1 . The excitation light was provided by a fiber-coupled multi-line laser system (Laserbank, Cairn Research), comprising 405 nm, 488 nm, 514 nm, 532 nm, 561 nm and 637 nm wavelengths. The laser was expanded using an f=−25 mm lens (LC1054, Thorlabs) and an f=+125 mm lens (LA1986-A, Thorlabs), propagated through an f=+50 mm lens (LA1131-A) and directed towards the scanning system using a periscope. An 80/30 beamsplitter (PBSW-532, Thorlabs) formed the lower mirror of the 1 m periscope, and the top mirror (Thorlabs BB2-E02) steered the beam towards a large-aperture f=+1000 mm achromatic doublet lens (LA1779-A-ML, Thorlabs) to collimate the light before reaching the scan mirrors. The scanning mirrors directed the light through the scan lens and the Mesolens focused the light into the specimen. The reflected light or fluorescence signal from the specimen was propagated back through the Mesolens, scan lens, scanning system and periscope, and was transmitted through the beamsplitter, chosen to transmit 80% of the (unpolarised) fluorescence emission and reflect 30% of the linearly polarized laser beam. The signal was collected using an f=+75 mm lens (LA1608-A, Thorlabs) and focused through the imaging iris using a non-infinity corrected 10x objective lens (10 OA 25, Comar Optics). The total magnification of the system was 1440, and the confocal iris was set to 1 Airy unit = 1.7 mm. A two-channel PMT system was built for two-colour imaging, with each PMT having its own imaging iris. The PMT used for the images in Figures 2b and 4b–c , and Figure 4—figure supplements 1 , 2 and Figure 5—figure supplement 1 was a PMM02, (Thorlabs) and for Figure 5 and Video 2 a Senstech P30-09 was used for the red channel and Senstech P30-01 was used for the green channel. The bandpass filters were chosen to match the emission wavelengths of the fluorescent dyes in the specimen (and were removed for reflection imaging). Images were digitized using a PCI-6110 (National Instruments) multifunction DAQ card with a 12 bit, 5 MHz, simultaneous sampling A/D converter and 16 bit, 4 MHz, D/A converter. For optimum scanning rate and stability, a sine wave scan waveform (max. 66 Hz), was used, with the first half of each cycle digitized and remapped to obtain a linear image field. The system was controlled using an in-house, laser scanning software package, ‘Mesoscan’, designed to handle 400 megapixel scanned images. Images were stored in the Open Microscopy Environment OME.TIFF format and analysed using ImageJ.
Show full methods section
The Mesolens The excitation and detection beam path for laser scanning confocal microscopy with the Mesolens is illustrated in Figure 1 . The excitation light was provided by a fiber-coupled multi-line laser system (Laserbank, Cairn Research), comprising 405 nm, 488 nm, 514 nm, 532 nm, 561 nm and 637 nm wavelengths. The laser was expanded using an f=−25 mm lens (LC1054, Thorlabs) and an f=+125 mm lens (LA1986-A, Thorlabs), propagated through an f=+50 mm lens (LA1131-A) and directed towards the scanning system using a periscope. An 80/30 beamsplitter (PBSW-532, Thorlabs) formed the lower mirror of the 1 m periscope, and the top mirror (Thorlabs BB2-E02) steered the beam towards a large-aperture f=+1000 mm achromatic doublet lens (LA1779-A-ML, Thorlabs) to collimate the light before reaching the scan mirrors. The scanning mirrors directed the light through the scan lens and the Mesolens focused the light into the specimen. The reflected light or fluorescence signal from the specimen was propagated back through the Mesolens, scan lens, scanning system and periscope, and was transmitted through the beamsplitter, chosen to transmit 80% of the (unpolarised) fluorescence emission and reflect 30% of the linearly polarized laser beam. The signal was collected using an f=+75 mm lens (LA1608-A, Thorlabs) and focused through the imaging iris using a non-infinity corrected 10x objective lens (10 OA 25, Comar Optics). The total magnification of the system was 1440, and the confocal iris was set to 1 Airy unit = 1.7 mm. A two-channel PMT system was built for two-colour imaging, with each PMT having its own imaging iris. The PMT used for the images in Figures 2b and 4b–c , and Figure 4—figure supplements 1 , 2 and Figure 5—figure supplement 1 was a PMM02, (Thorlabs) and for Figure 5 and Video 2 a Senstech P30-09 was used for the red channel and Senstech P30-01 was used for the green channel. The bandpass filters were chosen to match the emission wavelengths of the fluorescent dyes in the specimen (and were removed for reflection imaging). Images were digitized using a PCI-6110 (National Instruments) multifunction DAQ card with a 12 bit, 5 MHz, simultaneous sampling A/D converter and 16 bit, 4 MHz, D/A converter. For optimum scanning rate and stability, a sine wave scan waveform (max. 66 Hz), was used, with the first half of each cycle digitized and remapped to obtain a linear image field. The system was controlled using an in-house, laser scanning software package, ‘Mesoscan’, designed to handle 400 megapixel scanned images. Images were stored in the Open Microscopy Environment OME.TIFF format and analysed using ImageJ.
Resolution measurements
The camera used to capture the bright field image in Figure 2 was a Nikon Ds-Qi1Mc mounted on top of an image magnifier with a 10x objective lens serving as the magnifying lens. Note that this will not enhance the optical resolution of the image but is a way around the lack of a camera with sub-micron pixel size as required for Nyquist sampling of the image. The same method is used for measuring the PSF using fluorescent beads in epi-fluorescence mode. The upright microscope used for comparing the resolution of the Mesolens to that of a low N.A. 5X lens was a Leica DM6000, with an SP5 scanning unit (Leica Microsystems). Wide-field epi-fluorescence measurements were made by using 470 nm from a mercury short–arc source for excitation. The point-spread function of the Mesolens in laser scanning confocal fluorescence mode with oil immersion was measured using 488 nm excitation. The yellow/green-emitting beads used for the resolution measurements were 500 nm diameter beads (17152–10, Polysciences Inc.) for the lateral resolution measurements in laser scanning confocal mode, and for the lateral and axial resolution measurements in wide-field epi-fluorescence mode for the Mesolens, and 1 µm diameter beads (18860–1, Polysciences Inc.) for the remaining resolution measurements respectively. To immobilize the beads they were dried down on to cleaned coverslips and immersed in a Gelvatol medium (341584, Sigma-Aldrich) containing DABCO (diazo-bis-cyclo-octane, 290734, Sigma-Aldrich) as antifade. For the measurement in wide-field epi-fluorescence mode we used a 10x image magnifier as described above and a cooled CCD camera with 6.45 µm pixel size (CoolSnap HQ2, Photometrix). The flatness of field was measured in epi-fluorescence in oil immersion mode using 6 µm fluorescent beads (18862, Polysciences Inc.) dried down on the surface of a mirror serving as a flat substrate. A camera with a 35 mm sensor chip (C3900-024, Hamamatsu) was placed directly on top of the Mesolens via an F-mount, and images were captured using the manufacturer’s software (HCImage, Hamamatsu). Explant culture of rat brain, Figure 3 , Video 1 Explant cultures of embryonic rat brain were prepared and fixed with 2% paraformaldehyde and stained as follows: The nuclei were stained with DAPI, the neurons were stained with Alexa 488 conjugated to an antibody against beta-III tubulin and astrocytes were stained with Alexa 546 conjugated to anti-GFAP. For the fluorescence imaging with this specimen a mercury lamp was used for excitation, with custom filters designed for DAPI, Alexa 488 and Alexa 546 (Chroma). Two different cameras were used to image the same region ( Figure 3 , Video 1 ). A low-power image was made by recording the entire field of the Mesolens on a monochrome 35 mm CCD chip with 10 megapixels, each of 9 µm square (C3900-024, Hamamatsu). Three images, using UV, blue or green excitation from the mercury lamp were merged and coded blue, green and red respectively. A high-power image was made with a small format color camera Nikon DSL1 (used without a magnifier, in contrast to the resolution measurements described above), recording only a 2.2 mm x 1.6 mm portion of the Mesolens field with a square pixel size of 3.4 µm. The theoretical resolution of the Mesolens (0.6 µm) corresponds to 2.4 µm in image space in the camera, so neither camera allowed Nyquist sampling. In the Video 1 , the wide-field epi-fluorescence image is first software-zoomed and then replaced by the image from the smaller format camera, which is further software zoomed and the view is software-panned around the region recorded in the small-format camera. This procedure was necessary to overcome the lack of a camera able to record hundreds of megapixels in a single image. Protocols for staining embryos ( Figures 4 and 5 , Figure 4—figure supplements 1 , 2 and Figure 5—figure supplement 1 , Video 2 and Video 3 ) For the 10 day old embryos in Figures 4 , Figure 4—figure supplements 1 and 2 , embryos were dissected from mouse uteri, fixed in ethanol: acetic acid 3:1 by volume overnight at 4°C and then transferred into aqueous media via a series of ethanol/water mixtures with decreasing ethanol content. The embryos were then stained overnight with acridine orange (0.05% in phosphate-buffered saline), rinsed overnight in PBS, dehydrated with ethanol solutions, cleared in xylene and mounted in Histomount (Fisher Scientific). For the embryo presented in Figure 5 and Figure 5—figure supplement 1 embryos were dissected from mouse uteri, fixed in Dent’s Fix for 24 hr at 4°C, washed 3 times in PBS and then bleached in Dent’s Bleach (for 24 hr) at 4°C. Embryos were then rinsed 5 times in methanol, and fixed in Dent’s Fix (for 24 hr) at 4°C and stored at 4°C until staining. For antibody staining, embryos were rinsed 3 times in PBS, then washed 5 times in PBS for 1 hr per wash at room temperature. Mouse anti-Tubb3 (beta-III-tubulin) primary antibodies (Sigma-Aldrich T5076-200UL; 1:250 concentration) were applied in blocking solution (Bovine Serum Albumin (BSA)), overnight at room temperature, after which the embryos were rinsed 3 times in PBS, then washed 5 times in PBS, for 1 hr per wash at room temperature. Subsequently, rabbit anti-mouse secondary antibodies (1:250) conjugated to Alexa 594 (Invitrogen) were applied in blocking solution (BSA), overnight at room temperature, after which the embryos were rinsed 3 times in PBS, then washed 5 times in PBS, for 1 hr per wash at room temperature. For optical clearing, embryos were first dehydrated by removing half of the PBS and replacing with methanol for 5 min. They were then washed 3 times in methanol for 20 min per wash and then half of the methanol was removed and replaced with 1:2 benzyl alcohol:benzyl benzoate (BABB) for 5 min. Finally, embryos were cleared in 100% BABB overnight at 4°C and were stored in BABB at room temperature until re-staining with acridine orange. All the washing, staining and clearing steps were done with the sample on a rocker. The embryos were then stained with nuclear stain acridine Orange as follows. The embryos were transferred from BABB to PBS via a series of solvents. First, the embryo was transferred to xylene, and left to soak in several changes of xylene to remove the BABB over a period of days. It was then transferred from xylene to three changes of absolute ethanol, then 90% ethanol, 10% water by volume, then 75% ethanol, 50% ethanol and finally into distilled water (with at least 10 min in each change). Acridine orange powder was dissolved in PBS to a pale yellow solution. The embryo was left in the staining solution overnight with gentle rolling on a slow turntable. The embryo was then washed in two changes of PBS over an hour and passed through the same series of alcohols up to xylene and then rolled in BABB overnight. These embryos were imaged in BABB. Imaging parameters for the embryos ( Figures 4 , 5 , Figure 4—figure supplements 1 , 2 and Video 2 ) The images in Figures 4b,c , Figure 4—figure supplements 1 and 2 were acquired using 488 nm excitation with a power of ca 100 µW at the sample plane and the signal was detected using a 525/39 nm band pass filter. For Figure 4b / Figure 4—figure supplement 1 we used a pixel size of 1 µm x 1 µm (XZ) a scan speed of 22 lines per second and no frame averaging. For Figure 4c / Figure 4—figure supplement 2 we used a pixel size of 0.5 µm x 0.5 µm (XY) a scan speed of 22 lines per second and a frame average of 4. The low line speed was necessitated by the low bandwidth of the PMT used for the images. The z-stack in Figure 5 / Video 2 / Video 3 was acquired using 488 nm excitation with a power of ca 50 µW at the sample plane and the signal was detected using a 525/39 nm band pass filter for imaging the acridine orange. We used 561 nm excitation with a power of approximately 150 µW at the sample plane and the signal was detected using a 600 nm long pass filter for imaging Alexa 594. We used a pixel size of 1 µm x 1 µm x 3.33 µm (XYZ), a scan speed of 45 lines per second and a frame average of 4. The image for Figure 5—figure supplement 1 was acquired using 488 nm excitation with a power of ca 50 µW at the sample plane and the signal was detected using a 525/39 nm band pass filter for imaging the acridine orange. We used 561 nm excitation with a power of approximately 150 µW at the sample plane and the signal was detected using a 600 nm long pass filter for imaging Alexa 594. We used a pixel size of 1 µm x 10 µm for XZ images and 1 µm x 1 µm for the XY images, a scan speed of 30 lines per second and a frame average of 2. For the image in Figure 4a (acquired on a Leica DM6000 microscope with an SP5 scanning unit) we used a pixel size of 1.44 µm x 1 µm (XZ) and a scan speed of 400 lines per second, and a frame average of 12.
Protocols for staining embryos ( Figures 4 and 5 , Figure 4—figure supplements 1 , 2 and Figure 5—figure supplement 1 , Video 2 and Video 3 ) For the 10 day old embryos in Figures 4 , Figure 4—figure supplements 1 and 2 , embryos were dissected from mouse uteri, fixed in ethanol: acetic acid 3:1 by volume overnight at 4°C and then transferred into aqueous media via a series of ethanol/water mixtures with decreasing ethanol content. The embryos were then stained overnight with acridine orange (0.05% in phosphate-buffered saline), rinsed overnight in PBS, dehydrated with ethanol solutions, cleared in xylene and mounted in Histomount (Fisher Scientific). For the embryo presented in Figure 5 and Figure 5—figure supplement 1 embryos were dissected from mouse uteri, fixed in Dent’s Fix for 24 hr at 4°C, washed 3 times in PBS and then bleached in Dent’s Bleach (for 24 hr) at 4°C. Embryos were then rinsed 5 times in methanol, and fixed in Dent’s Fix (for 24 hr) at 4°C and stored at 4°C until staining. For antibody staining, embryos were rinsed 3 times in PBS, then washed 5 times in PBS for 1 hr per wash at room temperature. Mouse anti-Tubb3 (beta-III-tubulin) primary antibodies (Sigma-Aldrich T5076-200UL; 1:250 concentration) were applied in blocking solution (Bovine Serum Albumin (BSA)), overnight at room temperature, after which the embryos were rinsed 3 times in PBS, then washed 5 times in PBS, for 1 hr per wash at room temperature. Subsequently, rabbit anti-mouse secondary antibodies (1:250) conjugated to Alexa 594 (Invitrogen) were applied in blocking solution (BSA), overnight at room temperature, after which the embryos were rinsed 3 times in PBS, then washed 5 times in PBS, for 1 hr per wash at room temperature. For optical clearing, embryos were first dehydrated by removing half of the PBS and replacing with methanol for 5 min. They were then washed 3 times in methanol for 20 min per wash and then half of the methanol was removed and replaced with 1:2 benzyl alcohol:benzyl benzoate (BABB) for 5 min. Finally, embryos were cleared in 100% BABB overnight at 4°C and were stored in BABB at room temperature until re-staining with acridine orange. All the washing, staining and clearing steps were done with the sample on a rocker. The embryos were then stained with nuclear stain acridine Orange as follows. The embryos were transferred from BABB to PBS via a series of solvents. First, the embryo was transferred to xylene, and left to soak in several changes of xylene to remove the BABB over a period of days. It was then transferred from xylene to three changes of absolute ethanol, then 90% ethanol, 10% water by volume, then 75% ethanol, 50% ethanol and finally into distilled water (with at least 10 min in each change). Acridine orange powder was dissolved in PBS to a pale yellow solution. The embryo was left in the staining solution overnight with gentle rolling on a slow turntable. The embryo was then washed in two changes of PBS over an hour and passed through the same series of alcohols up to xylene and then rolled in BABB overnight. These embryos were imaged in BABB.
📊 Figures
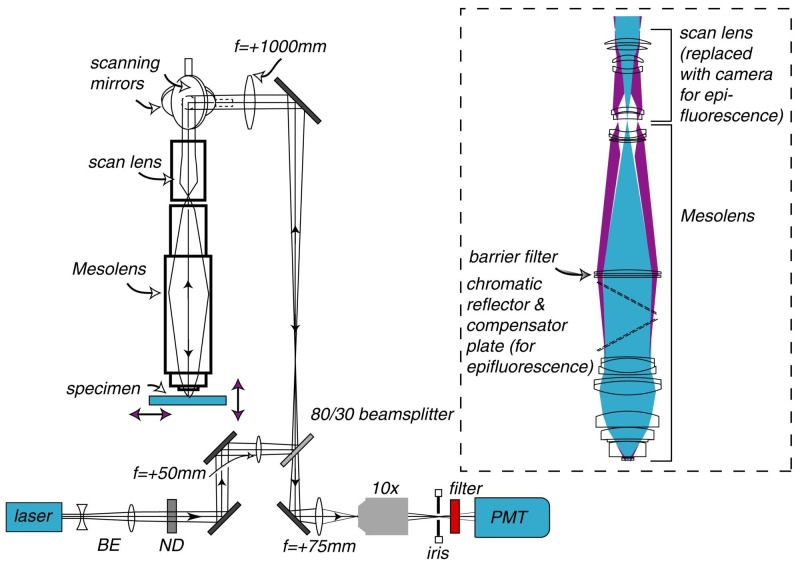
Figure 1.
Schematic diagram of the laser scanning confocal Mesolens system.
BE=beam expander, ND= neutral density filter. Only one detection channel is shown here for ease of presentation. Inset: Illustration of the optical train of the Mesolens and scan lens. Also shown is t...
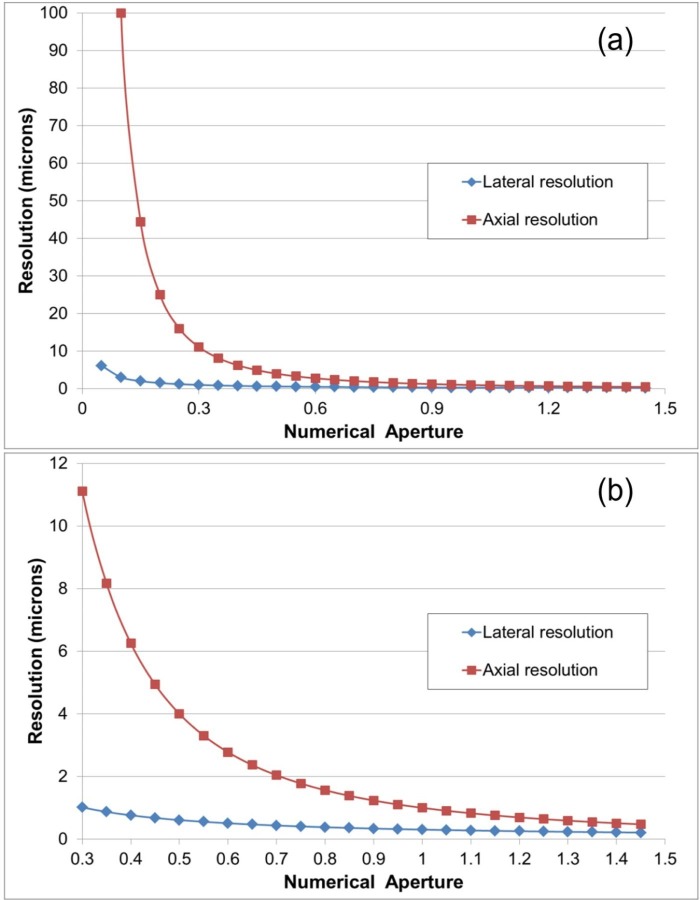
Figure 1u2014figure supplement 1.
Lateral and axial resolution of a dry lens as a function of N.A.
for a wavelength of 500 nm, from Equations 1 and 2 . ( a ) shows the full range of N.A. while ( b ) shows the higher N.A. range only. It is clear that below N.A.=0.45 the axial resolution becomes sign...
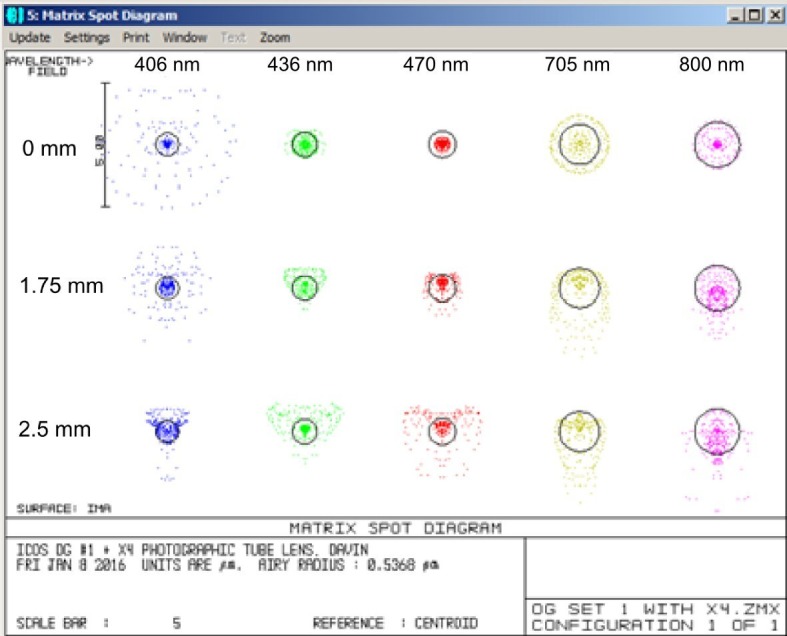
Figure 1u2014figure supplement 2.
Illustration of the excellent chromatic correction of the Mesolens.
Zemax spot diagrams at wavelengths of 405, 436, 470, 705 and 800 nm and at distances of 0, 1.75 and 2.5 mm from the center of the field at the sample plane. The black circles are the Airy disk diamete...
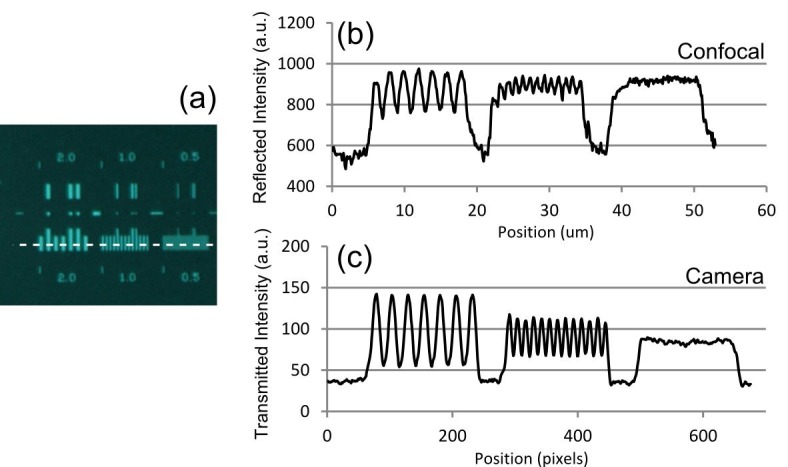
Figure 2.
Optical resolution measurements for the Mesolens.
( a ) shows an image of the specimen consisting of a series of gratings with periods of 2 u00b5m, 1 u00b5m, and 0.5 u00b5m obtained with brightfield illumination and captured in wide-field mode using ...
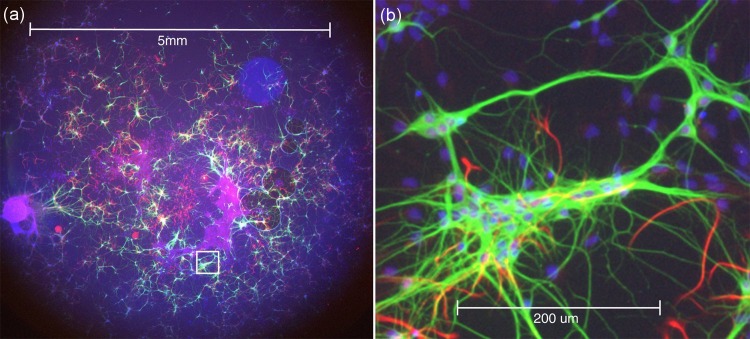
Figure 3.
Wide-field epi-fluorescence imaging of an explant culture of rat embryonic brain as a colour merge of three camera images at the same focus position, demonstrating the excellent colour correction of the Mesolens.
The blue fluorescence is of nuclei stained with DAPI, neurons show green because of Alexa 488 conjugated to an antibody against beta-III tubulin and astrocytes are red because of Alexa 546 conjugated ...
Video 1.
Epi-fluorescence in an explant culture of rat embryonic brain as a colour merge of three camera images at the same focus position.
The blue fluorescence is from nuclei stained with DAPI, neurones show green because of Alexa 488 conjugated to an antibody against beta-III tubulin and astrocytes are red because of Alexa 546 conjugat...
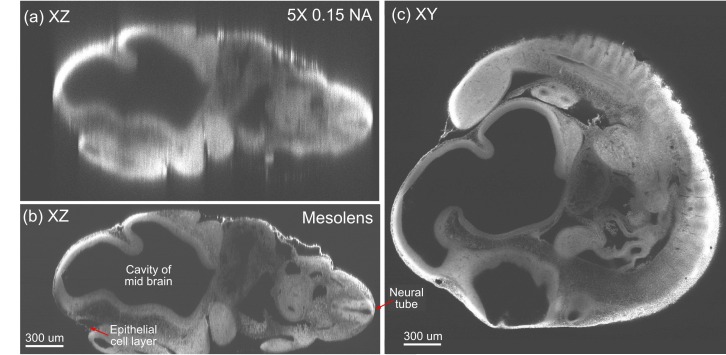
Figure 4.
Optical sectioning of an optically-cleared and fluorescently-stained 10 day old mouse embryo.
( a ) is the embryo imaged in XZ using a dry objective lens of similarly low magnification to the Mesolens (5x/0.15 N.A., HCX PL Fluotar, Leica Microsystems). ( b ) is the same embryo imaged at the sa...
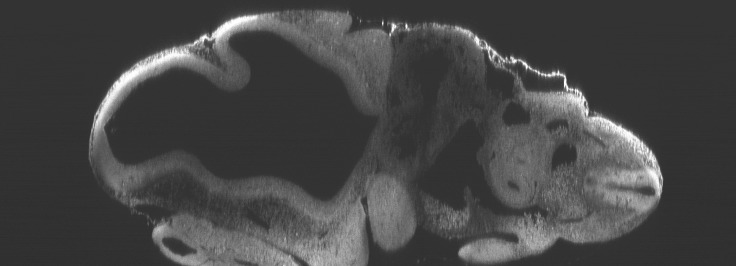
Figure 4u2014figure supplement 1.
Optical sectioning of an optically-cleared and fluorescently-stained 10 day old mouse embryo imaged using the Mesolens.
XZ section. This is the high-resolution version of Figure 4b . DOI: http://dx.doi.org/10.7554/eLife.18659.011
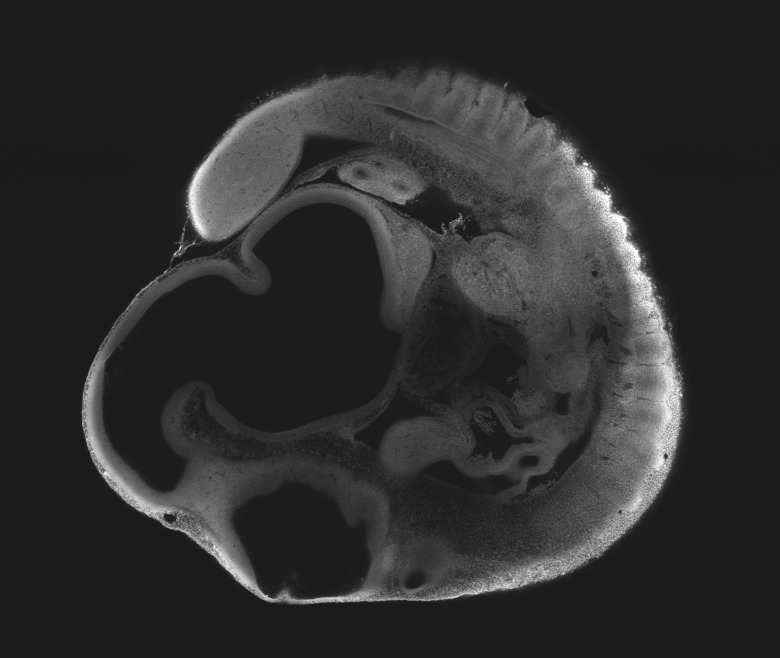
Figure 4u2014figure supplement 2.
Optical sectioning of an optically-cleared and fluorescently-stained 10 day old mouse embryo imaged using the Mesolens.
XY cross section at a depth of around 1 mm. This is the high-resolution version of Figure 4c . DOI: http://dx.doi.org/10.7554/eLife.18659.012
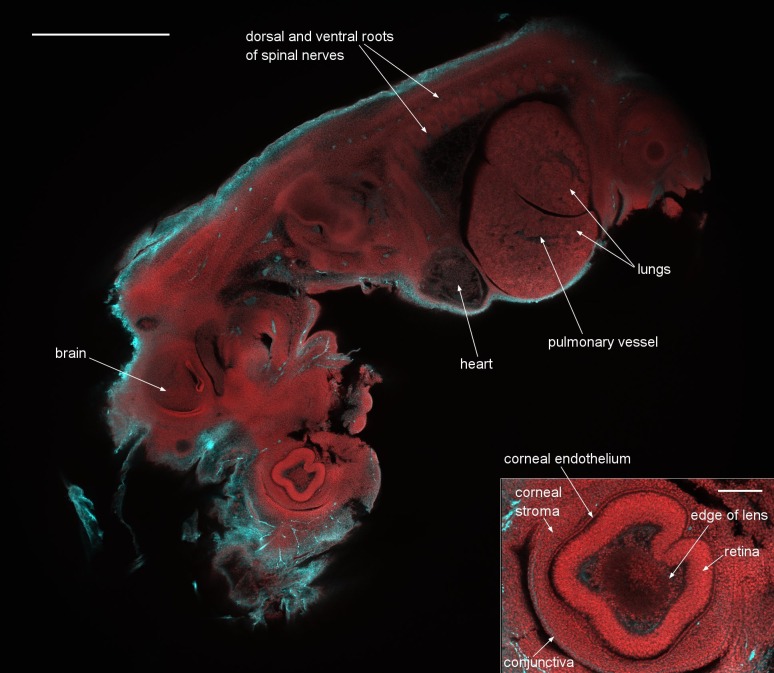
Figure 5.
A dual-colour optical section of a 12.5 day old mouse embryo obtained with the Mesolens in laser scanning confocal mode.
The neuronal axons are stained with Alexa 594 (cyan) and nuclei with acridine orange (red). Scale bar=1 mm. The inset shows a blow-up of the eye region revealing the individual cell nuclei. The image ...
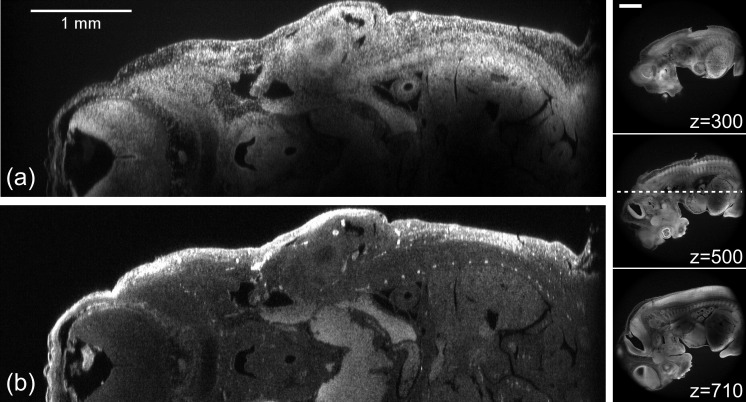
Figure 5u2014figure supplement 1.
Illustration of the high z-resolution throughout the full 6 mm FOV.
( a ) XZ section through 12.5 day old embryo detecting fluorescence from acridine orange. ( b ) The same XZ section detecting fluorescence from Alexa 594. Panels to the right show XY sections at diffe...
Video 2.
The movie is a 3D rendering generated from a z-stack through the eye of a 12.5 day old mouse embryo (the same embryo as in Figure 5 ).
This embryo was stained with an antibody against axonal beta tubulin coupled to the fluorescent dye Alexa 594, to highlight nerve cells, and with acridine orange, here used chiefly as a nuclear marker...
Video 3.
This movie is a highly compressed and lower quality version of Video 2 .
Video 3 has a much smaller file size for quick downloading and viewing. DOI: http://dx.doi.org/10.7554/eLife.18659.016
Author response image 1.
DOI: http://dx.doi.org/10.7554/eLife.18659.017
Figure images are served from the NIH/NLM PubMed Central Open Access Subset or Europe PMC; copyright remains with the publishers and authors.
💬 Discussion
0 commentsNo comments yet. Be the first to start a discussion!
Leave a Comment