Abstract
AbstractThe protein purity is generally checked using SDS‐PAGE, where densitometry could be used to quantify the protein bands. In literature, few studies have been reported using image analysis for the quantification of protein in SDS‐PAGE: that is, imaged with Stain‐Free™ technology. This study presents a protocol of image analysis for electrophoresis gels that allows the quantification of unknown proteins using the molecular weight markers as protein standards. Escherichia coli WK6/pHEN6 encoding the bispecific nanobody CH10‐12 engineered by the Pasteur Institute of Tunisia was cultured in a bioreactor and induced with isopropyl β‐D‐1‐thiogalactopyranoside (IPTG) at 28°C for 12 hr. Periplasmic proteins extracted by osmotic shock were purified by immobilized metal affinity chromatography (IMAC). Images of the SDS‐PAGE gels were analyzed using ImageJ, and the lane profiles were obtained in grayscale and uncalibrated optical density. Protein load and peak area were linearly correlated, and optimal image processing was then performed by background subtraction using the rolling ball algorithm with radius size 250 pixels. No brightness and contrast adjustment was applied. The production of the nanobody CH10‐12 was obtained through a fed‐batch strategy and quantified using the band of 50 kDa in the marker as reference for 750 ng of recombinant protein. The molecular weight marker was used as a sole protein standard for protein quantification in SDS‐PAGE gel images.
🧬 Organisms
🔬 Cell Lines
🏭 Microscope Brands
🧪 Reagent Suppliers
💻 Software Details
🏛️ Research Organizations (ROR)
Affiliated research institutions:
📋 Methods
Nanobody protein
Experiments were conducted with Escherichia coli K12/WK6 {∆(lac‐pro), galE, strA, nal; F’ lacI q Z∆M15, pro+} harboring pHEN6 plasmid (derived from pBR322) encoding the chimeric format of the bispecific nanobody VHH10‐VHHF12 (called CH10‐12), retrieved from the combinatorial libraries. The strain was engineered by the Pasteur Institute of Tunisia (Kraiem, 2018 ). The nanobody CH10‐12 has an estimated molecular weight of 31 kDa, and it neutralizes the toxins present in the groups AahI’ and AahII of the Androctonus australis hector scorpion venom (Hmila et al., 2010 ). Cultures were performed in a 5 L bioreactor (Figure 1 ), Biostat B‐DCU (Sartorius) using glucose as a carbon source in 1.5 L of minimal mineral culture medium (Sunya, Delvigne, Uribelarrea, Molina‐Jouve, & Gorret, 2012 ). The batch phase was conducted at 37°C, and at the depletion of the 10 g/L of initial glucose, a fed‐batch mode was applied with an exponential feed of a glucose solution at 300 g/L, imposing a specific growth rate of µ = 0.38 per hour. Figure 1 Experimental setup and purification steps of the nanobody CH10‐12 Residual glucose and organic acids were quantified by HPLC (Aminex column HPX‐87H, Bio‐rad). Biomass cell dry weight was determined by a gravimetric method using preweighted microcentrifuge tubes (Eppendorf). Protein expression was induced at 23 g cdw/L with 1 mM of isopropyl β‐ d ‐1‐thiogalactopyranoside (IPTG, Sigma‐Aldrich) at 28°C for 12 hr. At induction, the glucose feed rate was set to 4.5 g/hr of glucose imposing a µ ≤ 0.03 per hour. Samples of 25 ml of the cell suspension were taken every 2 hr, and cells were harvested by centrifugation at 8,228 g and 4°C for 8 min. Cells were suspended in 1.8 ml ice‐cold TES buffer (200 mM Tris pH 8.0, 0.5 mM EDTA pH 8.0, 0.5 M Sucrose) and incubated at 4°C for 2 hr under agitation at 350 rpm in a Thermomixer comfort (Eppendorf). The osmotic shock was performed adding 3.2 ml of cold water to the cell suspension and incubated at 4°C for 2 hr under agitation at 350 rpm in a Thermomixer comfort (Eppendorf; Neu & Heppel, 1965 ). After the addition of 46 µl of MgCl 2 2 M (Sigma‐Aldrich), the cell suspension was centrifuged at 8,228 g and 4°C for 30 min and the periplasmic extract was recovered (Pardon et al., 2014 ). Periplasmic proteins were purified by immobilized metal affinity chromatography (IMAC) using His‐Select Nickel Affinity Gel (Sigma‐Aldrich). The nanobody protein was eluted from the column with phosphate‐buffered saline (PBS) and 250 mM Imidazole (Sigma‐Aldrich), pH 7.54. Six elute fractions, of 1 ml each, were obtained and stored at 4°C (Figure 1 ).
Show full methods section
Nanobody protein
Experiments were conducted with Escherichia coli K12/WK6 {∆(lac‐pro), galE, strA, nal; F’ lacI q Z∆M15, pro+} harboring pHEN6 plasmid (derived from pBR322) encoding the chimeric format of the bispecific nanobody VHH10‐VHHF12 (called CH10‐12), retrieved from the combinatorial libraries. The strain was engineered by the Pasteur Institute of Tunisia (Kraiem, 2018 ). The nanobody CH10‐12 has an estimated molecular weight of 31 kDa, and it neutralizes the toxins present in the groups AahI’ and AahII of the Androctonus australis hector scorpion venom (Hmila et al., 2010 ). Cultures were performed in a 5 L bioreactor (Figure 1 ), Biostat B‐DCU (Sartorius) using glucose as a carbon source in 1.5 L of minimal mineral culture medium (Sunya, Delvigne, Uribelarrea, Molina‐Jouve, & Gorret, 2012 ). The batch phase was conducted at 37°C, and at the depletion of the 10 g/L of initial glucose, a fed‐batch mode was applied with an exponential feed of a glucose solution at 300 g/L, imposing a specific growth rate of µ = 0.38 per hour. Figure 1 Experimental setup and purification steps of the nanobody CH10‐12 Residual glucose and organic acids were quantified by HPLC (Aminex column HPX‐87H, Bio‐rad). Biomass cell dry weight was determined by a gravimetric method using preweighted microcentrifuge tubes (Eppendorf). Protein expression was induced at 23 g cdw/L with 1 mM of isopropyl β‐ d ‐1‐thiogalactopyranoside (IPTG, Sigma‐Aldrich) at 28°C for 12 hr. At induction, the glucose feed rate was set to 4.5 g/hr of glucose imposing a µ ≤ 0.03 per hour. Samples of 25 ml of the cell suspension were taken every 2 hr, and cells were harvested by centrifugation at 8,228 g and 4°C for 8 min. Cells were suspended in 1.8 ml ice‐cold TES buffer (200 mM Tris pH 8.0, 0.5 mM EDTA pH 8.0, 0.5 M Sucrose) and incubated at 4°C for 2 hr under agitation at 350 rpm in a Thermomixer comfort (Eppendorf). The osmotic shock was performed adding 3.2 ml of cold water to the cell suspension and incubated at 4°C for 2 hr under agitation at 350 rpm in a Thermomixer comfort (Eppendorf; Neu & Heppel, 1965 ). After the addition of 46 µl of MgCl 2 2 M (Sigma‐Aldrich), the cell suspension was centrifuged at 8,228 g and 4°C for 30 min and the periplasmic extract was recovered (Pardon et al., 2014 ). Periplasmic proteins were purified by immobilized metal affinity chromatography (IMAC) using His‐Select Nickel Affinity Gel (Sigma‐Aldrich). The nanobody protein was eluted from the column with phosphate‐buffered saline (PBS) and 250 mM Imidazole (Sigma‐Aldrich), pH 7.54. Six elute fractions, of 1 ml each, were obtained and stored at 4°C (Figure 1 ).
Protein standards
Three proteins were used as standards: Bovine serum albumin (BSA, Sigma‐Aldrich) lyophilized powder for gel electrophoresis with a molecular weight of 66 kDa; albumin from chicken egg white or ovalbumin (OV, Sigma‐Aldrich) lyophilized powder for gel electrophoresis with a molecular weight of 45 kDa, and carbonic anhydrase from bovine erythrocytes (CA, Sigma‐Aldrich) lyophilized powder for enzyme analysis with a molecular weight of 30 kDa. The BSA is a cheap, well‐known protein commonly used in protein quantification (Bradford, 1976 ). The ovalbumin (OV) and the carbonic anhydrase (CA) have a molecular weight close to that of the protein of interest. A standard of each protein was prepared. The absorbance of each solution was measured in a Nanodrop spectrophotometer 1,000 (Thermo Fisher Scientific) at a wavelength of 280 nm. The Beer–Lambert law was used for the calculation of the final protein concentration of each solution using the percent extinction coefficient ( ε 1% ) of each protein for a wavelength of 280 nm (Equation 1 ). (1) C = A 280 ε 1 % l Concentrations for BSA, CA, and OV were 8.9, 9.1, and 5.9 mg/ml respectively. A mixture of the proteins was prepared by combining 100 µl of each protein standard in a microcentrifuge tube (Eppendorf) for a final concentration of 3 mg/ml for BSA and CA, and 2 mg/ml for OV. Successive dilutions were made from this protein mixture, and five concentrations were prepared, of approximately, 0.01, 0.03, 0.06, 0.1, and 0.3 mg/ml per protein mixture. All protein standards were stored in aliquots at −20°C until use. For the SDS‐PAGE, the ready‐to‐use Precision Plus Protein Unstained Protein Standards (Bio‐rad) were used as molecular weight markers. The marker contains ten recombinant protein bands of 250, 150, 100, 75, 50, 37, 25, 20, 15, and 10 kDa. According to the manufacturer, the protein bands of 75, 50, and 25 kDa are reference markers within the molecular weight marker, as they have three times the intensity of the other bands. Similarly, for a 10 µl lane of molecular weight marker, the band of 50 kDa has 750 ng of protein, and the bands of 20 and 100 kDa have 150 ng of protein, each. The nature of the recombinant proteins in the molecular weight marker is not described by the manufacturer.
SDS‐PAGE
Protein samples were diluted at a ratio 1:1 with Laemmli 2× buffer solution (Bio‐rad) with 5% 2‐mercaptoethanol (Sigma‐Aldrich) as a denaturing agent and heated in a water bath at 90°C for 10 min. Protein samples of 10 µl were poured in the wells of an Any kD Mini‐Protean TGX Stain‐Free™ Precast gel (Bio‐rad). The molecular weight marker was loaded in three wells at 10, 5, and 1 µl without dilution in Laemmli buffer (Figure 2a ). Figure 2 Qualitative analysis made on the gels. (a) Image of the SDS‐PAGE used for the tests. (b) Lane profile and peak area determination Electrophoresis was run at 200 V for 30 min in a Mini‐Protean Tetra cell (Bio‐rad) using TGX running buffer (Bio‐rad). Gels were washed with distilled water and stained with Instant Blue (Expedeon) for 1 hr. Gels were imaged in a Molecular Imager ChemiDoc XRS System (170‐8070, Bio‐rad) under white light epi‐illumination. Images were saved as a TIFF file with a size of 16‐bit and a resolution of 1,392 × 1,040 pixels.
ImageJ
Images were analyzed using ImageJ (NIH), a public domain program from the National Institutes of Health that allows image processing. Images were cropped to 1,070 × 774 pixels to zoom into the gel, equivalent to 0.1493 pixel/µm.
Brightness and contrast adjustments
Brightness and contrast adjustments were made using the automatic function of the program which oversaturates the pixels outside an automatically selected grayscale range. The adjustment is made using the histogram of the image.
Background subtraction
The function for background subtraction in ImageJ is based on the rolling ball algorithm of Sternberg (Sternberg, 1983 ). The algorithm simulates a spherical ball passing under the 3D profile of the optical density of the image. Increasing the size of the rolling ball radius decreases the background subtracted. This function is applied to the entire image. The rolling ball radius size was set to 50, 150, and 250 pixels for the analysis of data processing.
Oversaturation
For each analysis, the oversaturation of the maximal and minimal values of the grayscale was calculated from the histogram of gray values. For 16‐bit images, the histogram represents the results of 256 bins over the range of the grayscale values of the selected image. The oversaturation over black and white, maximal and minimal values, respectively, was made using the smallest and highest bin on the histogram of the entire image.
Densitometry The Gel
Analyzer tool of ImageJ was used to determine the profiles of each lane of the gels. The size of the lane selection tool was 16 pixels wide (Figure 2a ), equivalent to 30% of the total width of the well as suggested by Gassmann et al. ( 2009 ). The lanes were always positioned at the center of the gel lane. The profiles of the lanes were represented as the average of the grayscale values or the uncalibrated optical density along a one‐pixel‐height horizontal lane. The calculation of the uncalibrated optical density uses an 8‐bit copy of the 16‐bit original image, and the grayscale values of the image are used according to Equation 2 . (2) Uncalibrated OD = log 10 255 pixel value From the profile of the lanes, the area of the peaks was created manually, drawing a straight line across the baseline of the profile (Figure 2b ).
📊 Figures
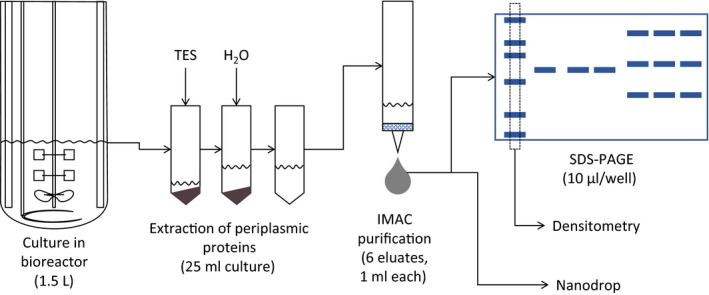
Figure 1
Experimental setup and purification steps of the nanobody CH10u201012
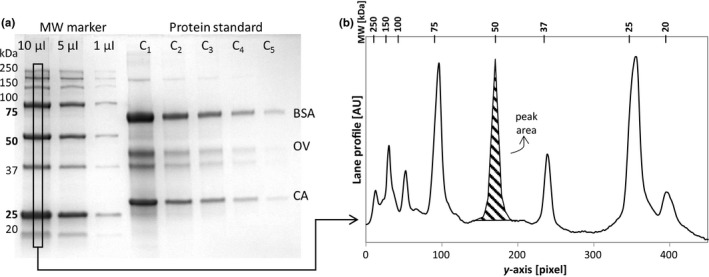
Figure 2
Qualitative analysis made on the gels. (a) Image of the SDSu2010PAGE used for the tests. (b) Lane profile and peak area determination
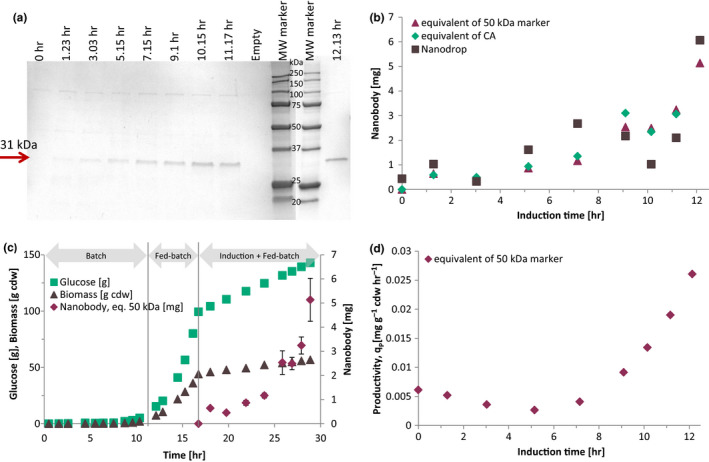
Figure 3
Quantification of a nanobody in SDSu2010PAGE using densitometry. (a) Nanobody identification in SDSu2010PAGE during protein expression. (b) Comparison between quantification using densitometry and nan...
Figure images are served from the NIH/NLM PubMed Central Open Access Subset or Europe PMC; copyright remains with the publishers and authors.
💬 Discussion
0 commentsNo comments yet. Be the first to start a discussion!
Leave a Comment