Abstract
AbstractReplication Protein A (RPA), the major eukaryotic single stranded DNA-binding protein, binds to exposed ssDNA to protect it from nucleases, participates in a myriad of nucleic acid transactions and coordinates the recruitment of other important players. RPA is a heterotrimer and coats long stretches of single-stranded DNA (ssDNA). The precise molecular architecture of the RPA subunits and its DNA binding domains (DBDs) during assembly is poorly understood. Using cryo electron microscopy we obtained a 3D reconstruction of the RPA trimerisation core bound with ssDNA (∼55 kDa) at ∼4.7 Å resolution and a dimeric RPA assembly on ssDNA. FRET-based solution studies reveal dynamic rearrangements of DBDs during coordinated RPA binding and this activity is regulated by phosphorylation at S178 in RPA70. We present a structural model on how dynamic DBDs promote the cooperative assembly of multiple RPAs on long ssDNA.
🔬 Techniques
🔭 Microscopes
🧬 Organisms
💻 Software
✨ Fluorophores
🧪 Sample Preparation
🔬 Cell Lines
🏭 Microscope Brands
🧪 Reagent Suppliers
💻 Software Details
💾 Data Repositories
🏛️ Research Organizations (ROR)
Affiliated research institutions:
📋 Methods
DNA constructs The RPA heterotrimer expression vector was constructed using synthesized RFA1, RFA2 , and RFA3 genes, codon-optimized for expression in Escherichia coli (GeneArt, Invitrogen). Rfa1 ( RFA1 ) was cloned in-frame into the MCS1 of a pRSF-Duet-1 to give a TEV-cleavable His 6 tag, as part of the gene synthesis service (GeneArt). Both Rfa2 ( RFA2 ) and Rfa3 ( RFA3 ) were cloned into pMA after synthesis (GeneArt) and a DNA fragment containing both genes was excised by restriction endonucleases NdeI and AvrII (NEB), purified by gel extraction, and ligated using T4 ligase (NEB) into a pre-digested and purified pRSF-Duet-1- Rfa1 . The resulting plasmid contained Rfa1 in MCS1 and Rfa2/Rfa3 in MCS2. The final expression construct was sequence verified before use. To generate RPA domains for interactions studies, DNA fragments encoding residues 178–294 from Rfa1 and 1–99 from Rfa3 were amplified using the RPA expression plasmid (or the mutants) as a template and Phusion high fidelity DNA polymerase master mix (NEB) following the manufacturer’s instructions. Primers used are listed in Supplementary Table 1 . The DNA fragments were purified and cloned into a pOPINJ vector (a kind gift from Ray Owens, Addgene plasmid 26045) using In-Fusion enzyme (Clonetech, Takara) according to the manufacturer’s instructions and ref. 47 . The lowercase sequence in the primers refers to the homologous region required for In-Fusion cloning into pOPINJ. The plasmids were sequence-verified prior to their use. Mutagenesis The DBD-A and DBD-E point mutants were generated using inverse PCR-based directed mutagenesis using CloneAmp DNA polymerase master mix (Takara) and the RPA complex expression vector as a template. The oligonulceotides used are listed in Supplementary Table 1 . Mutagenesis was achieved by PCR using CloneAmp polymerase mix (Takara) and the manufacturers’ instructions with an annealing temperature of 55 °C. Products were DpnI (NEB) treated to remove template and DNA purified using PCR purification (GeneJet, Thermo), followed by In-Fusion (Takara) before transformation into chemically competent NEB10-Beta E. coli (NEB). Clones were cultivated on LB agar supplemented with kanamycin (35 mg/l). The DNA from several clones were purified and checked by sequencing for the introduction of the mutations. The phosphomimetic Rfa1 -S178D mutant was generated using PCR-based site-directed mutagenesis using Pfu Turbo DNA polymerase (Stratagene) and the RPA expression vector as a template. The oligonulceotides used are listed in Supplementary Table 1 .
Show full methods section
DNA constructs The RPA heterotrimer expression vector was constructed using synthesized RFA1, RFA2 , and RFA3 genes, codon-optimized for expression in Escherichia coli (GeneArt, Invitrogen). Rfa1 ( RFA1 ) was cloned in-frame into the MCS1 of a pRSF-Duet-1 to give a TEV-cleavable His 6 tag, as part of the gene synthesis service (GeneArt). Both Rfa2 ( RFA2 ) and Rfa3 ( RFA3 ) were cloned into pMA after synthesis (GeneArt) and a DNA fragment containing both genes was excised by restriction endonucleases NdeI and AvrII (NEB), purified by gel extraction, and ligated using T4 ligase (NEB) into a pre-digested and purified pRSF-Duet-1- Rfa1 . The resulting plasmid contained Rfa1 in MCS1 and Rfa2/Rfa3 in MCS2. The final expression construct was sequence verified before use. To generate RPA domains for interactions studies, DNA fragments encoding residues 178–294 from Rfa1 and 1–99 from Rfa3 were amplified using the RPA expression plasmid (or the mutants) as a template and Phusion high fidelity DNA polymerase master mix (NEB) following the manufacturer’s instructions. Primers used are listed in Supplementary Table 1 . The DNA fragments were purified and cloned into a pOPINJ vector (a kind gift from Ray Owens, Addgene plasmid 26045) using In-Fusion enzyme (Clonetech, Takara) according to the manufacturer’s instructions and ref. 47 . The lowercase sequence in the primers refers to the homologous region required for In-Fusion cloning into pOPINJ. The plasmids were sequence-verified prior to their use. Mutagenesis The DBD-A and DBD-E point mutants were generated using inverse PCR-based directed mutagenesis using CloneAmp DNA polymerase master mix (Takara) and the RPA complex expression vector as a template. The oligonulceotides used are listed in Supplementary Table 1 . Mutagenesis was achieved by PCR using CloneAmp polymerase mix (Takara) and the manufacturers’ instructions with an annealing temperature of 55 °C. Products were DpnI (NEB) treated to remove template and DNA purified using PCR purification (GeneJet, Thermo), followed by In-Fusion (Takara) before transformation into chemically competent NEB10-Beta E. coli (NEB). Clones were cultivated on LB agar supplemented with kanamycin (35 mg/l). The DNA from several clones were purified and checked by sequencing for the introduction of the mutations. The phosphomimetic Rfa1 -S178D mutant was generated using PCR-based site-directed mutagenesis using Pfu Turbo DNA polymerase (Stratagene) and the RPA expression vector as a template. The oligonulceotides used are listed in Supplementary Table 1 .
Mutagenesis
PCR was achieved using 18 cycles of 95 °C for 1 min; 95 °C for 50 s; 55 °C for 50 s; 68 °C, 9 min, with a final cycle with extension time of 7 min. The products were Dpn1 (NEB) treated to remove parental methylated template and checked by agarose gel electrophoresis before being transformed into cloning efficiency DH5α E. coli . Clones were cultivated on LB agar supplemented with kanamycin (35 mg/l). The DNA from several clones were purified and checked by sequencing for the introduction of the mutation. Single-stranded poly-T oligonucleotides were purchased from IDT, as either 5′ 6-FAM or 5′ Cy5 dT 100 or unmodified dT 100 as well as 5′Cy5-dT 7 . Expression and purification of RPA The RPA expression vector (or mutants of) was transformed into BL21 (DE3) E. coli . Transformants were selected using kanamycin and a single colony per liter was used to inoculate LB supplemented with kanamycin (34 mg/l) and incubate overnight at 37 °C without shaking. Once an OD 600 nm between 0.1 and 0.3 was reached the culture was shaken at 190 rpm for several hours until an OD 600 nm of 0.5–0.8. RPA expression was induced by the addition of 0.3 mM (final) IPTG at 37 °C for 3 h. Cells were harvested by centrifugation at 5000× g and either frozen at −80 °C until further use or were re-suspended in J0 buffer (30 mM HEPES pH 7.8, 0.5% myo -inositol, 0.02% Tween-20) supplemented with 500 mM NaCl and lysed by sonication. The lysate was clarified by high-speed centrifugation for 1 h at 20,000× g . The clarified lysate was filtered using a 0.45 μm syringe filter prior to loading onto a pre-equilibrated (with J0 with 500 mM NaCl) Ni-NTA column. Once the sample was loaded into the NiNTA, the column was washed with 10 column volumes (CV) of equilibration buffer (J0, supplemented with 500 mM NaCl), followed by 10CV of wash buffer (J0 supplemented with 750 mM NaCl and 40 mM Imidazole) and finally 10CV of J0. RPA was eluted with elution buffer (J0 supplemented with 250 mM Imidazole pH 8.0). The fractions containing RPA were pooled and dialyzed overnight at 4 °C in J0 buffer. The dialyzed RPA solution was further purified by anion exchange. The sample was loaded onto a HiTrap Q column (GE healthcare) equilibrated with J0 buffer and was washed sequentially with 1CV J0 buffer containing 50 mM KCl and 1CV of J0 supplemented 100 mM KCl. The protein is eluted with J0 buffer containing 400 mM KCl. At this point RPA was assessed as >95% pure by SDS–PAGE. Finally, RPA was polished by gel filtration (S200 16/60) in 20 mM HEPES, pH 7.8, 1.5 M NaCl, 2 mM DTT. The peak fractions containing RPA were pooled and concentrated by ultrafiltration together with buffer exchange, to remove the high concentration of NaCl, resulting in concentrated protein in 20 mM HEPES, pH 7.8, 300 mM NaCl, 1 mM DTT, and 0.5% glycerol. The presence of contaminating endogenous E.coli DNA was monitored by the absorbance ration between 260 nm/280 nm, which was ~0.6 for the purified RPA proteins. Protein was flash frozen in liquid nitrogen and stored at −80 °C until use.
Expression and purification of fluorescent variants of RPA
The plasmid expressing all three subunits of RPA (a kind gift from Dr. Marc S. Wold, University of Iowa) was modified to substitute the two original Amber stop codons with Ochre stop codon (TAA) using Q5 site-directed mutagenesis (EANP-scRPA-70-32-14). To generate plasmid for purification of RPA-Dbd-A 4AZP , Threonine 211 at RPA 70 was substituted with TAG stop codon and a 6x poly-histidine tag was incorporated at the C-terminus of RPA 70 (EANP-scRPA-70 A-4AZP -32-14). Similarly, to generate plasmid for purification of RPA-Dbd-D 4AZP , Tryptophan at position 101 of RPA32 was substituted with TAG stop codon and a 6x poly-histidine tag was incorporated at the C-terminus of RPA 32 (EANP-scRPA70-32 4AZP -14). Serine at position 178 of RPA 70 was substituted with aspartic acid (S178D) using Q5 site-directed mutagenesis. EANP-scRPA-70 A-4AZP -32-14 and EANP-scRPA70-32 4AZP -14 were used as template plasmids to generate RPA-S178D-DBD-A 4AZP and RPA-S178D-DBD-D 4AZP , respectively. Appropriate RPA plasmid (mentioned above) was cotransformed with pDule2-pCNF in BL21Ai cells. All RPA variants were expressed and purified to near homogeneity using immobilized metal affinity chromatography, anionic exchange using Q-sepharose and Heparin columns, sequentially, and finally by size-exclusion chromatography (SEC) using a Superdex S200 column 48 . All chromatographic steps were performed at 4 °C. Labeling proteins with fluorophores RPA variants carrying 4-AZP were labeled with Cy3 or Cy5 39 , 48 . Approximately 3 ml of RPA 4-AZP (10 μM) was incubated on a rocker with a 1.5-fold molar excess (15 μM) of either DBCO-Cy3 or DBCO-Cy5 for 2 h at 4 °C. Labeled RPA variants were separated from excess dye using a Biogel-P4 gel filtration column (65 ml bed volume) using storage buffer (30 mM HEPES, pH 7.8, 100 mM KCl, and 10% (v/v) glycerol). Fractions containing labeled RPA were pooled, concentrated using a 30 kDa cut-off spin concentrator and flash frozen using liquid nitrogen. Fluorescent RPA were stored at −80 °C. Labeling efficiency was calculated using absorption values measured at 280 nm and ε 280 = 98,500 M −1 cm −1 for RPA, at 555 nm with ε 555 = 150,000 M −1 cm −1 for DBCO-Cy3, and at 650 nm with ε 650 = 250,000 M −1 cm −1 for DBCO-Cy5 fluorophores. Expression and purification of DBD-A and DBD-E Both GST-DBD-A and GST-DBD-E, and mutants thereof, were expressed in BL21 (DE3) E. coli . Owing to the constitutive overexpression of these constructs in E. coli , a single colony of transformants was picked and inoculated into a liter of LB supplemented with ampicillin (50 mg/l) and incubated at 37 °C without shaking overnight. The following morning the cultures were agitated at 180 rpm until mid-logarithmic phase (OD 600 nm = 0.5–0.8) and the temperature reduced to 20–16 °C and incubated overnight with shaking. Cells were harvested by centrifugation at 5000× g and were frozen at −80 °C until further use. Cells were re-suspended in modified Tris-buffered saline (TBS; 50 mM Tris–HCl, 150 mM NaCl, 0.5 mM TCEP, pH 7.4) and lysed by sonication. Given that these constructs are 3C-cleavable GST fusions, proteins were purified using glutahione sepharose 4B (GE Healthcare) and standard procedures. Once the GST-fusion proteins were adsorbed, the domains were liberated using on-column 3C cleavage overnight at 4 °C and the resulting eluent was further purified by SEC at 4 °C. The protein was concentrated and stored in 20 mM Tris, pH 7.4, 150 mM NaCl and was either used immediately or flash frozen in liquid nitrogen for storage at −80 °C.
Preparation of RPA–ssDNA nucleoprotein complexes Purified
ScRPA was mixed with dT 100 , resuspended in water, at a molar ratio of 5:1 for RPA:DNA and incubated on ice for 20 min. The RPA–ssDNA complexes were purified away from free RPA by SEC using a Superose 6 (10/30) in 20 mM Tris–HCl, 150 mM NaCl, 1 mM TCEP, pH 7.4 at 4 °C. We monitored two wavelengths, 260 and 280 nm, to assess the protein and DNA content of the elution peaks. SEC-MALS For SEC protein samples (two times the loop volume, 200 μl) were injected onto either a Superose 6 increase column (10/30 GE Healthcare) for RPA–ssDNA complexes or Superdex S200 (10.30 GE Heathcare) for Apo-RPA, mounted on a high-pressure liquid chromatography system (1260 Infinity; Agilent). Protein samples were taken from the central peak fraction of a previous preparative gel filtration and were resolved using 20 mM Tris–HCl, pH 7.5, 150 mM NaCl, 0.5 mM TCEP at 25 °C. Real-time light scattering and refractive index were simultaneously measured (Helios-II, T-rEX; Wyatt). The Astra software package was used for data analysis (Wyatt).
Electron microscopy grid preparation
Grids for cryo-EM data acquisition were prepared by depositing 3 μl of freshly purified RPA-dT 100 complex (concentration ~0.5 mg/ml), in 20 mM Tris–HCl, 150 mM NaCl, 1 mM DTT, pH 7.4) onto glow-discharged holey-carbon Quantifoil R2/2 copper grids. Samples were vitrified in liquid ethane at liquid nitrogen temperature using a Vitrobot Mk IV (FEI) set with a waiting time of 30 s and a blotting time of 1 s. Plunge freezing was performed at 4 °C and 100% humidity.
CryoEM data collection
For the RPA WT -dT 100 complexes, a set of 1300 micrographs (dataset 1), fractionated into 24 frames, were acquired at NeCEN (Leiden, Netherlands) on a Titan Krios microscope. For the RPA S178D -dT 100 complexes, another set of 2700 micrographs (dataset 2), fractionated into 41 frames, were acquired at eBIC (Oxfordshire, UK) on a Titan Krios. For both datasets, the microscopes were operated at an acceleration voltage of 300 kV with the specimen at cryogenic temperatures (approximately −180 °C) with images recorded at 1–4 µm underfocus on a K2 Summit direct electron detector at a nominal magnification of ~130,000, resulting in a pixel size of 1.06 Å, and a cumulative total electron dose of 50 e – /Å 2 .
CryoEM image processing
Initially, the quality of the micrographs and their power spectrum was assessed by visual inspection. Any images with abnormal background, heavy contamination, thick ice, or low contrast were discarded. Individual movie frames of good micrographs were aligned and dose-weighted using MotionCor2 49 . CTF parameters were estimated with Gctf 50 for the summed micrographs and quality of the images assessed by visual inspection of the summed image alongside the power spectrum. Particle picking was performed with Gautomatch using class averages obtained from negative stain images collected in house, or from later 2D classes from a subset of manually selected particle dataset. Subsequent image processing was performed in Relion 2.1 (ref. 51 ). RPA reconstructions Although the WT and S178D are subtly different, the Tri-C region is consistent between these datasets and therefore we use both datasets to reconstruct a high-resolution structure of the Tri-C of RPA. Approximately 600,000 particles were picked using Gautomatch from dataset 1 (WT) and were extracted in boxes 160 × 160 pixels. Images were binned twice and subjected to several rounds of 2D classification, removing junk and noisy particles after each round. Selection of the best 2D classes resulted in a set of ~310,000 particles, which were further processed by 3D classification into four classes using an ab initio model generated in CryoSPARC 52 and filtered to 60 Å as a start model. The particles that gave the most detailed classes were combined prior to 3D auto-refinement. The particles that were used for the final refinement were re-extracted 120 × 120 boxes. The final reconstruction was refined using 180,723 particles to resolution of 5.8 Å using a soft mask and post-processing in Relion. For dataset 2 (S178D), ~1.3M particles were picked using gautomatch with templates re-projected from the previous reconstruction. The particles were extracted in boxes 120 × 1620 pixels. Images were binned twice and subjected to a round of 2D classification showing good classes similar to dataset 1. After removing junk and noisy particles after this step ~1M particles remained. Due to the large number of particles, we split the particle.star file into batches containing ~110K particles in each and subjected these to rounds of 3D classification (four classes per batch) using the previous model (filtered to 15 Å) as a reference. 3D classes with good features were selected and the particle.star files of each good 3D class joined in Relion resulting in a final set of ~161K particles. We refined this dataset and reached a global resolution of 5.5 Å after post-processing, which showed helices and recognizable features for this protein. We subsequently joined the two datasets together and performed a global refinement with a filtered mask with a soft edge. This resulted in a final reconstruction, after post-processing in Relion, with a global resolution of 4.7 Å, which has more clear secondary structure features and the occasional side-chain expected at this resolution. The reconstruction and refinement scheme is outlined in Supplementary Fig. 3 . Global estimates of resolution, as well as local resolution, were calculated in Relion using the gold-standard Fourier shell correlation criterion (FSC = 0.143) 53 . The RPA WT -dimer reconstruction followed a similar processing strategy as the Tri-C and is summarized in Supplementary Fig. 3 . Briefly, particles were picked using Gautomatch and extracted in boxes 240 × 240 pixels. Several rounds of 2D and 3D classifications produced a single set of particles that was used for 3D refinement. Analogously to the Tri-C reconstruction a CryoSPARC ab initio model, filtered to 60 Å was used as a start model. A single class (class 1) containing 32,583 particles was refined in Relion to a resolution of 7.5 Å. Structural features were improved using a Local Agreement Filtering Algorithm for Transmission EM Reconstructions ( https://github.com/StructuralBiology-ICLMedicine —personal communication Kailash Ramlaul and Christopher H. S. Aylett). Global estimates of resolution were calculated in EMAN using gold standard Fourier Shell Correlation Criterion (FSC = 0.143) and local resolution estimates using ResMap. Model building The S. cerevisiae RPA Tri-C 4.7 Å map showed clear secondary structure elements and β-barrels of OB-folds, which allowed the unambiguous rigid-body fitting of either human and fungal crystal structures. To interpret our density with a yeast model, we created several homology models of Rfa1 (DBD-A, DBD-B, and DBD-C), Rfa2 (DBD-D) using Swiss-model or Phyre2 54 . An Rfa3 (DBD-E), homology model was obtained using the Rosetta server 55 . The subunits of the human crystal structure (pdb 1L1O) were replaced with the yeast homology models by superposition. The poly-dT oligonucleotide was taken from pdb 4GOP, extended with additional nucleotides in COOT and merged with the protein subunit models. The Tri-C with ssDNA model was flexibly fitted to the density using MDFF 33 using NAMD and implemented in VMD. For MDFF the map was converted to Situs format using IMAGIC 56 and the initial structure and secondary structure restraints for NAMD prepared using the VMD. A 50 ps MDFF simulation was performed before the resulting energy minimized structure was further refined using 150 cycles of Jelly-Body refinement in Refmac5 34 implemented in CCPEM 35 and five cycles of real-space refinement in Phenix 36 imposing secondary structure restraints. Microscale thermophoresis (MST) MST experiments were performed using a Monolith NT.115 instrument (NanoTemper Technologies, Germany) at room temperature. MST-binding buffer (20 mM Tris, pH 7.5, 150 mM NaCl, 0.5 mM TCEP) was used for all experiments. In all cases premium treated capillaries were used and the experiment conducted at 25 °C. MST data was either analyzed in NanoTemper Analysis 1.2.101 software or GraphPad Prism. In either case the data were fitted with the Hill equation, with the Hill coefficient constrained to 1 where 1:1 binding is expected. Each experiment was technically repeated at least three or more times and the mean half effective concentration (EC 50 ) values were calculated with standard error (SE). MST with ssDNA RPA–ssDNA interaction studies used synthetic DNA oligos purchased from IDT with either a 6-FAM or Cy5 5′ fluorophore. The fluorescently labeled DNA, in binding buffer, was diluted to a concentration of 100 nM and mixed with an equal volume of a serial dilution series of RPA or the phosphomimetic mutant RPA S178D and incubated at room temperature for 20 min before loading into MST capillaries. For ssDNA binding to individual DBD-A domains, 100 nM of Cy5-labeled dT 7 , diluted in MST-binding buffer, was mixed with equal volumes of a dilution series of DBD-A or DBD-A S178D , also in MST-binding buffer. Single MST experiments were performed using 20–30% LED power and 80% MST power with a wait time of 5 s, laser on time of 30 s and a back-diffusion time of 5 s. MST of DBD-A–DBD-E interactions Purified DBD-E, or its mutants, was labeled via its free cysteine residues using Monolith NT protein-labeling Kit Blue-Cys NT-495 (NanoTemper) and purified according to manufacturers instructions. 50 nM of labeled DBD-E, in MST-binding buffer, was mixed with equal volumes of a dilution series of DBD-A or DBD-A S178D also in MST-binding buffer supplemented with 0.01% Tween-20 and 0.1 mg/ml BSA, to prevent non-specific binding, and incubated at room temperature for 20 min before loading into MST capillaries. Single MST experiments were performed using 80% LED power and 80% MST power with a wait time of 5 s, laser on time of 15 s and a back-diffusion time of 5 s. DNA electrophoretic mobility shift assay (EMSA) Binding assays were carried out in 20 μl. 50 nM of 5′ Cy5-labeled dT 100 in binding buffer (20 mM Tris, pH 7.5, 150 mM NaCl, 10 mM MgCl 2 , 0.01% Tween-20) and was added to a serial dilution of RPA (protein concentration range, 5.8 μM–11 nM). A no protein control was also prepared. Binding reactions were incubated at room temperature for 30 min before mixing with 1 μl of bromophenol blue loading buffer. 5 μl of samples were loaded into a non-denaturing Tris–borate 5% polyacrylamide gel, pre-run for 1 h. Gels were run for 90 min at 100 V. The DNA was visualized using in-gel fluorescence using a ChemiDoc gel imaging system (Bio-Rad). FRET-based assay for RPA DNA extension FRET based-assays were used to monitor the effect of scRPA and scRPA S178D binding on DNA conformations using methods previously described 57 . A Cary Eclipse Fluorimeter was used to excite Cy3 and observe Cy3 and Cy5 emission. The Cy3 excitation wavelength was set to 530 nm and emission was measured at 565 nm. Cy5 excitation was caused by the energy transfer from Cy3 and its emission was measured at 660 nm. Excitation and emission slit widths were all set to 10 nm. Experiments were carried out in Reaction buffer (50 mM Tris–HCl, pH 7.5, 5 mM MgCl, 100 mM NaCl, 1 mM DTT, and 0.1 mg/ml BSA) at 25 °C. The effect of RPA binding on DNA conformation was tested by measuring the starting FRET level of free FRET-labeled ssDNA substrates and titrating increasing concentrations of RPA. The Cy3/Cy5-labeled ssDNA oligonucleotides were synthesized by IDT (Coralville, IA) and are shown in Supplementary Table 1 . The 5′ terminal Cy5 dye is attached to the hydroxyl group of the ribose, and the internal Cy3 and Cy5 dyes are incorporated into the backbone between the bases. 10 nM of each FRET substrate was added to Reaction buffer and starting FRET was measured. Increasing concentrations of scRPA and scRPA S178D were titrated into the reaction and FRET was monitored. For each FRET substrate the FRET levels start higher, as free DNA forms a compact flexible structure in our reaction buffer, bringing the fluorophores closer together. As scRPA or scRPA S178D is added FRET decreases as the fluorophores move away from each other due to DNA extension. The data for each point are presented as average ± standard deviation for at least three independent experiments. FRET data for the ScRPA binding to dT 30 and dT 90 (5–35) and dT 90 (11–41) were fit to two-segment lines to determine the binding stoichiometry ( X 0 ). Binding of the ScRPA S178D to dT 30 was fit to a quadratic-binding equation, whilst the interaction between ScRPA and dT 90 (1–30) was analyzed using a Hill equation and the assumption that there are three binding sites on the 90-mer oligonucleotide. All analyses were carried out using GraphPad Prism 7.03 software. The results of each fit are presented as a value ± fitting error. FRET analysis of cooperative DNA binding Stopped flow experiments were carried out on a SX-2000 instrument (Applied Photophysics, UK) and performed by premixing 40 nM RPA–DBD-A Cy3 and 40 nM RPA–DDB-D Cy5 in one syringe and rapidly mixing it with 40 nM ssDNA oligonucleotides from another syringe. Oligonucleotides of varying lengths were used [(dT) n ; n = 20, 35, 45, 60, 70, 79, 97, or 140 nt]. Cy3 was excited at 555 nm, and the change in Cy5 emission was monitored using a 645 nm cut-off filter (Newport, CA). DNA-binding data for dT 20 through dT 97 were fit using a two-step model (Kaleidagraph, Synergy Inc., USA), and the data for dT 140 were fit with a one-step model 39 . Reporting summary Further information on experimental design is available in the Nature Research Reporting Summary linked to this article.
Supplementary information Supplementary Information Peer Review File Reporting Summary Source data
Electronic supplementary material Supplementary Information accompanies this paper at 10.1038/s41467-018-07883-7.
📊 Figures
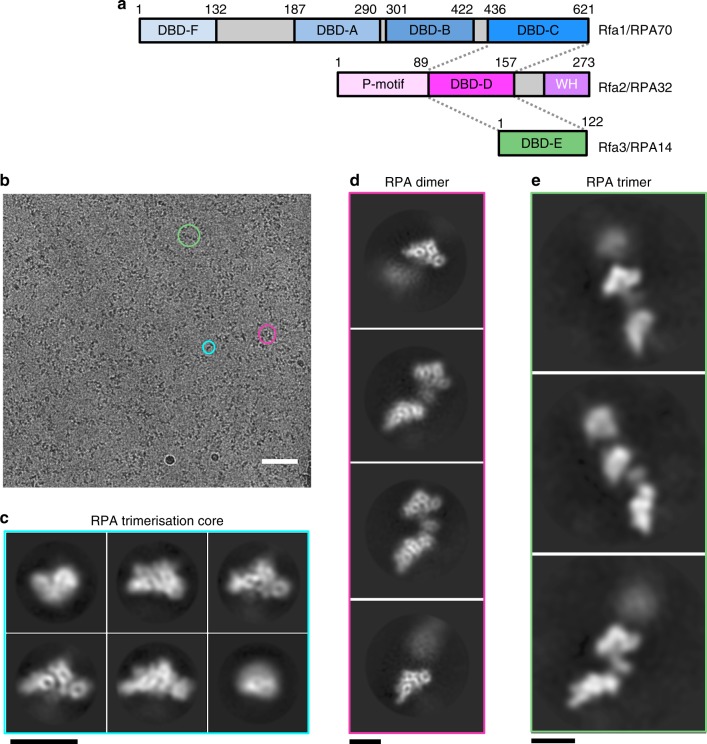
Fig. 1
Cryo-EM image analysis of RPA-coated ssDNA. a Schematic of the RPA subunits Rfa1, Rfa2, and Rfa3 that form the RPA complex. Domains are shown and labeled with those associated in the trimerisation cor...
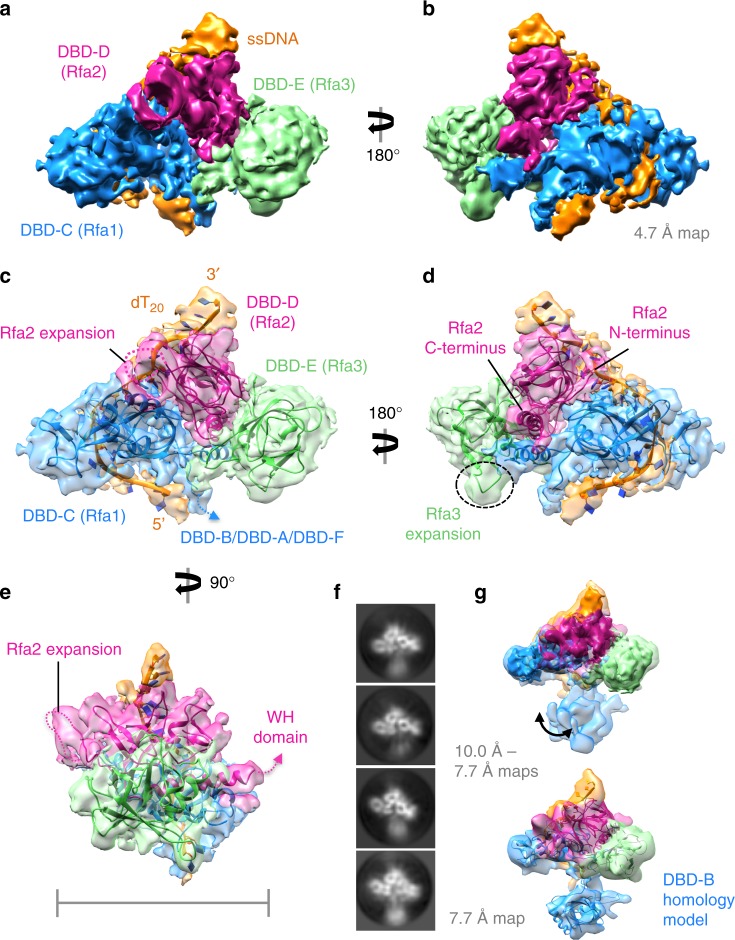
Fig. 2
Cryo-EM structure of ScRPA trimerisation core. a , b Cryo-EM reconstruction of ScRPA trimerisation core determined to 4.7u2009u00c5 resolution by gold standard-FSC, post-processed and sharpened in Rel...
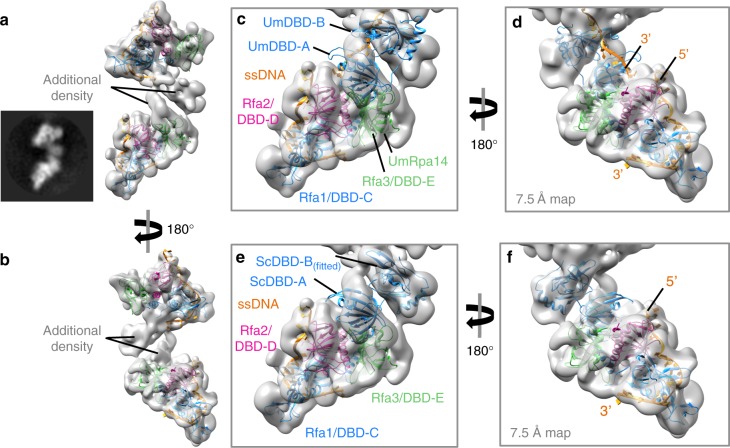
Fig. 3
CryoEM and structural analysis of an RPA dimer on ssDNA. a , b 3D reconstruction of yeast RPA dimer subclass at sub-nanometer resolution (7.5u2009u00c5 by gold standard-FSC). The models fitted in the ...
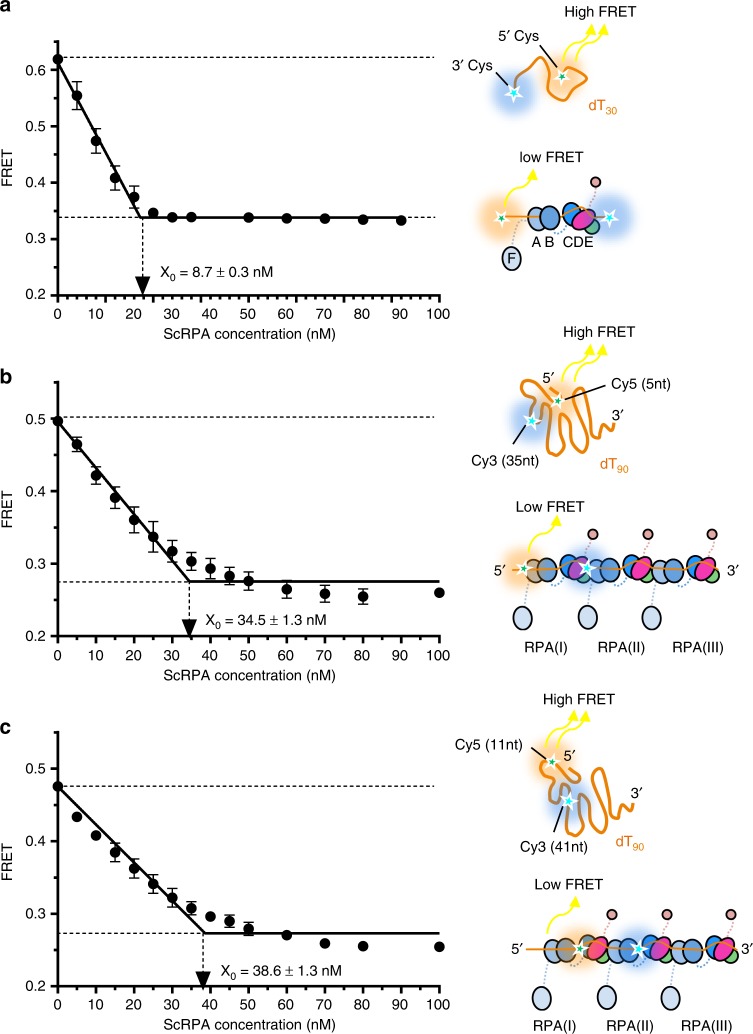
Fig. 4
FRET-based analysis of the RPA-ssDNA complex formation. a Indicated concentrations of ScRPA were added to the solution containing 10u2009nM dT 30 oligo decorated with the Cy3 dye (FRET donor) at the 3...
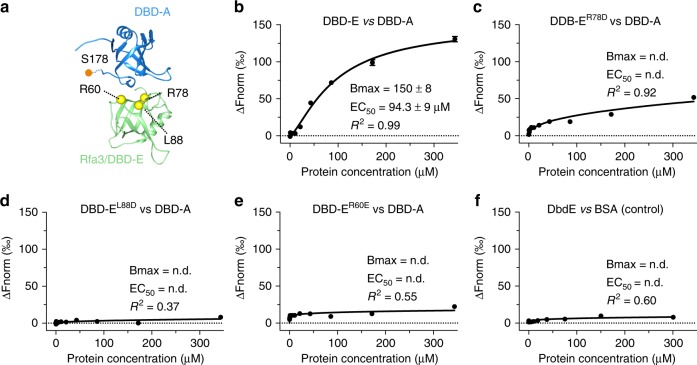
Fig. 5
Investigation of the DBD-Au2013DBD-E interaction. a A proposed model for the interaction between Rfa1-DBD-A (blue) and Rfa3 (green) based upon the interaction interface between Ustilago maydis DBD-A a...
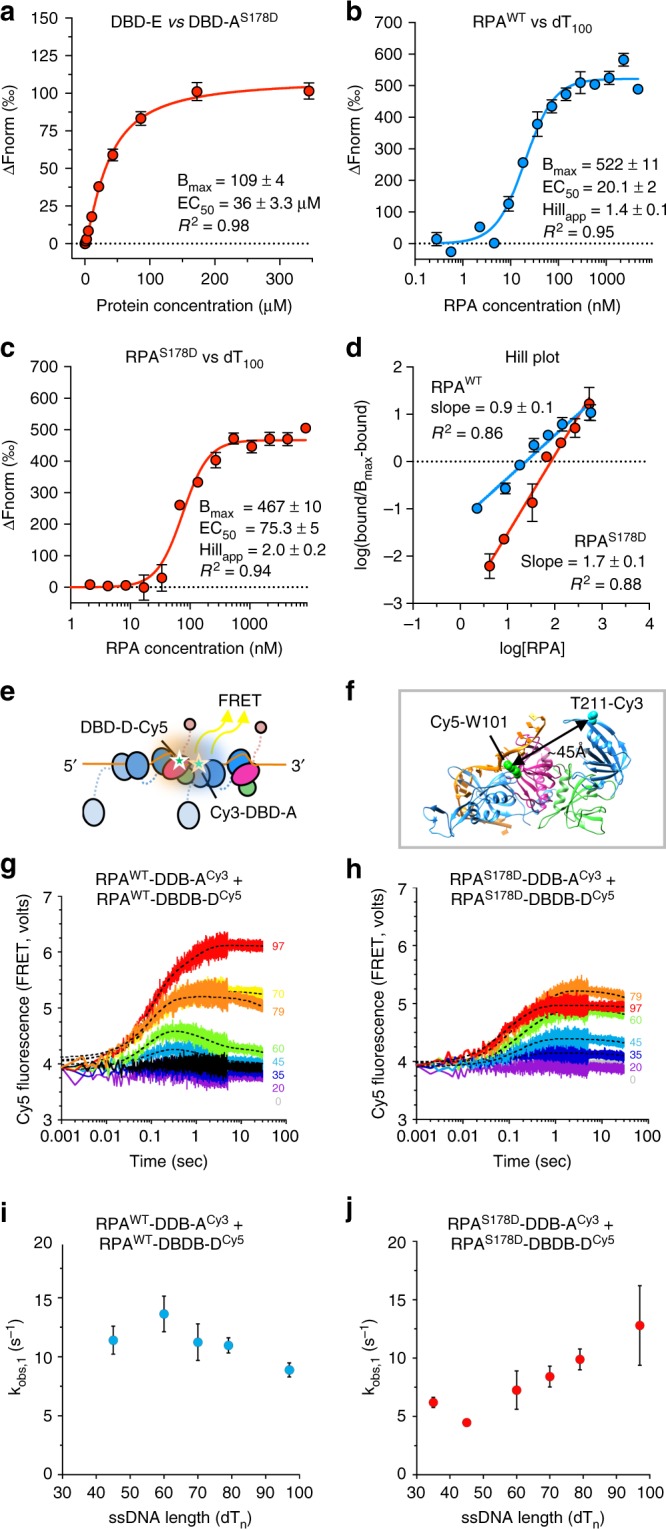
Fig. 6
Biophysical assessment of an Rfa1 phosphomimetic mutant. a Microscale thermophoresis (MST) binding curves of DBD-A S178D mutant versus Rfa3-OB. b , c MST-binding curves of RPA heterotrimeric complexes...
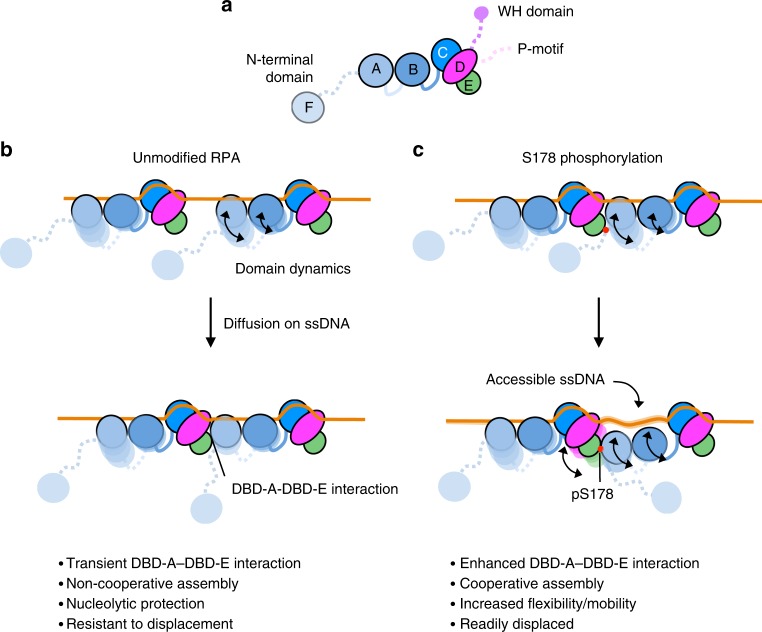
Fig. 7
Proposed model of DBD dynamics when multiple RPAs are associated with ssDNA. a Schematic of yeast RPA (ScRPA) illustrating the DNA-binding domains (DBDs) F, A, B, C, D. Subunits of the RPA heterotrime...
Figure images are served from the NIH/NLM PubMed Central Open Access Subset or Europe PMC; copyright remains with the publishers and authors.
💬 Discussion
0 commentsNo comments yet. Be the first to start a discussion!
Leave a Comment