Abstract
Collagen structure has been shown to influence tumor cell invasion, metastasis and clinical outcome in breast cancer. However, it remains unclear how it affects other solid cancers. Here we utilized multi-photon laser scanning microscopy and Second Harmonic Generation to identify alterations to collagen fiber structure within the tumor stroma of head & neck, esophageal and colorectal cancers. Image segmentation algorithms were then applied to quantitatively characterize these morphological changes, showing that elongated collagen fibers significantly correlated with poor clinical outcome (Log Rank p < 0.05). We used TGF-β treatment to model fibroblast conversion to smooth muscle actin SMA-positive cancer associated fibroblasts (CAFs) and found that these cells induce the formation of elongated collagen fibers in vivo. However, proteomic/transcriptomic analysis of SMA-positive CAFs cultured ex-vivo showed significant heterogeneity in the expression of genes with collagen fibril organizing gene ontology. Notably, stratifying patients according to stromal SMA-positivity and collagen fiber elongation was found to provide a highly significant correlation with poor survival in all 3 cancer types (Log Rank p ≤ 0.003). In summary, we show that increased collagen fiber length correlates with poor patient survival in multiple tumor types and that only a sub-set of SMA-positive CAFs can mediate the formation of this collagen structure.
🔬 Techniques
🔭 Microscopes
💻 Software
✨ Fluorophores
🧪 Sample Preparation
🔬 Cell Lines
🏭 Microscope Brands
🧪 Reagent Suppliers
🔴 Lasers
💻 Software Details
💾 Data Repositories
🏛️ Research Organizations (ROR)
Affiliated research institutions:
📋 Methods
Patient tissues Tissue microarrays
(TMAs) were constructed from previously described cohorts of HNSCC, EAC and CRC patients [ 18 – 20 ] from archival paraffin-embedded material at University Hospital Southampton (UHS), using randomly selected, 1 mm cores (Alphelys MiniCore 3). All tissue collection and storage was handled by a HTA (Human tissue authority) licensed tissue bank, with ethical approval and informed consent obtained (Rec No. 10/H0504/32 & 09/H0504/66). Baseline clinicopathological features and treatment details are shown in Supplementary Table 1 .
SHG Imaging and prognostic correlation testing
Fibrillar collagen was imaged using a custom-built multi-photon laser scanning microscope at the Laboratory for Optical and Computational Instrumentation (LOCI) University of Wisconsin-Madison. A Ti-sapphire (Spectra Physics Mai Tai) laser tuned to 890 nm was focused onto the sample using a 20x air immersion objective (Nikon S Fluor, N.A. = 0.75). Backscattered SHG signal was isolated using a 445–20 band-pass filter (Semrock). All images were acquired using WiscScan, an image acquisition software package developed by LOCI ( http://loci.wisc.edu/software/wiscscan ). Collagen fiber analysis from SHG images was performed using CurveAlign ( http://loci.wisc.edu/software/curvealign ) and CtFIRE ( http://loci.wisc.edu/software/ctfire ), software packages designed at LOCI, as described previously [ 16 ]. 512 × 512 pixel images (457 μm 2 area) were analyzed using each program. For collagen fiber angle measurements CurveAlign analysis was performed using default parameters. For measurements of collagen fiber length CtFIRE analysis was carried out using slight modifications to the default parameters to allow optimal image segmentation: a pixel intensity threshold of 25 was implemented to omit background noise; and the percentile of remaining curvelet coefficients was set to 0.3. For human tissue analysis Hematoxylin & Eosin (H & E) or SMA IHC stained TMAs were used to collect SHG images (20X magnification). For the TMAs constructed from HNSCC and EAC cohorts a representative 457 μm 2 SHG field of view was collected from stromal regions within each tumor core (3–6 tumor cores per patient) and analyzed. For the CRC TMA, large SHG fields of view were collected on the multiphoton using tiling acquisition features built into the WiscScan acquisition system and then loaded into FIJI for stitching [ 22 , 49 ]. Imaging was carried out blinded to clinical outcome. The maximal Youden's index (Sensitivity + Specificity −1) for classifying patients with short survival rates (cancer specific survival < 3 years) was used as a cut-off value for categorical survival analysis.
Show full methods section
Patient tissues Tissue microarrays
(TMAs) were constructed from previously described cohorts of HNSCC, EAC and CRC patients [ 18 – 20 ] from archival paraffin-embedded material at University Hospital Southampton (UHS), using randomly selected, 1 mm cores (Alphelys MiniCore 3). All tissue collection and storage was handled by a HTA (Human tissue authority) licensed tissue bank, with ethical approval and informed consent obtained (Rec No. 10/H0504/32 & 09/H0504/66). Baseline clinicopathological features and treatment details are shown in Supplementary Table 1 .
SHG Imaging and prognostic correlation testing
Fibrillar collagen was imaged using a custom-built multi-photon laser scanning microscope at the Laboratory for Optical and Computational Instrumentation (LOCI) University of Wisconsin-Madison. A Ti-sapphire (Spectra Physics Mai Tai) laser tuned to 890 nm was focused onto the sample using a 20x air immersion objective (Nikon S Fluor, N.A. = 0.75). Backscattered SHG signal was isolated using a 445–20 band-pass filter (Semrock). All images were acquired using WiscScan, an image acquisition software package developed by LOCI ( http://loci.wisc.edu/software/wiscscan ). Collagen fiber analysis from SHG images was performed using CurveAlign ( http://loci.wisc.edu/software/curvealign ) and CtFIRE ( http://loci.wisc.edu/software/ctfire ), software packages designed at LOCI, as described previously [ 16 ]. 512 × 512 pixel images (457 μm 2 area) were analyzed using each program. For collagen fiber angle measurements CurveAlign analysis was performed using default parameters. For measurements of collagen fiber length CtFIRE analysis was carried out using slight modifications to the default parameters to allow optimal image segmentation: a pixel intensity threshold of 25 was implemented to omit background noise; and the percentile of remaining curvelet coefficients was set to 0.3. For human tissue analysis Hematoxylin & Eosin (H & E) or SMA IHC stained TMAs were used to collect SHG images (20X magnification). For the TMAs constructed from HNSCC and EAC cohorts a representative 457 μm 2 SHG field of view was collected from stromal regions within each tumor core (3–6 tumor cores per patient) and analyzed. For the CRC TMA, large SHG fields of view were collected on the multiphoton using tiling acquisition features built into the WiscScan acquisition system and then loaded into FIJI for stitching [ 22 , 49 ]. Imaging was carried out blinded to clinical outcome. The maximal Youden's index (Sensitivity + Specificity −1) for classifying patients with short survival rates (cancer specific survival < 3 years) was used as a cut-off value for categorical survival analysis.
Cell culture Human fetal foreskin fibroblasts
(HFFF2s) were obtained from the European Collection of Cell Cultures (ECACC; http://www.phe-culturecollections.org.uk ) and cultured in Dulbecco's modified eagle medium (DMEM) supplemented with 2 mM L-Glutamine and 10% (v/v) fetal bovine serum (FBS) at 5% CO 2. Adult primary fibroblasts were isolated from normal and EAC tissues (as described previously [ 18 ]) and cultured in Dulbecco's modified eagle medium (DMEM) supplemented with 2 mM L-Glutamine and 10% (v/v) fetal bovine serum (FBS) at 10% CO 2 . The fibroblastic phenotype was characterized by Western blotting to confirm vimentin expression and the absence of pan-cytokeratin/CD31 expression. The source of each NOF and CAF is denoted by a numeric label identifying the patient these cells were extracted from and clinicopathological details of the tumors that the CAFs were extracted from can be found in Supplementary Table 3 . 5PT squamous cancer cells (a cisplatin resistant clone derived from the UM-SCC-5 parental cell line (20), were kindly provided by Prof Ian C. Mackenzie (Barts and the London School of Medicine and Dentistry, UK)). Cells were cultured in Dulbecco's modified eagle medium (DMEM) supplemented with 2 mM L-Glutamine and 10% ( v/v ) fetal bovine serum (FBS). Treatment with 2 ng/ml of human recombinant TGF-β (R & D Systems) for 72 hours was used to induce HFFF2 myofibroblast differentiation. All cell lines were routinely tested for mycoplasma contamination. Fluorescence microscopy 1 × 10 4 fibroblasts were plated on permanox chamber slides (8 chambers/slide; Thermo Scientific) in serum-free DMEM. Cells were fixed (4% w/v PFA), permeabilised (PBS + Triton-X100 (v/v 0.5%) and immunofluorescence for SMA (Sigma) performed using an Alexa 564-conjugated anti-mouse secondary antibody (Invitrogen) Nuclei and actin filaments were visualized using DAPI (1 μg/ml; Molecular Probes) and Phalloidin-FITC (0.5 μg/ml; SIGMA) respectively. Images were taken using an Olympus IX81 fluorescence microscope with a 20X air immersion objective (Olympus UPFLN, N.A. = 0.5). Gel contraction 2 × 10 5 HFFF2 fibroblasts were mixed with 10X DMEM (+ 440 mM sodium bicarbonate); sterile H 2 O; and collagen, type 1, rat tail (Millipore) to form a 1 mg/ml collagen gel (1 ml total volume) [ 18 ]. Gels were imaged after 24 hours. The degree of gel contraction was quantified by measuring gel area (using FIJI [ 22 ]). qPCR RNA was extracted using the RNeasy kit (Qiagen) and reverse transcribed using the RevertAid First Strand cDNA Synthesis Kit with oligodT primers, as per manufacturer's instructions. PCR was performed using 10 ng of cDNA, 2X SYBR green mastermix (Applied Biosytems) and primers (described below) under the following conditions: 95°C hold step for 10 minutes, followed by 40 cycles of 95–60°C for 15 seconds and 5 minutes respectively. Relative levels of mRNA expression were determined using the ddCt method. Primer sequences used were as follows: ACTB (forward TGGCACCCAGCACAATGAA, reverse CTAAGTCATAGTCCGCCTAGAAGCA) as a housekeeping gene; COL1A1 (forward ACGAAGAC ATCCCACCAATCACCT, reverse AGARCACGTCATC GCACAACACCT); COL3A1 (forward AATCAGGTAGA CCCGGACGA, reverse TTCGTCCATCGAAGCC TCTG); GAPDH (forward AGCAATGCCTCCTGCACCA CCAAC, reverse CCGGAGGGGCCATCCACAGTCT); VIM (human not mouse; forward GGACCAGCTAA CCAACGACA, reverse GCAGCTCCTGGATTTCCTCT).
Xenograft model
All experiments were reviewed and approved by both the Science Review Group and the Animal Welfare and Ethical Review Board, University of Southampton, and were carried out under UK Home Office license number PPL30/3028. Animals were obtained from Charles River Laboratories; they were bred and housed in a local animal facility and used between 8–12 weeks of age. 1 × 10 6 5PT ± 3 × 10 6 HFFF2s were suspended in 150 ml of DMEM + 2 mM L-Glutamine. 100 ml of this mix was injected subcutaneously (s.c.) into the flank of partially immunocompromised C57BL/6 RAG1 −/− male mice. Animals were euthanized after 5 weeks. Tumors were removed and fixed in 10% formalin, processed to paraffin and H & E stained. Three independent stromal regions per tumor were imaged by SHG and analyzed using CurveAlign and ctFIRE as described above.
Immunohistochemistry
Automated immunostaining of TMAs was performed in the UHS Clinical Cellular Pathology Laboratory (anti-SMA antibody; M0851, Dako). Staining was evaluated using a semi-quantitative scoring system, as described previously [ 10 ], according to the extent of stromal positivity (low/negative [< 5% stroma positive], moderate [patchy/focal expression, 5–50% stroma positive] or high [diffuse expression throughout tumor, > 50% stroma positive]. Scoring was carried out independently by (GJT & TJU) blinded to clinical outcome.
Gene expression profiling analysis
Gene expression profiling data was from the following publicly available databases was used in this study. Figure 1 : RSEM normalized results from RNASeq data for Patient Matched normal and tumor tissues (HNSCC, EAC and CRC TCGA). Figure S5C : RMA normalized data from affymetrix array profiling of CAFs isolated from HNSCC ( GSE38517 ) and CRC ( GSE46824 ). The data was Log transformed (unless this had already been carried out prior to upload in the databank) and genes within the collagen fibril organization gene ontology term (GO:0030199) were extracted, using the maximal value where multiple probes identified the same gene. Gene pattern software was used for downstream analyses [ 50 ]. Hierarchical clustering was carried out with sample distance measured using a Euclidean distance measure and gene distance by Pearson's correlation [ 51 ]. Differential expression was assessed between normal and tumor samples using comparative marker selection [ 52 ]. Proteomics Specimens were homogenized in 200 μL of dissolution buffer (0.5 M TEAB, 0.05% SDS) using the FastPrep system (Savant Bio, France) and pulsed probe sonication. Lysates were centrifuged (16, 000 g, 10 min, 40C) and supernatants measured for protein content (BCA assay; Thermo Pierce, Rockford, IL, USA). A total of 100 mg final protein content from each specimen was subjected to reduction, alkylation, trypsin proteolysis and 8-plex iTRAQ labeling with the following reporter ion / sample ID assignment: 113/NOF-EN102; 114/NOF2009; 115/NOF-EN251; 116/CAF1807; 117/NOF1807; 118/CAF0801; 119/CAF255; 121/CAF506. The labelled peptide mixtures were pooled and offline separated with high-pH reverse phase (RP) linear gradient chromatography using the Waters, XBridge C8 column (150 × 3.0 mm, 3.5 mm particle) with the UltiMate nano-HPLC system generating a total of 30 fractions (Dionex, Sunnyvale, CA, USA) [ 53 ]. Each fraction was analyzed using LC-MS with low-pH RP capillary chromatography (PepMap C18, 50 μm ID × 50 cm L, 100 Å pore, 3.5 μm particle) and nanospray ionization FT-MS (Dionex Ultimate 3000 UHPLC system - LTQ-Velos Pro Orbitrap Elite, Thermo Scientific, USA) [ 53 , 54 ]. Unprocessed raw files were submitted to Proteome Discoverer 1.4 for target decoy searching with SequestHT for tryptic peptides, allowing two missed cleavages, a tolerance of 10 ppm, a minimum peptide length of 5, and a maximum of 2 variable (1 equal) modifications for: oxidation (M), deamidation (N, Q), or phosphorylation (S, T). Fixed modifications included: Methythio (C) and iTRAQ (K, Y, and N-terminus). Fragment ion mass tolerances of 0.02 Da for the FT-acquired HCD spectra and 0.5 Da for the IT-acquired CID spectra. FDR was estimated with the Percolator and set to ≤ 0.01 and validation was based on q value at < 0.01. Reporter ions were extracted with a tolerance of 20 ppm and were omitted if any channels were absent. Quantification ratios were median-normalized and transformed to the log2 scale. Spectra were searched against the UniProtKB TREMBL mouse proteome (Dec 2013).
Statistical analysis
Statistical analysis of patient survival rates was carried out using SPSS v22 (IBM SPSS Inc., Chicago, IL, USA). The primary endpoint was death from cancer, survival time was measured from the date of diagnosis in the HNSCC cohort and date of surgery in the EAC and CRC cohorts. Other causes of death were censored at the time of death. Kaplan-Meier plots (with Log-rank [Mantel-Cox] tests) and unadjusted Cox proportional hazards models were used to describe the risk of dying from cancer within the indicated stratification metrics, unless otherwise stated. Statistical testing between groups and treatment conditions was carried out using unpaired 2-tailed homoscedastic T -tests, as described in relevant figure legends. * p < 0.05 , ** p < 0.01 , *** p < 0.001 and **** p < 0.0001 .
SUPPLEMENTARY MATERIALS FIGURES, TABLES
📊 Figures
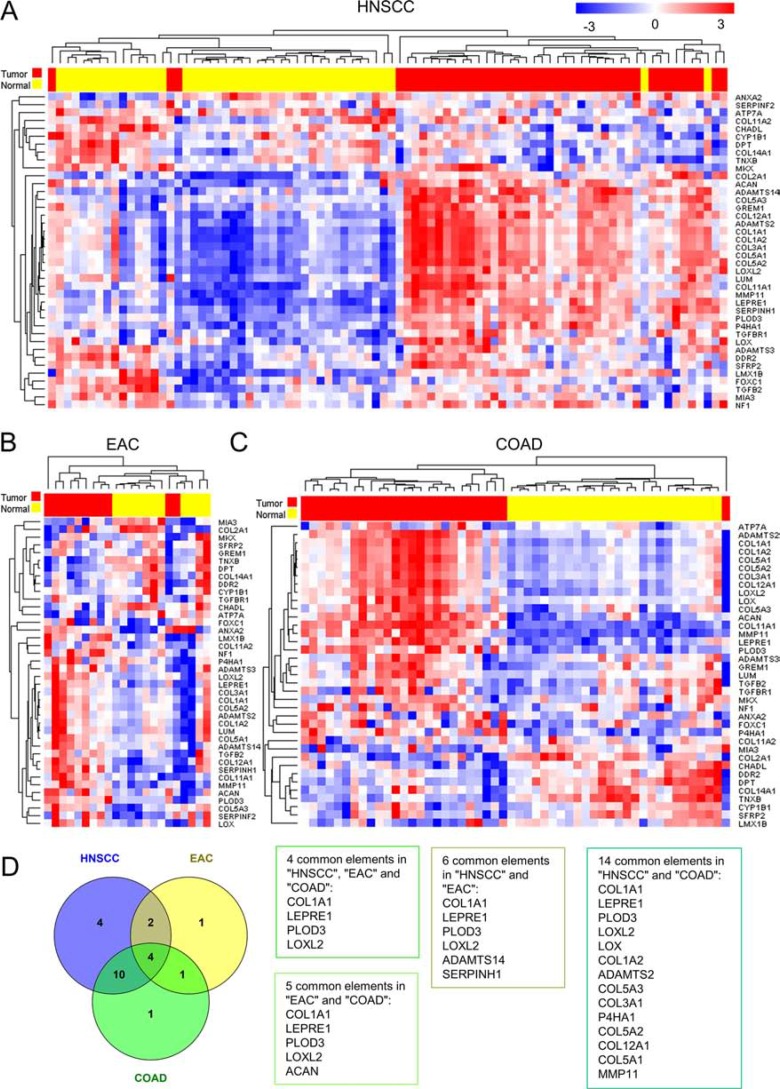
Figure 1
The expression of genes associated with Collagen Fibril Organization Gene (CFOG) ontology (GO:0030199) differentiates between tumor and normal tissue in Head & Neck Squamous cell carcinoma (HNSCC), Esophageal Adenocarcinoma (EAC) and Colon Adenocarcinoma (COAD)
RNA Sequencing data from the Cancer Genome Atlas was used to analyze matched tumor and normal samples. ( Au2013C ) Unsupervised Hierarchical clustering, using a Euclidean distance measure of pairwise ...
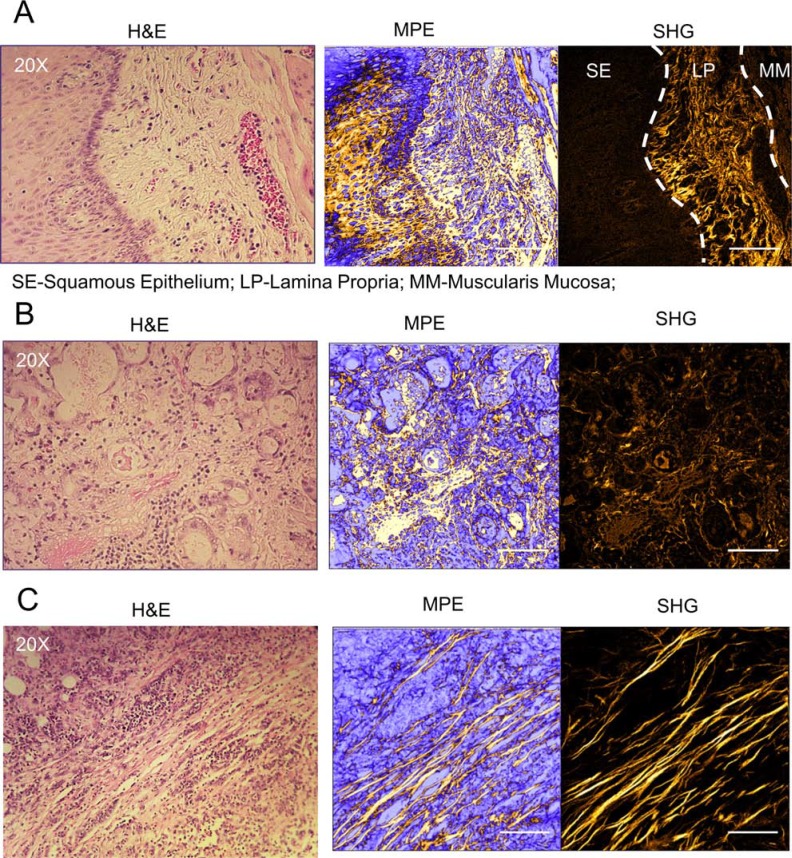
Figure 2
Aligned and elongated collagen fibers are found in the tumor microenvironment
Representative images of collagen fiber morphology in normal squamous epithelium/sub-epithelial stroma ( A ) and sub-mucosal tissue ( B ) from esophageal tissue samples. ( C ) Representative image of ...
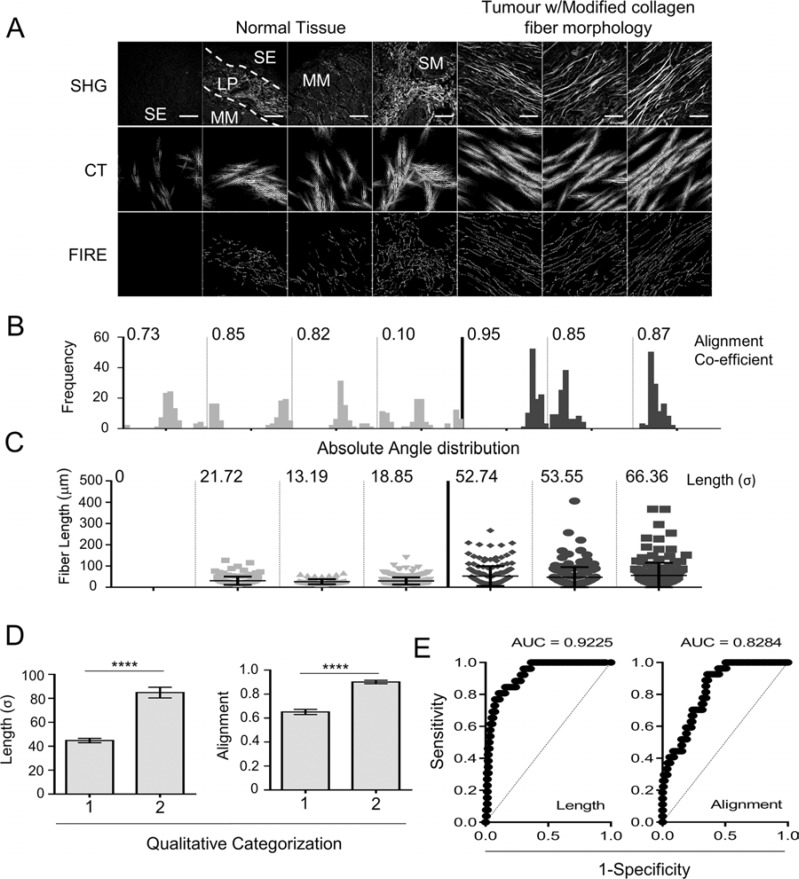
Figure 3
Automated segmentation and quantification of collagen fiber length and alignment can identify the modified collagen stroma observed in tumor tissue
( A ) Image segmentation, SHG images from normal esophageal tissue and EAC are used to identify collagen fibers using curvelet transformation (CT) and fiber extraction (FIRE) algorithms. Reconstructed...
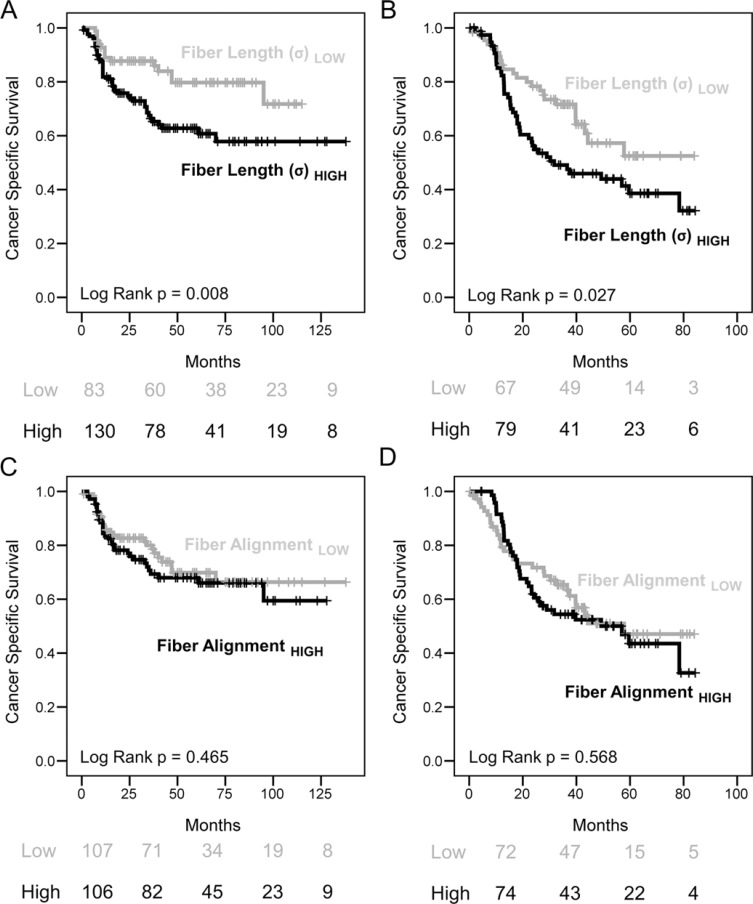
Figure 4
Increased collagen fiber length but not alignment correlates with poor survival rates in HNSCC and EAC
( Au2013D ) Kaplan Meier (KM) plots showing cancer specific survival rates with tables showing the number of patients at risk at 0, 2, 4 and 6 years are shown below. Quantitative measures of collagen ...
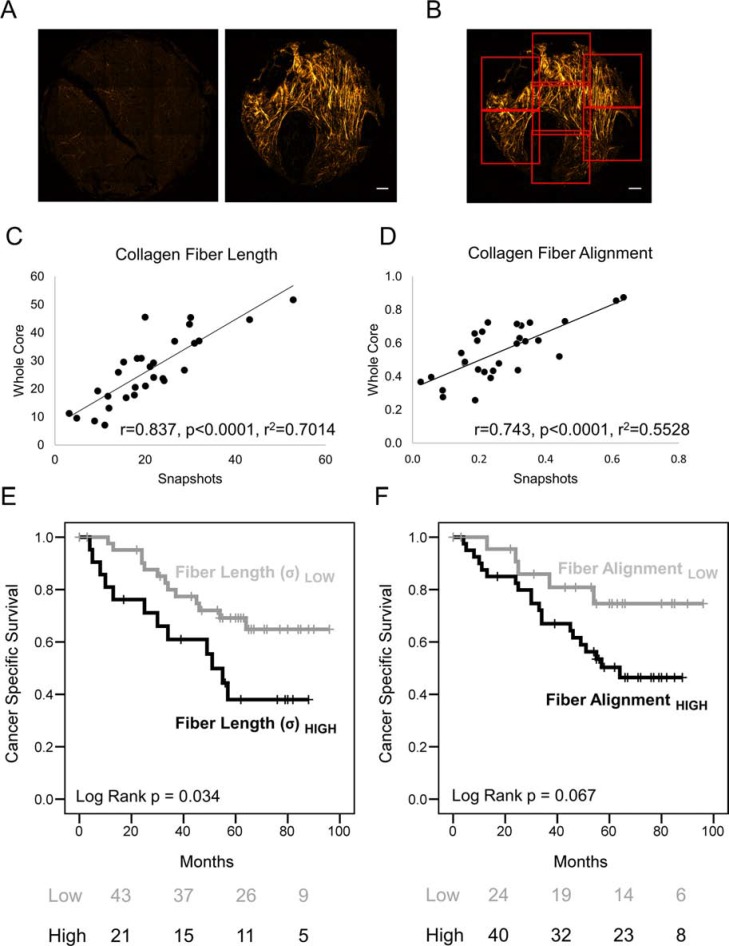
Figure 5
Fully automated measurement of collagen fiber morphology shows increased length correlates with poor prognosis
( A ) Example of stitched SHG images from an entire tumor core with and without evidence of collagen fiber deposition and elongation. Scale Bar represents 100 u03bcm. ( B ) Depiction of automated segm...
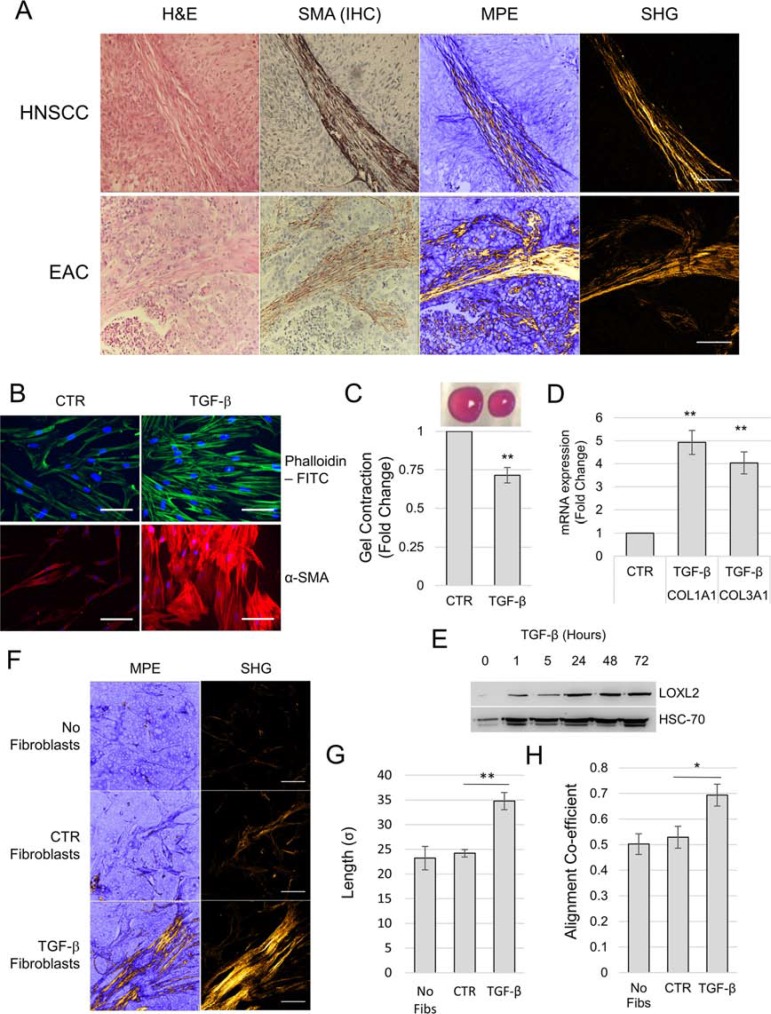
Figure 6
Myofibroblasts/CAFs generate aligned and elongated collagen fibers in vivo
( A ) HNSCC and EAC tissue stained for u03b1-SMA to denote myofibroblasts/CAFs and serial H & E stained sections imaged for SHG. Scale bar represents 100 u03bcm. ( Bu2013D ) Treating human fetal fores...
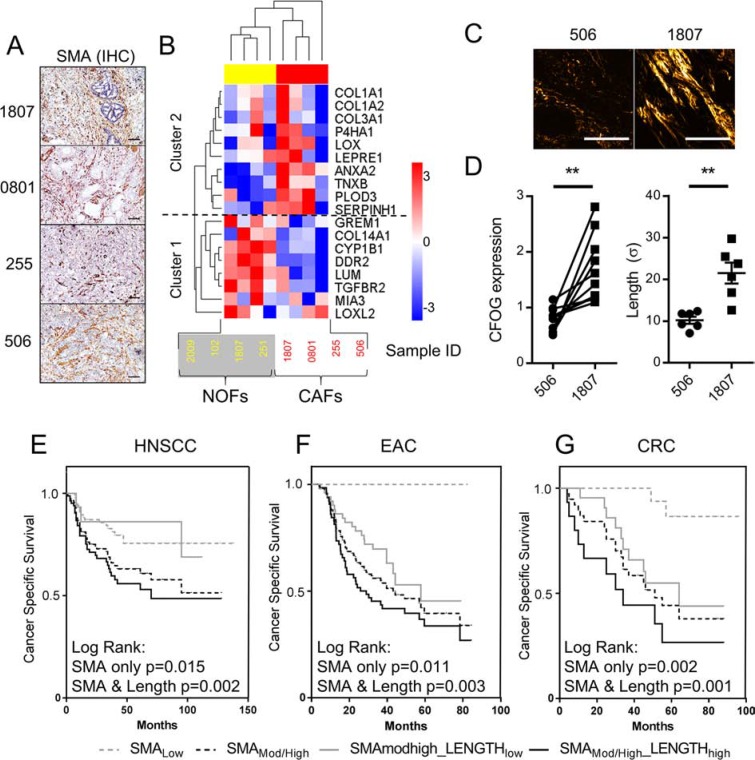
Figure 7
CAFs exhibit significant heterogeneity in the ability to manipulate collagen structure, critically determining patient survival rates
( A ) SMA IHC images showing the tumors from which CAFs were extracted for further analysis. Scale bars represent 100 u03bcm. ( B ) LC-MS analysis of adult esophageal normal and CAFs (NOF (yellow) and...
Figure images are served from the NIH/NLM PubMed Central Open Access Subset or Europe PMC; copyright remains with the publishers and authors.
💬 Discussion
0 commentsNo comments yet. Be the first to start a discussion!
Leave a Comment