Abstract
It is widely assumed that active RNA polymerases track along their templates to produce a transcript. We test this using chromosome conformation capture and human genes switched on rapidly and synchronously by tumour necrosis factor alpha (TNFalpha); one is 221 kbp SAMD4A, which a polymerase takes more than 1 h to transcribe. Ten minutes after stimulation, the SAMD4A promoter comes together with other TNFalpha-responsive promoters. Subsequently, these contacts are lost as new downstream ones appear; contacts are invariably between sequences being transcribed. Super-resolution microscopy confirms that nascent transcripts (detected by RNA fluorescence in situ hybridization) co-localize at relevant times. Results are consistent with an alternative view of transcription: polymerases fixed in factories reel in their respective templates, so different parts of the templates transiently lie together.
🔬 Techniques
✨ Fluorophores
🧪 Sample Preparation
🔬 Cell Lines
🧪 Reagent Suppliers
💾 Data Repositories
🏛️ Research Organizations (ROR)
Affiliated research institutions:
📋 Methods
A detailed description of the experimental procedures is given in Text S1 .
Cell Culture HUVECs from pooled donors
(Lonza) were grown to 80%–90% confluency in Endothelial Basal Medium 2-MV with supplements (EBM; Lonza), starved (18 h) in EBM+0.5% FBS, and treated with TNFα (10 ng/ml; Peprotech) for up to 85 min. In some cases, 50 µM 5,6-dichloro-1- β -D-ribofuranosylbenzimidazole (DRB; Sigma-Aldrich) was added 20 min before harvesting cells. 3C 3C was performed as described [10] . In brief, 10 7 cells were fixed (10 min; room temperature) in 1% paraformaldehyde (Electron Microscopy Sciences), “Dounce”-homogenized, and membranes lyzed (30 min; 4°C) using 0.2% Igepal (Sigma-Aldrich). Nuclei were pelleted and resuspended in the appropriate restriction buffer, incubated (16 h; 37°C) with Sac I or Hind III (800 units/10 6 cells; New England Biolabs), diluted to 8 ml in ligation buffer, T4 DNA ligase added (4,000 units/10 6 cells; New England Biolabs), and incubated (48 h at 4°C, then 20 min at room temperature). After reversing cross-links (16 h; 65°C), DNA was purified by phenol extraction and ethanol precipitation, cut with Bgl II to reduce fragment length, and repurified. 71%–78% restriction sites in the template were cut by Sac I or Hind III (determined as in [31] ). PCR conditions were adjusted so that reactions were within the linear range of amplification (i.e., ∼175 ng template/reaction; 1.75 mM MgCl 2 , 1% dimethylsulphoxide, 10 pmoles of each primer, and GoTaq polymerase (Promega); 95°C for 2 min, then 34 cycles at 95°C for 55 s, 59°C for 45 s, and 72°C for 20 s, followed by one cycle at 72°C for 2 min); amplimers were resolved on 2.5% agarose gels, stained with SYBR Green (Invitrogen), and scanned using an FLA-5000 scanner (Fuji). Identities of all 3C products were confirmed by DNA sequencing (Geneservices, Oxford), except for those in Figure S8 (where identities were confirmed by restriction digestion). Amplification efficiencies were examined using a control template generated by Sac I or Hind III digestion of BAC clones covering GAPDH on HSA12 (RP5-940J5; ImaGenes), SAMD4A , GCH1 (RP11-170J16, CTC-775N1, CTD-2586I5, CTD-2378G4; CHORI, Invitrogen), and TNFAIP2 (CTD-2594N9; Invitrogen) on HSA14, SLC6A5 on HSA11 (RP11-120F6; CHORI), and PTRF on HSA17 (RP11-194N12; CHORI) followed by ligation. This synthetic template was spiked (to reach 175 ng/µl) with HUVEC DNA cut with the relevant restriction enzyme and ligated. Other control templates included non-digested/ligated DNA and digested/non-ligated DNA (both from 10 6 cells). Results shown were reproduced using at least two independently obtained templates.
Show full methods section
A detailed description of the experimental procedures is given in Text S1 .
Cell Culture HUVECs from pooled donors
(Lonza) were grown to 80%–90% confluency in Endothelial Basal Medium 2-MV with supplements (EBM; Lonza), starved (18 h) in EBM+0.5% FBS, and treated with TNFα (10 ng/ml; Peprotech) for up to 85 min. In some cases, 50 µM 5,6-dichloro-1- β -D-ribofuranosylbenzimidazole (DRB; Sigma-Aldrich) was added 20 min before harvesting cells. 3C 3C was performed as described [10] . In brief, 10 7 cells were fixed (10 min; room temperature) in 1% paraformaldehyde (Electron Microscopy Sciences), “Dounce”-homogenized, and membranes lyzed (30 min; 4°C) using 0.2% Igepal (Sigma-Aldrich). Nuclei were pelleted and resuspended in the appropriate restriction buffer, incubated (16 h; 37°C) with Sac I or Hind III (800 units/10 6 cells; New England Biolabs), diluted to 8 ml in ligation buffer, T4 DNA ligase added (4,000 units/10 6 cells; New England Biolabs), and incubated (48 h at 4°C, then 20 min at room temperature). After reversing cross-links (16 h; 65°C), DNA was purified by phenol extraction and ethanol precipitation, cut with Bgl II to reduce fragment length, and repurified. 71%–78% restriction sites in the template were cut by Sac I or Hind III (determined as in [31] ). PCR conditions were adjusted so that reactions were within the linear range of amplification (i.e., ∼175 ng template/reaction; 1.75 mM MgCl 2 , 1% dimethylsulphoxide, 10 pmoles of each primer, and GoTaq polymerase (Promega); 95°C for 2 min, then 34 cycles at 95°C for 55 s, 59°C for 45 s, and 72°C for 20 s, followed by one cycle at 72°C for 2 min); amplimers were resolved on 2.5% agarose gels, stained with SYBR Green (Invitrogen), and scanned using an FLA-5000 scanner (Fuji). Identities of all 3C products were confirmed by DNA sequencing (Geneservices, Oxford), except for those in Figure S8 (where identities were confirmed by restriction digestion). Amplification efficiencies were examined using a control template generated by Sac I or Hind III digestion of BAC clones covering GAPDH on HSA12 (RP5-940J5; ImaGenes), SAMD4A , GCH1 (RP11-170J16, CTC-775N1, CTD-2586I5, CTD-2378G4; CHORI, Invitrogen), and TNFAIP2 (CTD-2594N9; Invitrogen) on HSA14, SLC6A5 on HSA11 (RP11-120F6; CHORI), and PTRF on HSA17 (RP11-194N12; CHORI) followed by ligation. This synthetic template was spiked (to reach 175 ng/µl) with HUVEC DNA cut with the relevant restriction enzyme and ligated. Other control templates included non-digested/ligated DNA and digested/non-ligated DNA (both from 10 6 cells). Results shown were reproduced using at least two independently obtained templates.
Supporting Information Figure S1 TNFα induces a wave of transcription to sweep along SAMD4A . HUVECs were treated with TNFα, samples collected every 7.5 min for 3 h, total RNA purified and hybridized to a tiling microarray bearing 25-mers complementary to SAMD4A (modified from [9] ). On the gene map (top) positions of introns, exons, and targets of 3C primers a–h are indicated. Position a corresponds to 25 kbp 5′ before the transcription start site ( tss ), b to the promoter, c to the beginning of intron 1, d to 34 kbp into intron 1, e to intron 3, f to intron 11, g to the 3′ untranslated region ( utr ), and h to 25 kbp after the poly(A) site. The vertical axis gives intensity of signal of intronic and exonic probes (red and yellow vertical needles, respectively); genomic location (bottom) and time after stimulation (top to bottom) are shown. No transcripts copied from either sense or anti-sense strands are detected at 7.5 min [9] . A wave of signal initiates at the 5′ end within 15 min (start), and then travels down the gene to terminate after 75–90 min (end). Co-transcriptional splicing and premature termination conspire to generate this wave (e.g., as the wave reaches the middle of intron 2 after 60–75 min, little signal is seen in intron 1). Note also that probes covering the first thousands of nucleotides from the tss yield signal between 15–180 min, and polymerases only seem to escape downstream in a limited interval (i.e., after 15–30 min) to initiate a first, fairly synchronous wave. This points to a checkpoint regulating escape; it seems to act on a second polymerase once it senses there is already a first on the gene (despite being perhaps 100 kbp downstream). This figure is reproduced from [9] . (1.27 MB TIF) Click here for additional data file. Figure S2 Changing contacts detected using “circular ACT” (associated chromosome trap). To detect intra-/inter-chromosomal contacts made by SAMD4A regions c and d at 0, 10, and 30 min after adding TNFα, we performed circular ACT [13] , [14] . 3C templates were prepared using either Sac I or Hind III and then Csp 6I, nested inverse PCR conducted (using primers targeting SAMD4A regions c or d ), products cloned and sequenced, and segments contacting SAMD4A mapped. Genic contacts with gene name, region of gene, chromosomal location, and the number of times (hits) that particular sequence was seen compared to the total number of sequences analyzed (includes self-ligation products and contacts with non-coding regions that are not shown) are listed. Results support the idea that, at 0 min, SAMD4A makes few contacts. After 10 min, region c contacts many more genes, including partners (highlighted) we study ( TNFAIP2 , GCH1 , SLC6A5 , PTRF ); no such contacts are seen with region d (the wave of transcription has not yet reached this region). After 30 min, region d now contacts TNFAIP2 and SLC6A5 (in accord with 3C data in Figures 3 and 4 ; note a contact between SAMD4A and the tss of SLC6A5 is detected at 10 min, and one with the 3′ end of SLC6A5 at 30 min). In a population of cells, a gene contacts other genomic regions with varying frequencies [26] , [27] , and circular ACT detects those occurring the most often (to give repeated “hits” in independent experiments) against an inevitable background [13] , [14] . As in independent experiments we detect contacts between SAMD4A and TNFAIP2 , SLC6A5 , PTRF1 (shown here), and GCH1 (one contact shown here, plus one additional one seen after 60 min; not shown), it is likely that all these interactions are major ones—although not necessarily the strongest ones. (0.41 MB TIF) Click here for additional data file. Figure S3 Contacts between SAMD4A and GCH1 (or PTRF ) follow engaged polymerases. General details are as in Figure 3A . (A) Positions of 3C primers targeting SAMD4A and GCH1 , which lie ∼0.8 Mbp apart on chromosome 14. (B, C) Contacts between SAMD4A and the 5′ and 3′ ends of GCH1 . The interaction pattern is similar to that seen with SAMD4A and SLC6A5 (which is of comparable length to GCH1 ; Figure 4 ). Panel (B) shares with (C) the same intra- GAPDH and loading controls (excluding ± DRB). (D) Positions of 3C primers targeting SAMD4A and PTRF . (E) Contacts between SAMD4A and the tss of PTRF (on chromosome 17). The interaction pattern is similar to that seen between SAMD4A and TNFAIP2 ( Figure 3 ). (F) Nascent RNA detected by RT-PCR in total RNA isolated from HUVECs 0–85 min after adding TNFα. For GCH1 at 0 min, no signal is seen. After 10 min, maximal levels of RNA are seen at the tss (intron 1); after 30 min, they are seen at the 3′ end (intron 5). This cycle repeats between 60 and 85 min. PTRF is expressed prior to TNFα induction, but levels of intronic RNA increase after stimulation. Controls show that levels of GAPDH intronic RNA remain unchanged and that amplimers do not result from contaminating genomic DNA (w/o RT). (G) Levels of bound RNA polymerase II (detected by ChIP using anti-phospho-Ser5 in the C-terminal domain of the largest subunit) 0–10 min after stimulation (light and dark grey bars, respectively). Levels of enrichment are expressed relative to those of the input; values for different amplicons are normalised relative to those seen with GAPDH . Error bars show standard deviations from two independent experiments. * p 75% pixels) or yellow (signal above threshold of both colours in ≥75% pixels). The middle image is therefore scored as one red and one green focus even though the two partially overlap; such partially overlapping foci were rare (constituting 75% pixels in the focus contain both green and red signals above the threshold). Bar: 200 nm. (C) Summary of RNA FISH results. HUVECs were treated with TNFα for 10–60 min, RNA FISH performed with probe pairs detecting nascent RNA copied from the regions indicated, and numbers of cells containing red, green, and yellow foci determined (from images like those in Figure 5A–G ). In each case, one probe (green) targets RNA copied from regions c , d , or e/f of SAMD4A , while a second (red) targets intronic RNA from either a control gene that yields no 3C product with SAMD4A (i.e., RCOR1 , EDN1 ) or a test gene (i.e., TNFAIP2 , SLC6A5 ) that does. Values represent numbers of cells ( n ) with the patterns indicated (percentages in brackets); numbers of yellow foci are highlighted. A probe targeting the anti-sense strand of SAMD4A region d , and pretreatment of cells with RNase A yields no signal (not shown). Before induction, probes targeting TNFAIP2 , SLC6A5 introns 1 and 10, and SAMD4A regions d and e/f yield no foci; SAMD4A probe c yields foci in
📊 Figures
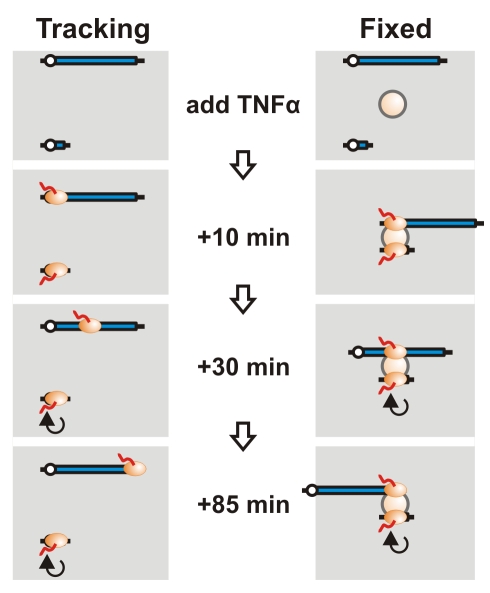
Figure 1
Distinguishing between tracking and fixed RNA polymerases.
Before adding TNFu03b1, both the long and short gene are not transcribed. Assuming they lie far apart on the same chromosome, they are unlikely to yield detectable 3C products. Ten min after adding TN...
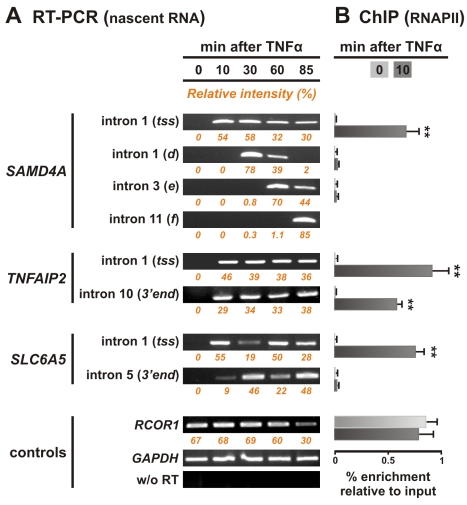
Figure 2
Polymerases initiate rapidly and synchronously on responding genes and elongate at expected rates.
(A) Nascent RNA detected using reverse transcriptase PCR (RT-PCR). Total RNA was isolated from HUVECs 0u201385 min after adding TNFu03b1, treated with DNase, and intronic RNA detected. No nascent RNA ...
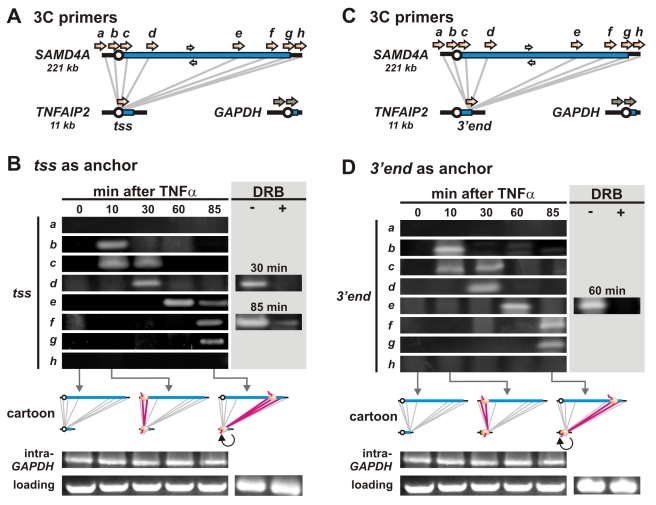
Figure 3
Contacts between two TNFu03b1-responsive genes 50 Mbp apart on the same chromosome follow engaged polymerases.
(A) Positions of 3C primers on SAMD4A and the tss of TNFAIP2 (orange arrows) and GAPDH (grey arrows). Grey lines: 3C interactions monitored. White arrows: primers used for loading controls. (B) 3C. HU...
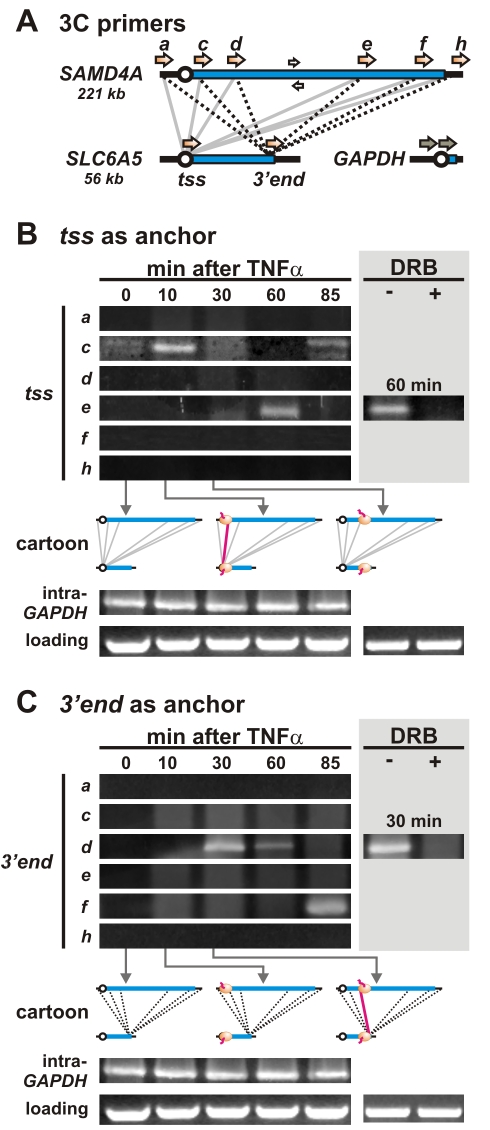
Figure 4
Contacts between two TNFu03b1-responding genes on different chromosomes (14 and 11) follow engaged polymerases.
(A) Positions of 3C primers and the interactions screened (grey and dotted black lines). (B) Contacts between the tss of SLC6A5 (the anchor) and different parts of SAMD4A . Contacts/bands are only det...
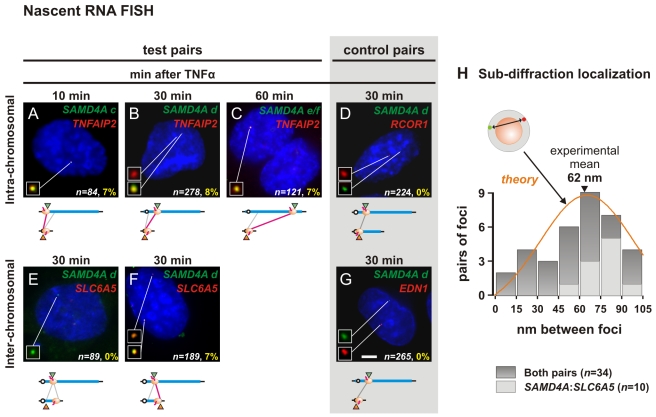
Figure 5
Colocalization of intronic RNA demonstrated by RNA FISH.
HUVECs were treated with TNFu03b1 for 10, 30, or 60 min, and nascent RNAs copied from test and control pairs of genes detected by RNA FISH. (Au2013C) Colocalization of nascent RNAs encoded by genes on...
Figure images are served from the NIH/NLM PubMed Central Open Access Subset or Europe PMC; copyright remains with the publishers and authors.
💬 Discussion
0 commentsNo comments yet. Be the first to start a discussion!
Leave a Comment