Abstract
BACKGROUND/AIMS: An increase of ethanol metabolism and hepatic mitochondrial respiration occurs in vivo after a single binge of alcohol. Here, our aim was to determine how ethanol intake affects hepatic mitochondrial polarization status in vivo in relation to ethanol metabolism and steatosis. METHODS: Hepatic mitochondrial polarization, permeability transition (MPT), and reduce pyridine nucleotides, and steatosis in mice were monitored by intravital confocal/multiphoton microscopy of the fluorescence of rhodamine 123 (Rh123), calcein, NAD(P)H, and BODIPY493/503, respectively, after gavage with ethanol (1-6 g/kg). RESULTS: Mitochondria depolarized in an all-or-nothing fashion in individual hepatocytes as early as 1 h after alcohol. Depolarization was dose- and time-dependent, peaked after 6 to 12 h and maximally affected 94% of hepatocytes. This mitochondrial depolarization was not due to onset of the MPT. After 24 h, mitochondria of most hepatocytes recovered normal polarization and were indistinguishable from untreated after 7 days. Cell death monitored by propidium iodide staining, histology and terminal deoxynucleotidyl transferase dUTP nick end labeling (TUNEL) was low throughout. After alcohol, mitochondrial NAD(P)H autofluorescence increased and decreased, respectively, in hepatocytes with polarized and depolarized mitochondria. Ethanol also caused steatosis mainly in hepatocytes with depolarized mitochondria. Depolarization was linked to ethanol metabolism, since deficiency of alcohol dehydrogenase and cytochrome-P450 2E1 (CYP2E1), the major ethanol-metabolizing enzymes, decreased mitochondrial depolarization by ∼ 70% and ∼ 20%, respectively. Activation of aldehyde dehydrogenase decreased depolarization, whereas inhibition of aldehyde dehydrogenase enhanced depolarization. Activation of aldehyde dehydrogenase also markedly decreased steatosis. CONCLUSIONS: Acute ethanol causes reversible hepatic mitochondrial depolarization in vivo that may contribute to steatosis and increased mitochondrial respiration. Onset of this mitochondrial depolarization is linked, at least in part, to metabolism of ethanol to acetaldehyde.
🔬 Techniques
🔭 Microscopes
✨ Fluorophores
🧪 Sample Preparation
🏭 Microscope Brands
🧪 Reagent Suppliers
🏛️ Research Organizations (ROR)
Affiliated research institutions:
📋 Methods
Hepatic mitochondrial polarization, permeability transition (MPT), and reduce pyridine nucleotides, and steatosis in mice were monitored by intravital confocal/multiphoton microscopy of the fluorescence of rhodamine 123 (Rh123), calcein, NAD(P)H, and BODIPY493/503, respectively, after gavage with ethanol (1–6 g/kg).
Materials and Methods
Animals and chemicals
Sources for animals and reagents are listed in Table 1 . 10.1371/journal.pone.0091308.t001 Table 1 Sources for Animals and Chemicals. Items Sources Animals: C57BL/6 mice Jackson Laboratory, Bar Harbor, Maine Cyp2E1 -/- mice Dr. Frank Gonzales, National Cancer Institute Deer mice Peromyscus Genetic Stock Center, Columbia, SC Reagents: Actin antibody ICN, Costa Mesa, CA Alcohol analytical kit BioVision, San Francisco, CA Alda-1 Dr. Daria Mochly-Rosen, Stanford University ALT analytical kit Pointe Scientific, Uncoln Park, MI Aminobenzotriazole Sigma-Aldrich, St. Louis, MO BODIPY493/503 Invitrogen, Carlsbad, CA Bromosulfophthalein Sigma-Aldrich, St. Louis, MO Calcein-AM Biotium Inc., Hayward, CA Chemiluminescence kit Pierce Biotec., Rockford, IL Disulfiram Sigma-Aldrich, St. Louis, MO Enliten ATP Assay System Promega Corp., Madison, WI MAA antibody Dr. Todd Wyatt, Univ. of Nebraska Medical Center 4-HNE antibody Alpha Diagnostics, Inc., San Antonio, TX Polyethoxylated castor oil Sigma-Aldrich, St. Louis, MO Propidium iodide Sigma-Aldrich, St. Louis, MO Rhodamine 123 Sigma-Aldrich, St. Louis, MO TMRM Invitrogen, Carlsbad, CA Triglyceride analytical kit Enzymatic Standbio, Boerne, TX Alda-1, N -(1,3-benzodioxol-5-ylmethyl)-2,6-dichlorobenzamide; ALT, alanine aminotransferase; calcein-AM, calcein acetoxymethyl ester, 4-HNE, 4-hydroxynonenal adducts; MAA, malondialdehyde-acetaldehyde adducts; TMRM, tetramethylrhodamine methylester.
Show full methods section
Hepatic mitochondrial polarization, permeability transition (MPT), and reduce pyridine nucleotides, and steatosis in mice were monitored by intravital confocal/multiphoton microscopy of the fluorescence of rhodamine 123 (Rh123), calcein, NAD(P)H, and BODIPY493/503, respectively, after gavage with ethanol (1–6 g/kg).
Materials and Methods
Animals and chemicals
Sources for animals and reagents are listed in Table 1 . 10.1371/journal.pone.0091308.t001 Table 1 Sources for Animals and Chemicals. Items Sources Animals: C57BL/6 mice Jackson Laboratory, Bar Harbor, Maine Cyp2E1 -/- mice Dr. Frank Gonzales, National Cancer Institute Deer mice Peromyscus Genetic Stock Center, Columbia, SC Reagents: Actin antibody ICN, Costa Mesa, CA Alcohol analytical kit BioVision, San Francisco, CA Alda-1 Dr. Daria Mochly-Rosen, Stanford University ALT analytical kit Pointe Scientific, Uncoln Park, MI Aminobenzotriazole Sigma-Aldrich, St. Louis, MO BODIPY493/503 Invitrogen, Carlsbad, CA Bromosulfophthalein Sigma-Aldrich, St. Louis, MO Calcein-AM Biotium Inc., Hayward, CA Chemiluminescence kit Pierce Biotec., Rockford, IL Disulfiram Sigma-Aldrich, St. Louis, MO Enliten ATP Assay System Promega Corp., Madison, WI MAA antibody Dr. Todd Wyatt, Univ. of Nebraska Medical Center 4-HNE antibody Alpha Diagnostics, Inc., San Antonio, TX Polyethoxylated castor oil Sigma-Aldrich, St. Louis, MO Propidium iodide Sigma-Aldrich, St. Louis, MO Rhodamine 123 Sigma-Aldrich, St. Louis, MO TMRM Invitrogen, Carlsbad, CA Triglyceride analytical kit Enzymatic Standbio, Boerne, TX Alda-1, N -(1,3-benzodioxol-5-ylmethyl)-2,6-dichlorobenzamide; ALT, alanine aminotransferase; calcein-AM, calcein acetoxymethyl ester, 4-HNE, 4-hydroxynonenal adducts; MAA, malondialdehyde-acetaldehyde adducts; TMRM, tetramethylrhodamine methylester.
Animals and ethanol treatment Male
C57BL/6 mice (8–9 weeks), Cyp2E1–null mice, and alcohol dehydrogenase (ADH)-positive and ADH-negative deer mice had access to chow diet ad libitum before a single gavage with alcohol (1–6 g/kg) or vehicle (saline). Some wild-type mice were pretreated with a cytochrome P450 inhibitor, aminobenzotriazole (ABT, 100 mg/kg, i.g. ), an aldehyde dehydrogenase (ALDH) inhibitor, disulfiram (DSF, 200 mg/kg, i.p. ), or an ALDH activator, Alda-1 [18] ( N -(1,3-benzodioxol-5-ylmethyl)-2,6-dichlorobenzamide, 50 mg/kg, i.p. ) 30 min prior to ethanol or with cyclosporin A (CsA, 10 mg/kg, i.g. ) at 1 h before ethanol. Vehicles for ABT, DSF, Alda-1 and CsA were saline, DMSO, DMSO and 8.3% polyethoxylated castor oil with 8.3% ethanol, respectively.
Clinical chemistry and histology
Blood was collected 1–6 h after ethanol treatment. Alcohol and alanine aminotransferase (ALT) were measured using commercial analytical kits ( Table 1 ) according to the manufacturers' protocols. Apoptosis was assessed by terminal deoxynucleotidyl transferase dUTP nick end labeling (TUNEL) [19] . Some liver tissue was frozen-sectioned and stained with Oil-Red-O staining to detect steatosis [20] . Paraffin sections after paraformaldehyde fixation were stained with periodic acid Schiff (PAS) to assess glycogen.
Measurement of hepatic triglycerides
Liver tissue (200 mg) was homogenized in normal saline and extracted with 2∶1 chloroform/methanol. After centrifugation at 1700 rpm for 5 min, the chloroform phase was separated, dried in a speed vacuum centrifuge and resuspended in 1 ml of chloroform. Triglyceride was measured using an analytical kit ( Table 1 ) [20] .
Hepatic ATP measurement
To assess the effects of ethanol on hepatic ATP, mice were treated with saline or ethanol (6 g/kg, i.g .), and livers were harvested 6 h later by freeze-clamping using aluminum tongs chilled in liquid nitrogen followed by storage at −80°C. ATP in trichloroacetic acid extracts was detected by luciferin-luciferase assay using an Enliten ATP Assay System ( Table 1 ) [21] , [22] .
Immunoblotting
Acetaldehyde is highly reactive, volatile and thus difficult to measure accurately. However, acetaldehyde rapidly reacts with other aldehydes/proteins to form adducts. Such adducts are potentially toxic to mitochondria and linked to ethanol hepatotoxicity [23] . Accordingly, malondialdehyde-acetaldehyde adducts (MAA), a hybrid acetaldehyde adduct [23] – [25] , and 4-hydroxynonenal (4-HNE) adducts, an indicator of lipid peroxidation, were detected by immunoblotting, as described [20] . Immunoblotting was performed with primary antibodies specific for MAA, 4-HNE, and actin ( Table 1 ) at 1∶1000, 1∶1000, and 1∶3000 dilutions, respectively, over night at 4°C. Horseradish peroxidase-conjugated secondary antibodies were applied, and detection was by chemiluminescence [20] . Assay of hypoxia inducible factor (HIF)-1a mRNA by quantitative real-time PCR Livers were harvested at 1 h and 6 h after ethanol treatment. HIF-1α mRNA was detected by quantitative real-time PCR, as described [26] . HIF-1α mRNA in liver was determined using a forward primer of 5′-GAAATGGCCCAGTGAGAAAA-3′ and a reverse primer of 5′-CTTCCACGTTGCTGACTTGA-3′ . The abundance of mRNAs was normalized against hypoxanthine phospho-ribosyl-transferase (HPRT) using the ΔΔ Ct method.
Intravital confocal and multiphoton microscopy
Intravital confocal and multiphoton microscopy was performed at 1 h to 7 days after saline or ethanol treatment, as described [16] , [26] . Mice had access to chow diet and water ad libitum until imaging. Rhodamine 123 (Rh123) and tetramethylrhodamine methylester (TMRM), cationic fluorophores that are taken up by polarized mitochondria in response to the negative mitochondrial membrane potential, were used to monitor mitochondrial polarization after ethanol treatment. Propidium iodide (PI) and 4,4-difluoro-1,3,5,7,8-pentamethyl-4-bora-3a,4a-diaza- s -indacene (BODIPY493/503) were used to label nuclei of non-viable cells and fat droplets, respectively. Endogenous mitochondrial NAD(P)H was detected by blue autofluorescence. Onset of inner membrane permeabilization characteristic of the mitochondrial permeability transition (MPT) was detected after portal infusion of calcein acetoxymethyl ester (calcein-AM), which is cleaved by intracellular esterases to release calcein free acid into the cytosol, as described [27] . Under normal conditions calcein fluoresces in the cytosol, revealing mitochondria as dark voids due to the impermeability of mitochondrial membranes to calcein. These dark voids disappear after onset of the MPT as calcein enters the mitochondrial matrix space through MPT pores [16] , [26] , [27] [28] [22] . Under pentobarbital anesthesia (80 mg/kg, i.p .), a tracheotomy was performed, and an intravenous catheter (20 gauge) was inserted into the trachea, secured with a 5-0 silk suture, and connected to a small animal ventilator. The carotid artery was then cannulated with polyethylene (PE10) tubing. Rh123 (2 µmol/mouse), TMRM (1 µmol/mouse), PI (0.04 µmol/mouse), and/or BODIPY493/503 (25 µg/mouse) were infused singly or in combination in 0.4 mL of normal saline via the PE10 tubing over 10 min. Calcein-AM (1 mg/mouse) was injected slowly into the rectal vein. Bromosulfophthalein (6.6 µmol/mouse), an anion channel inhibitor, was injected into the rectal vein 5 min before calcein-AM to prevent biliary excretion of calcein. Imaging was started within 10 min after fluorophore infusion. Direct infusion of the fluorophores into the blood stream eliminated the potential influence of ethanol on absorption rates for the fluorophores and allowed rapid distribution of fluorophores into organs and cells. After fluorophore loading, the abdomen was opened transversely to expose the liver. Laparotomized mice were then placed prone on the stage of a Zeiss LSM 510 NLO laser scanning confocal/multiphoton microscope. The liver was gently positioned over a coverslip and imaged with 25x and 63x water-immersion objective lenses. Settings for simultaneous imaging of Rh123 (green) plus PI (red), Rh123 (green) plus NAD(P)H autofluorescence (blue), TMRM (red) plus BODIPY493/503 (green), TMRM (red) alone or calcein (green) alone are listed in Table 2 . During image acquisition, the respirator was turned off during ∼8 sec image scans to eliminate breathing movement artifacts. In preliminary studies, we observed that the preparations were stable for at least 1 h, but for the experiments presented imaging was completed within 30 min of fluorophore loading. 10.1371/journal.pone.0091308.t002 Table 2 Intravital Confocal/Multiphoton Microscopy Settings. Fluorophores Imaging Mode Excitation Emission Filters Color Rh123+PI Two-photon 800 nm 500–550 & 650–710 nm Green; red Rh123+NAD(P)H Two-photon 720 nm 500–550 & 435–485 nm Green; blue Calcein Two-photon 720 nm 500–550 nm Green TMRM± BODIPY493/503 Single-photon 543&488 nm 565–615 & 500–530 nm Red; green Calcein-AM (1 mg/mouse); Rh123, rhodamine 123 (2 µmol/mouse); PI, propidium iodide (0.04 µmol/mouse); TMRM, tetramethylrhodamine methylester (0.8 µmol/mouse); BODIPY493/503 (25 µg/mouse). To quantify labeling, 10 or more images were collected randomly from the liver of each mouse. Hepatocytes in these fields (∼250 cells) were scored in a blinded fashion for bright punctate Rh123 or TMRM fluorescence representing cells with polarized mitochondria versus a dimmer diffuse cytosolic fluorescence representing cells with depolarized mitochondria. For individual hepatocytes, ethanol caused mitochondrial depolarization almost always in an all-or-none manner. Thus, the distinction between punctate and diffuse staining was generally unambiguous. Rarely, mitochondria were not all depolarized within a single hepatocyte, and we scored such cells based on whether the majority of mitochondria had lost punctate labeling. Nonviable PI positive cells, indicated by red nuclear fluorescence, were also counted. In some mice, simultaneous imaging of BODIPY493/503-labeled fat droplets (green) and mitochondrial polarization by TMRM (red) was performed at 2 h after ethanol treatment (6 g/kg, i.g. ). The number of fat droplets in hepatocytes with and without mitochondrial depolarization was assessed in a blinded manner in 10 random fields per liver. Reduced pyridine nucleotides (NADH plus NADPH) fluoresce blue, and previous studies showed that nearly all NAD(P)H autofluorescence arises from mitochondria, whereas cytosolic NAD(P)H fluorescence is highly quenched [29] , [30] . Mitochondrial NADPH/NADP is in dynamic equilibrium with mitochondrial NADH/NAD via the electrogenic mitochondrial transhydrogenase. Blue autofluorescence in liver represents mitochondrial NAD(P)H regardless of whether autofluorescence is measured from whole liver by whole organ fluorometry, from sublobular locations with microlight guides, or from single cells/mitochondria by confocal/multiphoton microscopy [29] – [31] . Reduced pyridine nucleotides are relatively fragile and readily undergo photooxidation and photodamage. To minimize such changes, we used a low laser power setting that yielded images with lower signal-to-noise characteristics than for our other imaging. Measurement of serum Rh123 At 6 h after gavage with ethanol (6 g/kg) or an equal volume of saline, Rh123 was infused into the carotid artery under anesthesia as described above, and blood was collected from the vena cava immediately and after 10 and 30 min. Serum was obtained by centrifugation at 12,000 rpm for 10 min and stored in the dark at −80°C. After thawing, serum was diluted 10-fold in saline, and fluorescence was measured using excitation and emission wavelengths of 511 and 534 nm, respectively, with a Spectra Max M2 plate reader (Molecular Devices, Sunnyvale, CA) in comparison to Rh123 standards. Hepatic ischemia/reperfusion in mice The effect of cyclosporin A (CsA) on the MPT was tested in a hepatic ischemia/reperfusion (I/R) model as a positive control for its effectiveness in vivo since CsA is a classical MPT inhibitor. Our previous studies demonstrated that hepatic I/R causes the MPT onset in vivo , leading to mitochondrial depolarization [16] , [32] . At 1 h after vehicle- and CsA (10 mg/kg, i.g.) treatment, hepatic ischemia was induced by clamping the artery and portal vein to the upper three lobes of the liver ( i.e. , about 70% of total liver). The ischemic liver was reperfused by opening the vascular clamp 1 h later as described previously [16] . Mitochondrial polarization status was detected by intravital multiphoton microscopy of Rh123 at 2 h after reperfusion.
Statistical analysis
All groups were compared using ANOVA plus Student-Newman-Keuls' post-hoc test or Student's t-test, as appropriate. Values are means ± SEM. Differences were considered significant at p
📊 Figures
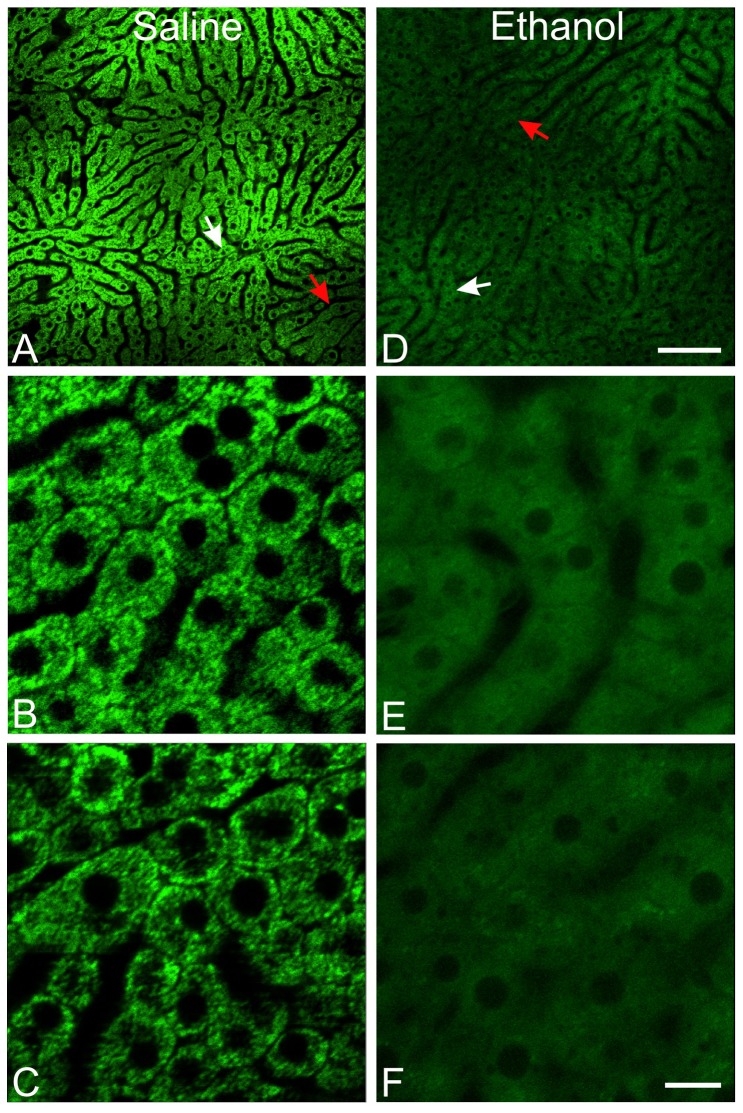
Figure 1
Acute ethanol causes widespread mitochondrial depolarization in the liver.
Mice were treated with saline (left column) or ethanol (6 g/kg, i.g ., right column). Intravital multiphoton microscopy of Rh123 was performed after 6 h using a 25u00d7 water objective lens. A and D ,...
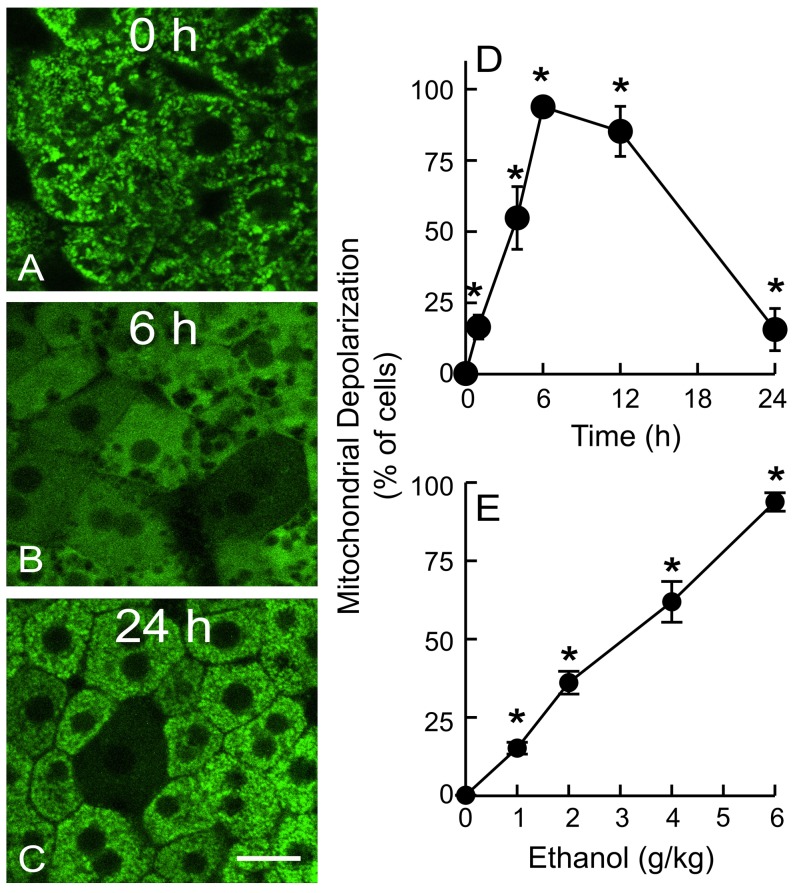
Figure 2
Ethanol causes reversible mitochondrial depolarization in vivo in a dose-dependent manner.
Mice were gavaged with one dose of ethanol (0u20136 g/kg) in saline, and mitochondrial polarization was detected by intravital multiphoton microscopy of Rh123 at 0 to 24 h after treatment. Representat...
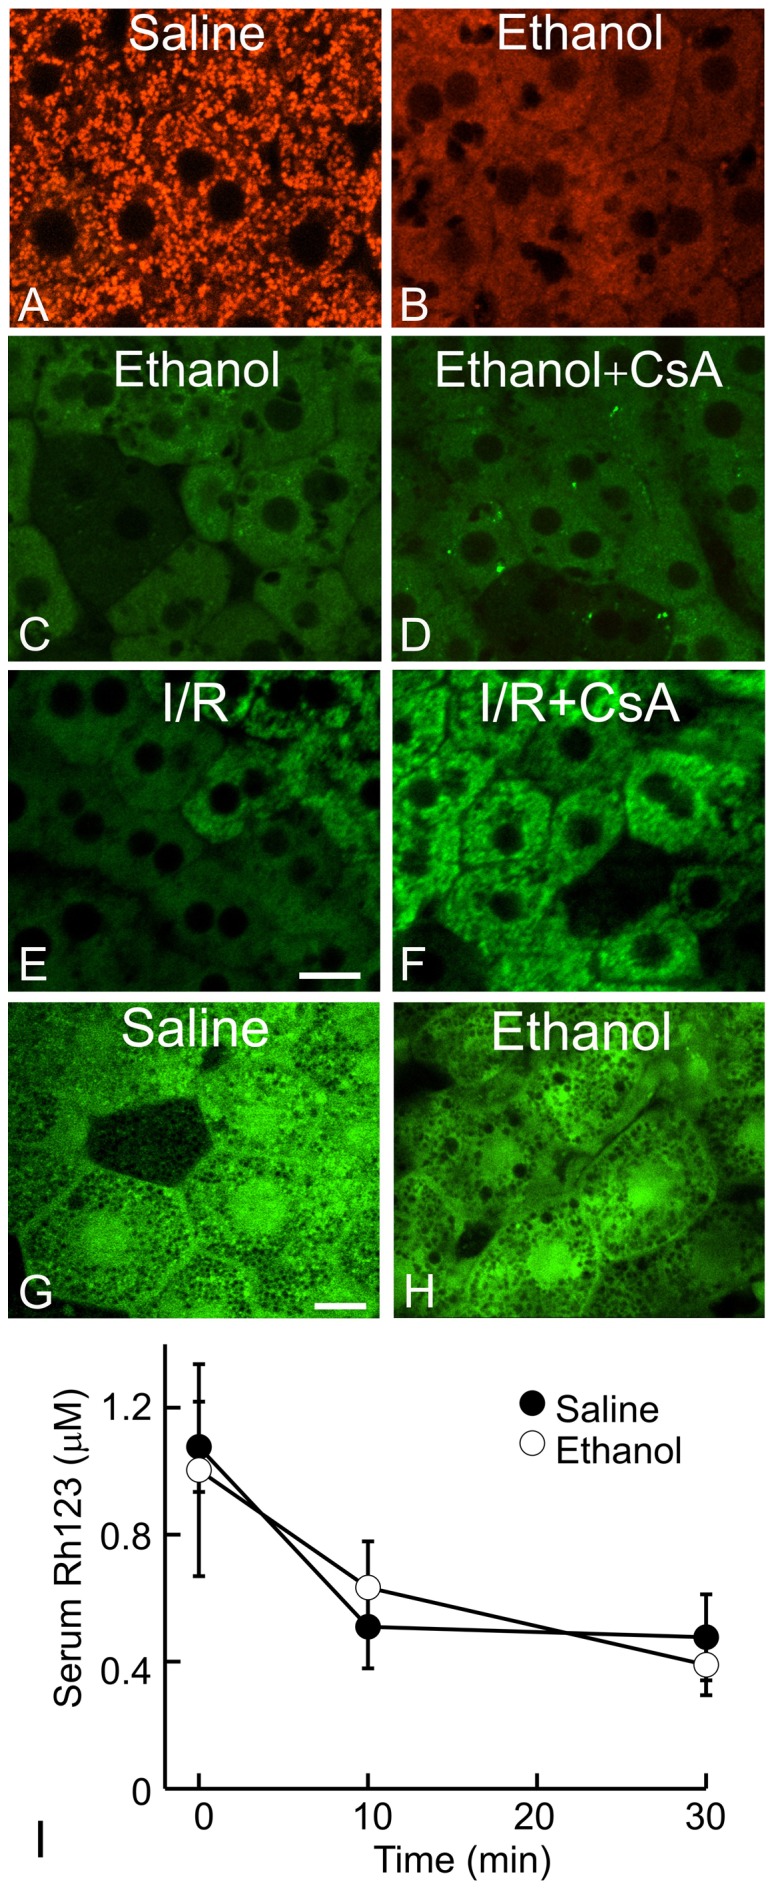
Figure 3
Loss of mitochondrial Rh123 fluorescence after ethanol is unlikely due to upregulation of organic cation transporters, the mitochondrial permeability transition or changes in Rh123 pharmacokinetics.
In Au2013D, G and H, mice were treated with saline or ethanol (6 g/kg, i.g .), and images were collected at 6 h after treatment. In A and B, TMRM fluorescence was detected by intravital confocal micro...
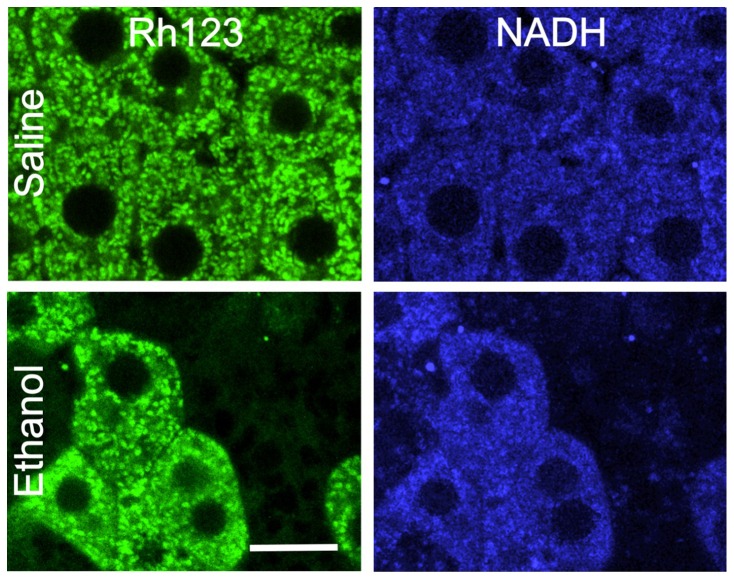
Figure 4
Ethanol-induced mitochondrial depolarization is associated with oxidation of mitochondrial NAD(P)H.
Mice were gavaged with saline or ethanol (6 g/kg). Mitochondrial polarization was detected by Rh123 fluorescence (left column), and mitochondrial NAD(P)H (right column) was detected by autofluorescenc...
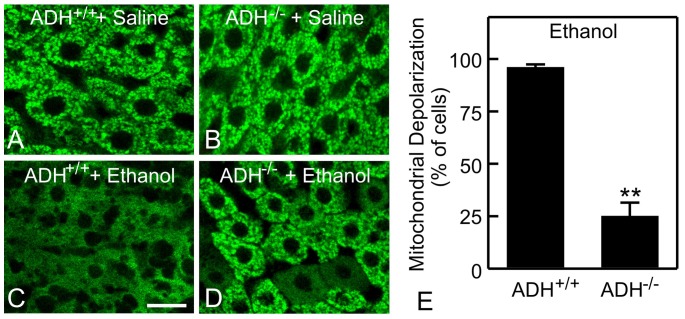
Figure 5
Role of alcohol dehydrogenase in ethanol-induced mitochondrial depolarization.
ADH positive (ADH +/+ ) and negative (ADH -/- ) deer mice were gavaged with saline ( A and B ) or ethanol (6 g/kg, C and D ). Rh123 fluorescence was detected after 6 h. Representative images of 4 mice...
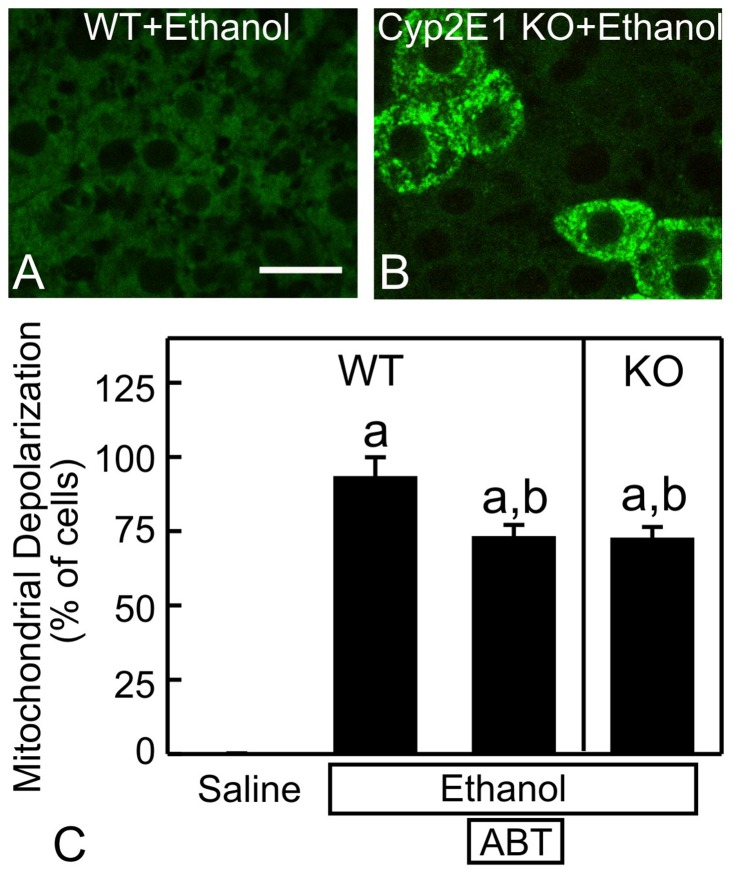
Figure 6
Role of cytochrome P450-dependent ethanol metabolism in mitochondrial depolarization.
Wild-type (WT) ( A ) and Cyp2E1 knock-out (KO) ( B ) mice were gavaged with ethanol (6 g/kg). Rh123 fluorescence was detected after 6 h. Some WT mice were pretreated with aminobenzotriazole (ABT, 100 ...
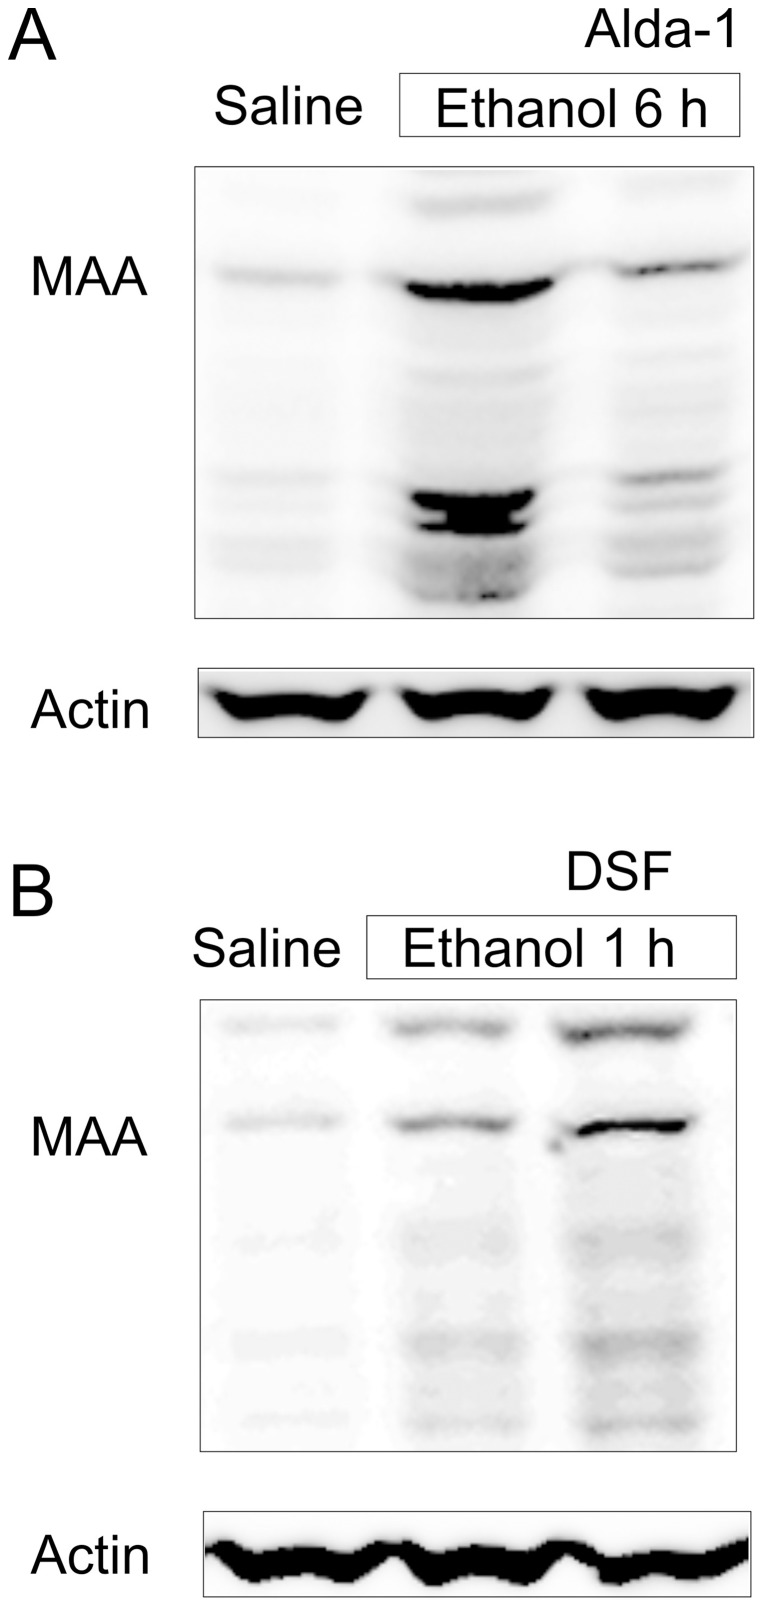
Figure 7
Alda-1 decreases whereas disulfiram increases malondialdehyde-acetaldehyde adducts after ethanol treatment.
Mice were injected with vehicle, Alda-1 (50 mg/kg, i.p. ) or DSF (200 mg/kg, i.p. ) 30 min before gavage of saline or ethanol (6 g/kg). MAA adducts were detected in liver tissue at 6 h after ethanol t...
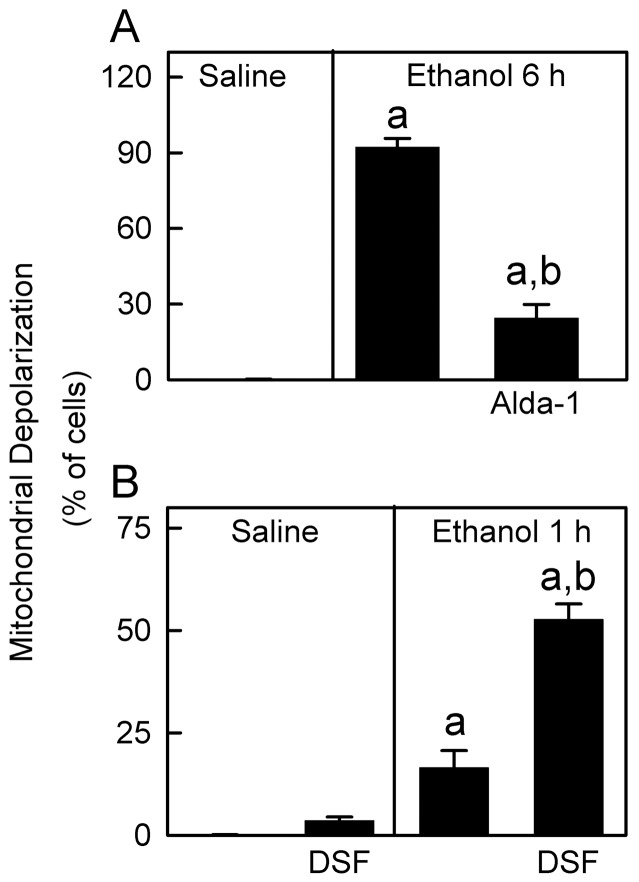
Figure 8
Role of aldehyde dehydrogenase in ethanol-induced mitochondrial depolarization.
Mice were injected with vehicle, Alda-1 (50 mg/kg, i.p. ) or DSF (200 mg/kg, i.p. ) 30 min before gavage of saline or ethanol (6 g/kg), and Rh123 fluorescence was detected after 6 h ( A ) and 1 h ( B ...
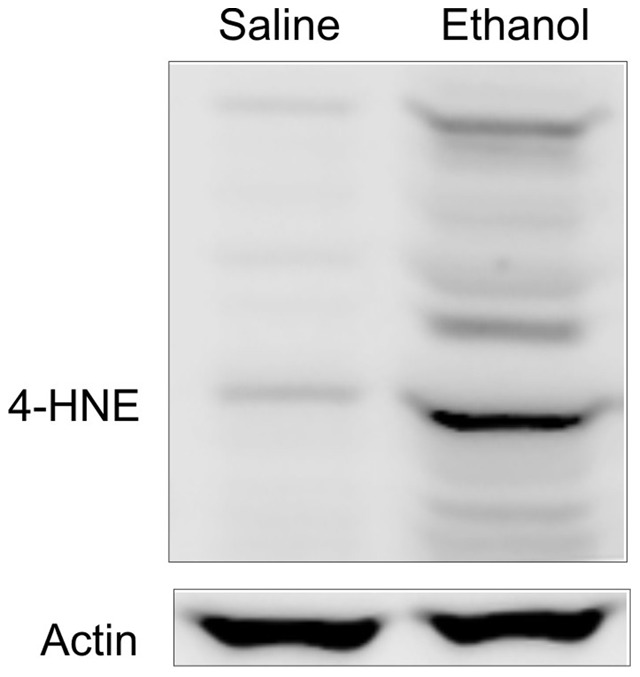
Figure 9
Ethanol increases 4-hydroxynonenal adduct formation.
Mice were gavaged with saline or ethanol (6 g/kg). 4-HNE adducts were detected in liver tissue at 6 h after ethanol treatment by immunoblotting. Shown are representative images of gels (nu200a=u200a3 ...
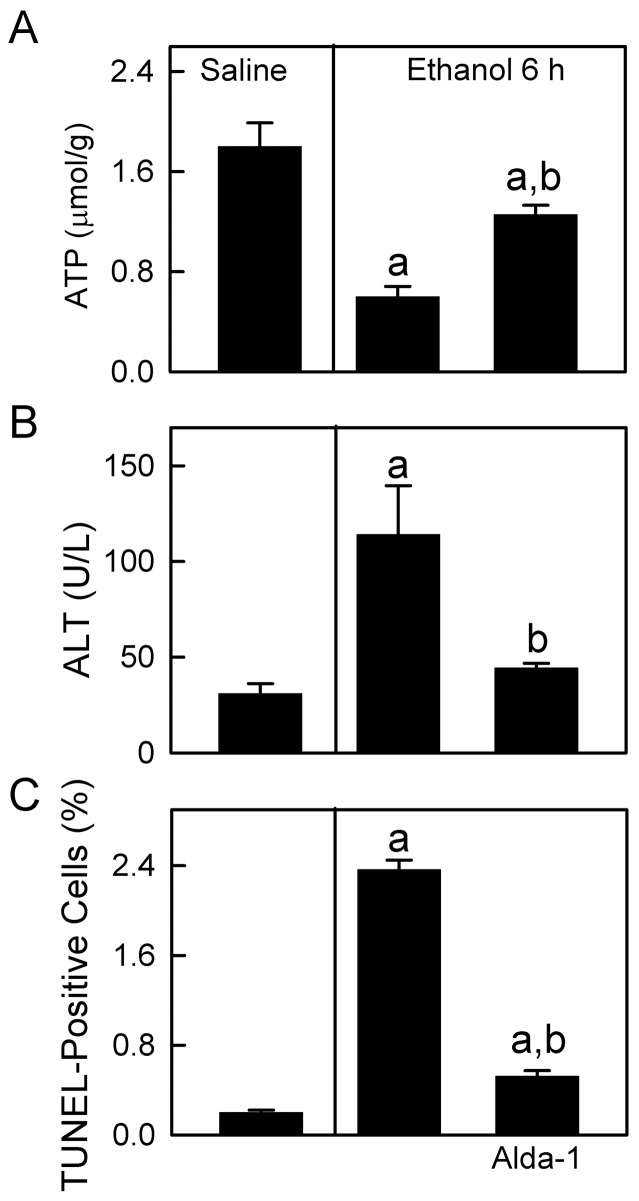
Figure 10
Ethanol decreases hepatic ATP and causes modest liver injury: protection by Alda-1.
Mice were injected with vehicle or Alda-1 (50 mg/kg, i.p. ) 30 min before gavage of saline or ethanol (6 g/kg), and blood and livers were collected 6 h later for hepatic ATP ( A ), serum ALT ( B ) and...
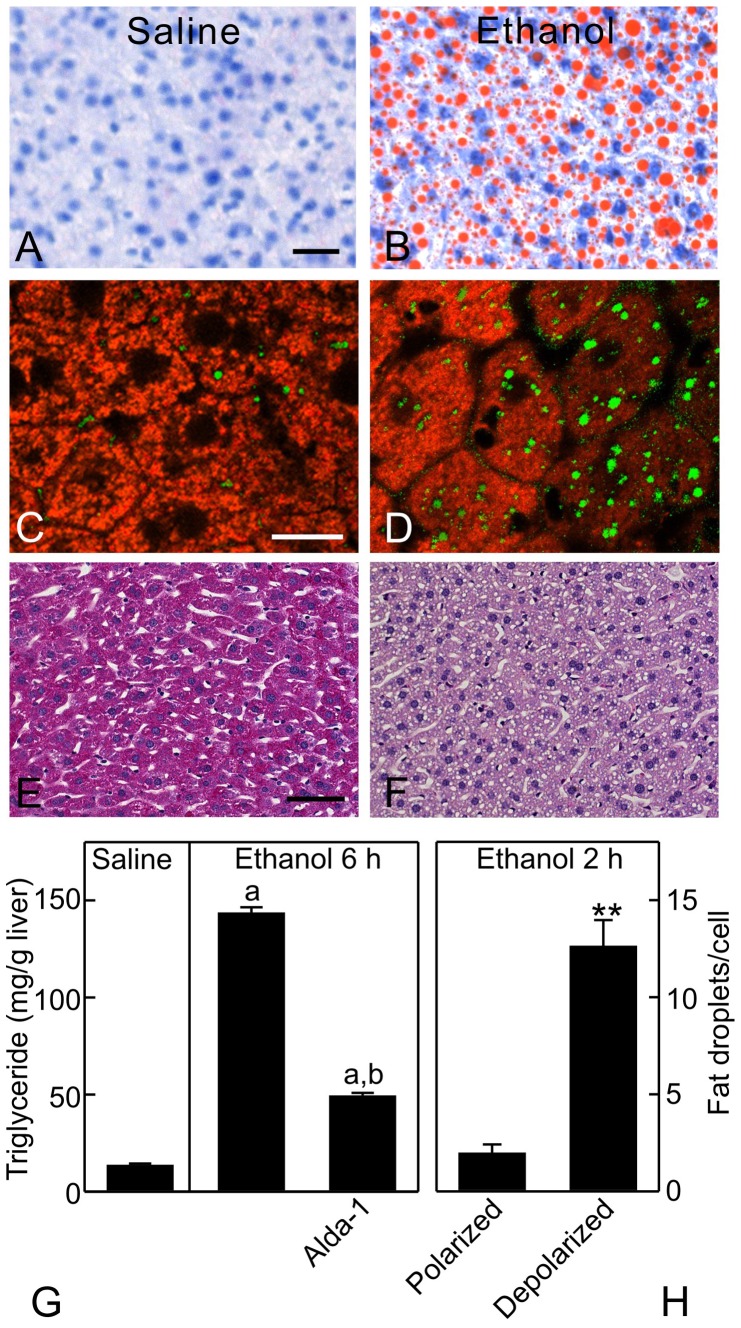
Figure 11
Ethanol causes steatosis in hepatocytes with depolarized mitochondria.
Mice were gavaged with saline or ethanol (6 g/kg), and livers were collected 6 h later for Oil-Red-O ( A and B ; bar is 20 u00b5m), PAS staining ( E and F ; bar is 50 u00b5m), and triglyceride measure...
Figure images are served from the NIH/NLM PubMed Central Open Access Subset or Europe PMC; copyright remains with the publishers and authors.
💬 Discussion
0 commentsNo comments yet. Be the first to start a discussion!
Leave a Comment