Abstract
Adeno-associated virus serotype 2 (AAV-2) is a leading candidate vector for gene therapy. Cell entry starts with attachment to a primary receptor, Heparan Sulfate Proteoglycan (HSPG) before binding to a co-receptor. Here, cryo-electron microscopy provides direct visualization of the virus-HSPG interactions. Single particle analysis was performed on AAV-2 complexed with a 17 kDa heparin fragment at 8.3 A resolution. Heparin density covers the shoulder of spikes surrounding viral 3-fold symmetry axes. Previously implicated, positively charged residues R(448/585), R(451/588) and R(350/487) from another subunit cluster at the center of the heparin footprint. The footprint is much more extensive than apparent through mutagenesis, including R(347/484), K(395/532) and K(390/527) that are more conserved, but whose roles have been controversial. It also includes much of a region proposed as a co-receptor site, because prior studies had not revealed heparin interactions. Heparin density bridges over the viral 3-fold axes, indicating multi-valent attachment to symmetry-related binding sites.
🔬 Techniques
💻 Software
✨ Fluorophores
🧪 Sample Preparation
🔬 Cell Lines
🏭 Microscope Brands
🧪 Reagent Suppliers
📷 Detectors
💻 Software Details
🏛️ Research Organizations (ROR)
Affiliated research institutions:
📋 Methods
Virus was propagated in HeLa cells, and purified by cesium chloride density gradient ultracentrifugation as previously described ( Xie et al., 2004 ). Virus was dialyzed out of the 3M CsCl salt and into a low salt buffer (125mM NaCl, 10mM Tris, and 1mM MgCl 2 pH 7.5) using 50μl custom-built microdialysis cells. Quantifoil R2/1 grids were used to prepare vitrified, thin layer samples. The grids were pre-coated with carbon, but an additional continuous carbon layer was applied to enhance contrast for particle identification and strengthen the Thon rings of the power spectrum used to determine the appropriate contrast transfer function (CTF) correction. The grids were glow discharged immediately prior to sample application. For the native sample, 4μl of virus solution at 1.1 mg/ml was applied to grids, blotted to remove excess, and plunged into liquid ethane for vitrification. Grids were transferred to liquid nitrogen for long term storage. Attempts to pre-incubate virus with heparin for as little as an hour, resulted in severe aggregation, even with10-fold molar excess of heparin relative to capsid protein (600-fold excess relative to virus particles). The aggregates, containing many virus particles cross-linked by heparin, were not suitable for the preparation of thin specimens needed for high resolution EM. Thus, samples were prepared using dilute AAV-2 that had been pre-adsorbed onto EM grids, such that heparin polymers were complexed with individual viruses that were of fixed location. Note that the procedure is different from the chemical fixation used in other types of microscopy, in that the adsorption involves weak, non-specific interactions that are neither expected to induce conformational distortions or to inhibit changes induced by ligands. However, the procedure will reduce slightly the occupancy of the receptor, because a handful of the 60 symmetry-equivalent binding sites will be occluded where the virus contacts the EM grid. Heparin was purchased from Sigma Aldrich, Inc. (sodium salt, ∼17kDa fragment, catalog # H3393) and solubilized in distilled water at 10mg/ml. 4μl of virus at 1.1 mg/ml was added to the grid, as before. After blotting off excess, 4μl of receptor solution at 2.5 mg/ml was added to achieve a 10-fold molar excess relative to the capsid protein that had been applied. Thirty seconds later, the grids were again blotted and flash frozen. The grids were transferred to a pre-cooled Gatan cryotransfer holder and inserted into a Philips CM-300 FEG electron microscope. Images were collected under low dose conditions (20e − /Å 2 ) at 300kV onto a 4K × 4K CCD camera at a magnification of 6.1 × 10 4 , which corresponds to an effective pixel size of 2.45 Å and a Nyquist sampling limit of 4.9Å. All 2D and 3D processing were performed with the EMAN software suite ( Ludtke, Baldwin, and Chiu, 1999 ). CTFIT was used to assess image quality. For this, each 4k × 4k pixel image was sampled with 512 × 512 pixel sized boxes for power spectrum analysis. Images with signs of drift or astigmatism were excluded. Particles within a defocus range of 0.8 to 3.8 μm were selected automatically with the AUTOBOX option in the BOXER program, and manually checked for the presence of ice crystals, broken particles, or debris. The refinement of parameters describing the orientation of virus particles projected in the 2-D EM images (projection alignment) requires a starting 3-D map. Convergence might have been quicker had the starting map been simulated from the known crystal structure. However, to avoid bias, the initial map for was built de novo from the EM images, assuming only that they contained icosahedral symmetry. In the STARTICOS program of EMAN, the data are searched for particles with approximate 5-, 3-, or 2-fold symmetry (in projection), indicating that the symmetry axis in the 3-D particles was approximately parallel to the projection direction. Particles exhibiting each of the symmetries were aligned and grouped into class averages. A 3-D map can then be constructed using the known angular relations of the icosahedral symmetry axes. Initial reconstructions were performed with low pass filtered (20 Å) images and refined until features of the virus began to emerge. To increase the resolution, data were corrected for the CTF and the refinement was continued. Particles were clustered into 179 classes, each corresponding to a different projection direction within the asymmetric unit. Each cycle of 3-D particle reconstruction involved 3 rounds of iterative 2-D class averaging. Individual particle images were excluded if their correlation differed by more than 0.8 standard errors from the mean. 68% and 70% of the total native and complex particles respectively were included in the final refinement. To further remove reference bias and to be sure that features in the map of the complex were real, the final 3-D map was reconstructed using 2-D projection images whose orientations were refined with reference to the native map. The resolution was assessed by Fourier Shell Correlation between even and odd maps with a cutoff of 0.5. Complex minus native difference maps were calculated using the “DR DIFF” procedure of the SPIDER program ( Frank et al., 1996 ). In this procedure the maps are scaled to least-squares minimize their discrepancy within an optionally masked region. Prior to scaling, each map was low-pass filtered to the same 8.3 Å resolution as the complexed particles. For scaling complex to native, the mask was a spherical shell between 79 and 125 Å, thereby including most of the capsid protein, but excluding the primary heparin site which began about 127 Å from the center (and the 3-fold capsid spikes). For difference map calculation, all maps were brought to a common scale – that of the low-pass filtered native map, so that a single estimate of the experimental noise could be used. The significance of features in the maps, relative to noise, was assessed though analysis of a “mock” difference map, calculated between the native odd and even image half-data sets. Each data set was low-pass filtered to 8.3 Å, processed as described above and scaled to the corresponding full-data native map before calculating the differences as a measure of error. The histogram of voxels between 79 and 160 Å from the virus center (including all of the capsid protein) yielded a standard deviation that should correspond to the random error of difference maps and approximately sqrt(2) times the error of separate native and complex maps. In the discussion below, contours will be described in estimated error units (e.u.) rather than standard deviation or sigma. The latter are often cited in this context, but usually refer to the variance of the density which is a measure of both real signal in a map and noise. Note also that the noise is estimated only from regions containing virus, and is therefore not lowered by inclusion of solvent regions. Density was compared to the atomic structure of AAV-2 (RCSB entry 1LP3) ( Xie et al., 2002 ) using the molecular graphics program CHIMERA ( Pettersen et al., 2004 ), after expanding the icosahedral symmetry. The electrostatic surface potential was calculated by the Poisson-Boltzmann equation using the program APBS ( Baker et al., 2001 ), with the structure of the entire capsid, and assuming a saline like solvent at 0.15M salt.
Show full methods section
Virus was propagated in HeLa cells, and purified by cesium chloride density gradient ultracentrifugation as previously described ( Xie et al., 2004 ). Virus was dialyzed out of the 3M CsCl salt and into a low salt buffer (125mM NaCl, 10mM Tris, and 1mM MgCl 2 pH 7.5) using 50μl custom-built microdialysis cells. Quantifoil R2/1 grids were used to prepare vitrified, thin layer samples. The grids were pre-coated with carbon, but an additional continuous carbon layer was applied to enhance contrast for particle identification and strengthen the Thon rings of the power spectrum used to determine the appropriate contrast transfer function (CTF) correction. The grids were glow discharged immediately prior to sample application. For the native sample, 4μl of virus solution at 1.1 mg/ml was applied to grids, blotted to remove excess, and plunged into liquid ethane for vitrification. Grids were transferred to liquid nitrogen for long term storage. Attempts to pre-incubate virus with heparin for as little as an hour, resulted in severe aggregation, even with10-fold molar excess of heparin relative to capsid protein (600-fold excess relative to virus particles). The aggregates, containing many virus particles cross-linked by heparin, were not suitable for the preparation of thin specimens needed for high resolution EM. Thus, samples were prepared using dilute AAV-2 that had been pre-adsorbed onto EM grids, such that heparin polymers were complexed with individual viruses that were of fixed location. Note that the procedure is different from the chemical fixation used in other types of microscopy, in that the adsorption involves weak, non-specific interactions that are neither expected to induce conformational distortions or to inhibit changes induced by ligands. However, the procedure will reduce slightly the occupancy of the receptor, because a handful of the 60 symmetry-equivalent binding sites will be occluded where the virus contacts the EM grid. Heparin was purchased from Sigma Aldrich, Inc. (sodium salt, ∼17kDa fragment, catalog # H3393) and solubilized in distilled water at 10mg/ml. 4μl of virus at 1.1 mg/ml was added to the grid, as before. After blotting off excess, 4μl of receptor solution at 2.5 mg/ml was added to achieve a 10-fold molar excess relative to the capsid protein that had been applied. Thirty seconds later, the grids were again blotted and flash frozen. The grids were transferred to a pre-cooled Gatan cryotransfer holder and inserted into a Philips CM-300 FEG electron microscope. Images were collected under low dose conditions (20e − /Å 2 ) at 300kV onto a 4K × 4K CCD camera at a magnification of 6.1 × 10 4 , which corresponds to an effective pixel size of 2.45 Å and a Nyquist sampling limit of 4.9Å. All 2D and 3D processing were performed with the EMAN software suite ( Ludtke, Baldwin, and Chiu, 1999 ). CTFIT was used to assess image quality. For this, each 4k × 4k pixel image was sampled with 512 × 512 pixel sized boxes for power spectrum analysis. Images with signs of drift or astigmatism were excluded. Particles within a defocus range of 0.8 to 3.8 μm were selected automatically with the AUTOBOX option in the BOXER program, and manually checked for the presence of ice crystals, broken particles, or debris. The refinement of parameters describing the orientation of virus particles projected in the 2-D EM images (projection alignment) requires a starting 3-D map. Convergence might have been quicker had the starting map been simulated from the known crystal structure. However, to avoid bias, the initial map for was built de novo from the EM images, assuming only that they contained icosahedral symmetry. In the STARTICOS program of EMAN, the data are searched for particles with approximate 5-, 3-, or 2-fold symmetry (in projection), indicating that the symmetry axis in the 3-D particles was approximately parallel to the projection direction. Particles exhibiting each of the symmetries were aligned and grouped into class averages. A 3-D map can then be constructed using the known angular relations of the icosahedral symmetry axes. Initial reconstructions were performed with low pass filtered (20 Å) images and refined until features of the virus began to emerge. To increase the resolution, data were corrected for the CTF and the refinement was continued. Particles were clustered into 179 classes, each corresponding to a different projection direction within the asymmetric unit. Each cycle of 3-D particle reconstruction involved 3 rounds of iterative 2-D class averaging. Individual particle images were excluded if their correlation differed by more than 0.8 standard errors from the mean. 68% and 70% of the total native and complex particles respectively were included in the final refinement. To further remove reference bias and to be sure that features in the map of the complex were real, the final 3-D map was reconstructed using 2-D projection images whose orientations were refined with reference to the native map. The resolution was assessed by Fourier Shell Correlation between even and odd maps with a cutoff of 0.5. Complex minus native difference maps were calculated using the “DR DIFF” procedure of the SPIDER program ( Frank et al., 1996 ). In this procedure the maps are scaled to least-squares minimize their discrepancy within an optionally masked region. Prior to scaling, each map was low-pass filtered to the same 8.3 Å resolution as the complexed particles. For scaling complex to native, the mask was a spherical shell between 79 and 125 Å, thereby including most of the capsid protein, but excluding the primary heparin site which began about 127 Å from the center (and the 3-fold capsid spikes). For difference map calculation, all maps were brought to a common scale – that of the low-pass filtered native map, so that a single estimate of the experimental noise could be used. The significance of features in the maps, relative to noise, was assessed though analysis of a “mock” difference map, calculated between the native odd and even image half-data sets. Each data set was low-pass filtered to 8.3 Å, processed as described above and scaled to the corresponding full-data native map before calculating the differences as a measure of error. The histogram of voxels between 79 and 160 Å from the virus center (including all of the capsid protein) yielded a standard deviation that should correspond to the random error of difference maps and approximately sqrt(2) times the error of separate native and complex maps. In the discussion below, contours will be described in estimated error units (e.u.) rather than standard deviation or sigma. The latter are often cited in this context, but usually refer to the variance of the density which is a measure of both real signal in a map and noise. Note also that the noise is estimated only from regions containing virus, and is therefore not lowered by inclusion of solvent regions. Density was compared to the atomic structure of AAV-2 (RCSB entry 1LP3) ( Xie et al., 2002 ) using the molecular graphics program CHIMERA ( Pettersen et al., 2004 ), after expanding the icosahedral symmetry. The electrostatic surface potential was calculated by the Poisson-Boltzmann equation using the program APBS ( Baker et al., 2001 ), with the structure of the entire capsid, and assuming a saline like solvent at 0.15M salt.
📊 Figures
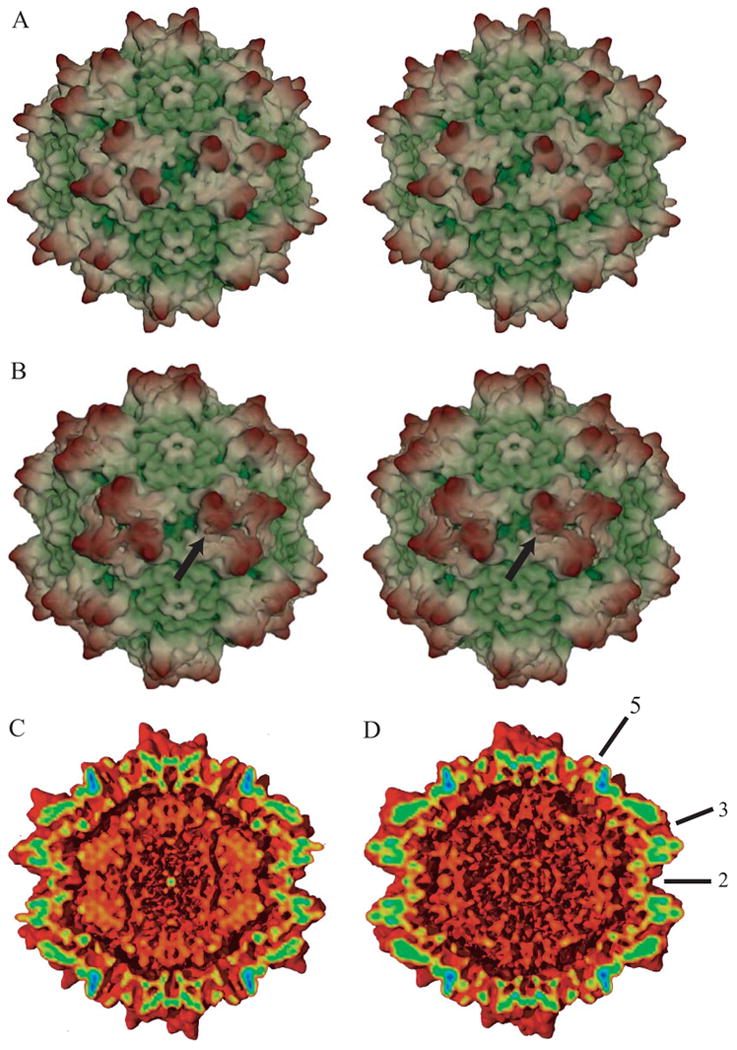
Figure 1
3-D electron microscope reconstructions of native (A & C) and heparin-complexed AAV-2 (B & D) at 7.8 and 8.3 u01fa resolution respectively. Panels A & B show stereo pairs of the outer surface, while C...
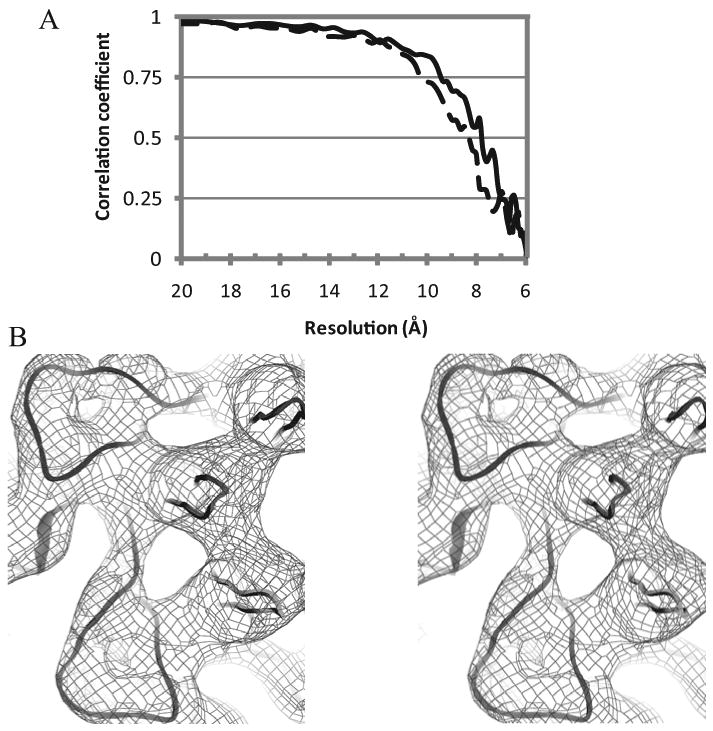
Figure 2
Assessment of map quality
(A) Fourier shell correlation (FSC) comparing the signal from two halves of the image set as a function of resolution. The correlation for the virus alone is shown in solid line and that of the hepari...
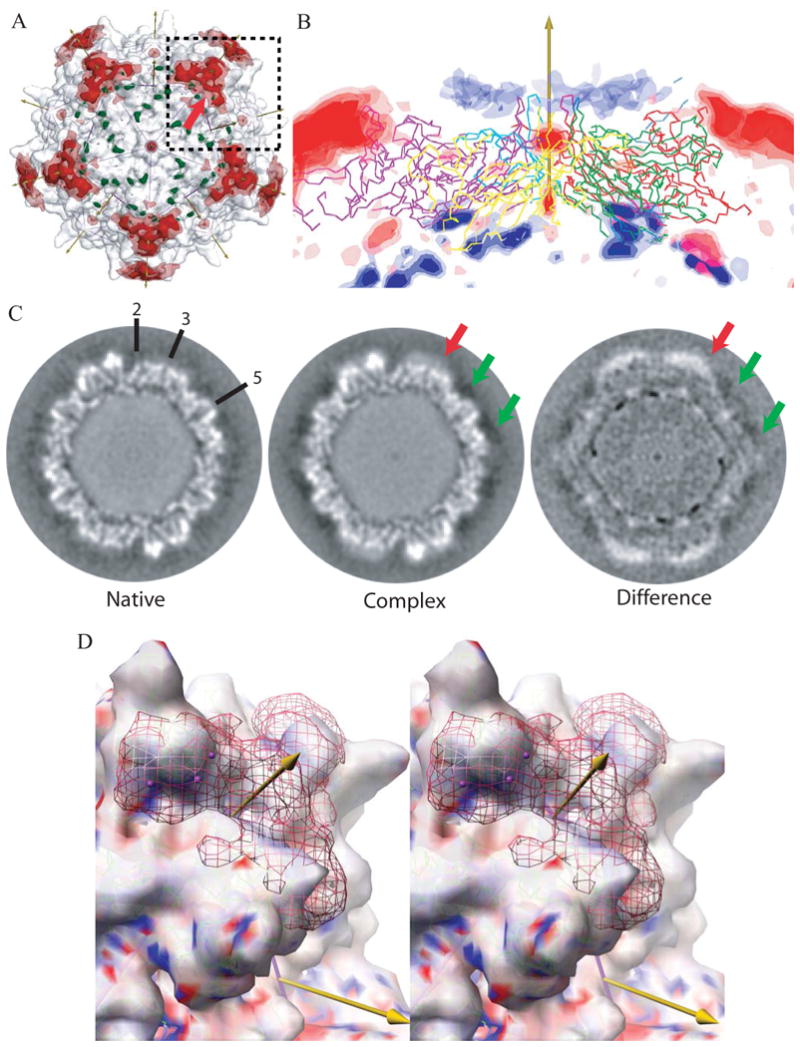
Figure 3
Differences between cryo-EM reconstructions of the heparin-complex and native AAV-2
(A) Superimposed on the EM reconstruction of the native particle (gray translucent surface) are the positive (red) and negative (green) regions of the difference map. The icosahedral symmetry axes are...
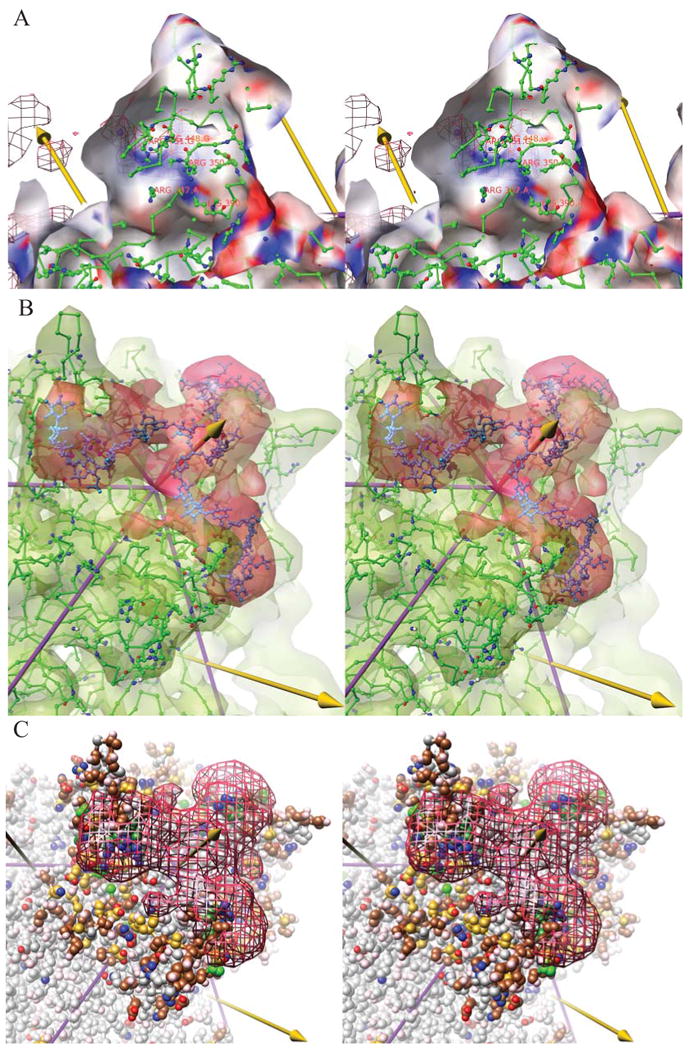
Figure 4
Molecular interpretation of EM results (stereoscopic images)
(A) The interactions of the viral protein with the heparin are best illustrated by looking outwards from inside one of the peaks surrounding a three-fold (left arrow). In this stereodiagram, the cut-a...
Figure images are served from the NIH/NLM PubMed Central Open Access Subset or Europe PMC; copyright remains with the publishers and authors.
💬 Discussion
0 commentsNo comments yet. Be the first to start a discussion!
Leave a Comment