Abstract
Abstract Heterotrophic microbial communities process much of the carbon fixed by phytoplankton in the ocean, thus having a critical role in the global carbon cycle. A major fraction of the phytoplankton-derived substrates are high-molecular-weight (HMW) polysaccharides. For bacterial uptake, these substrates must initially be hydrolysed to smaller sizes by extracellular enzymes. We investigated polysaccharide hydrolysis by microbial communities during a transect of the Atlantic Ocean, and serendipitously discovered—using super-resolution structured illumination microscopy—that up to 26% of total cells showed uptake of fluorescently labelled polysaccharides (FLA-PS). Fluorescence in situ hybridisation identified these organisms as members of the bacterial phyla Bacteroidetes and Planctomycetes and the gammaproteobacterial genus Catenovulum. Simultaneous membrane staining with nile red indicated that the FLA-PS labelling occurred in the cell but not in the cytoplasm. The dynamics of FLA-PS staining was further investigated in pure culture experiments using Gramella forsetii, a marine member of Bacteroidetes. The staining patterns observed in environmental samples and pure culture tests are consistent with a ‘selfish’ uptake mechanisms of larger oligosaccharides (>600 Da), as demonstrated for gut Bacteroidetes. Ecologically, this alternative polysaccharide uptake mechanism secures substantial quantities of substrate in the periplasmic space, where further processing can occur without diffusive loss. Such a mechanism challenges the paradigm that hydrolysis of HMW substrates inevitably yields low-molecular-weight fragments that are available to the surrounding community and demonstrates the importance of an alternative mechanism of polysaccharide uptake in marine bacteria.
🔬 Techniques
🔭 Microscopes
💻 Software
✨ Fluorophores
🧪 Sample Preparation
🔬 Cell Lines
🏭 Microscope Brands
🧪 Reagent Suppliers
📷 Detectors
🔎 Objectives
💻 Software Details
🏛️ Research Organizations (ROR)
Affiliated research institutions:
📋 Methods
Sampling and substrate incubations Seawater samples were collected aboard the RRV James Cook during the Atlantic Meridional Transect 22 cruise from Southampton, UK, to Punta Arenas, Chile, from 10 October to 24 November 2012. In five different oceanic provinces ( Supplementary Figure S1 ) at solar noon, triplicate 20 litre seawater samples were collected from 20 m depth using a Niskin rosette with an attached Sea Bird CTD (Sea Bird Electronics Inc., Bellevue, WA, USA). From each triplicate, subsamples of 500 ml were added to sterile glass bottles and incubated with one of the three FLA-PS, laminarin, chondroitin sulphate and xylan (nine bottles in total), for a total of 12–18 days. In addition, a treatment control, consisting of 500 ml seawater in a sterile glass bottle without a FLA-PS, as well as killed controls, consisting of 50 ml autoclaved seawater with one of the three FLA-PS, were incubated under the same conditions. All bottles were incubated at room temperature (RT) in the dark and sampled at regular time points (typically at 30 min, 1, 3, 6, 12 and 18 days). At each time point, samples for FISH analysis, measurement of extracellular enzyme activities and DNA analysis were collected. For FISH, 20 ml of water was filtered through a 47 mm (0.2 μm pore size) polycarbonate filter, applying a gentle vacuum of 50 000 daltons, respectively. A single polysaccharide was added at a concentration of 1.75 μmol monomer-equivalent to each 500 ml water sample; each polysaccharide was incubated in triplicate, plus one killed control, as described above. Substrate staining, FISH and epifluorescence microscopy For all the time points, the cells were filtered as described and counter-stained with 4',6-diamidino-2-phenylindole (DAPI) and nile red and subsequently mounted using a Citifluor/VectaShield (4:1) mounting solution. Substrate-stained cells were visualised and enumerated using a fully automated microscope imaging system, described in detail by Bennke et al. (2016) , on a Zeiss AxioImager.Z2 microscope stand (Carl Zeiss MicroImaging GmbH, Göttingen, Germany) with a cooled charged-coupled-device (CCD) camera (AxioCam MRm; Carl Zeiss) and a Colibri LED light source (Carl Zeiss) with three light-emitting diodes (UV-emitting LED, 365±4.5 nm for DAPI; blue emitting LED, 470±14 nm for FLA-PS 488; red-emitting LED, 590±17.5 nm for the tyramide Alexa 594, FISH), combined with the HE-62 multifilter module (Carl Zeiss). This module consists of a triple emission filter TBP 425 (±25), 527 (±27), LP 615, including a triple beam splitter of TFT 395/495/610. All automatic cell counts were validated using manual cell counting. Briefly automated cell counting was carried out by initially acquiring images (using a 63 × magnification and 1.4 numerical aperture oil emersion plan apochromatic objective (Carl Zeiss)), at selected wavelengths (DAPI, FLA-PS, FISH), of a previously defined set of coordinates consisting of a minimum of 46 fields of view on each sample filter ( Bennke et al. , 2016 ). Subsequently, the images were imported into the ACMETOOL2.0 ( http://www.technobiology.ch/index.php?id=acmetool ) image analysis software. From the images, cells were deemed ‘substrate stained’ if they showed a positive signal in both the DAPI and FLA-PS (488) images. Additionally, these signals had to have a minimum overlap of 30%, a minimum area of 17 or 30 pixel (0.17–0.3 μm 2 ) (DAPI signal and FLA-PS signal, respectively) and a minimum signal background ratio of 1 or 2.5 (DAPI and FLA-PS signals, respectively) ( Bennke et al. 2016 ). FISH was carried out with slight alterations of the protocol by Manz et al. (1992) . The hybridisation buffer contained 900 m M NaCl, 20 m M Tris-HCl (pH 7.5), 0.02% sodium dodecyl sulphate, 10% dextran sulphate (wt/vol) and 1% (wt/vol) blocking reagent (Boehringer; Mannheim, Germany) with a formamide concentration optimised for individual probes ( Supplementary Table S1 ). All hybridisations were carried out at 46 °C in a humidity chamber for 3 h, with a subsequent wash in a buffer containing 14–900 m M NaCl (dependent on formamide concentration in the hybridisation buffer), 20 m M Tris/HCl (pH 8), 5 m M EDTA (pH 8) and 0.01% sodium dodecyl sulphate at 48 °C. For super-resolution structured illumination microscopy (SR-SIM), the cells were initially scraped from the filter using a sterile scalpel and heat fixed to coverslips at 46 °C. After heat fixation, FISH was carried out as described above.
Show full methods section
Sampling and substrate incubations Seawater samples were collected aboard the RRV James Cook during the Atlantic Meridional Transect 22 cruise from Southampton, UK, to Punta Arenas, Chile, from 10 October to 24 November 2012. In five different oceanic provinces ( Supplementary Figure S1 ) at solar noon, triplicate 20 litre seawater samples were collected from 20 m depth using a Niskin rosette with an attached Sea Bird CTD (Sea Bird Electronics Inc., Bellevue, WA, USA). From each triplicate, subsamples of 500 ml were added to sterile glass bottles and incubated with one of the three FLA-PS, laminarin, chondroitin sulphate and xylan (nine bottles in total), for a total of 12–18 days. In addition, a treatment control, consisting of 500 ml seawater in a sterile glass bottle without a FLA-PS, as well as killed controls, consisting of 50 ml autoclaved seawater with one of the three FLA-PS, were incubated under the same conditions. All bottles were incubated at room temperature (RT) in the dark and sampled at regular time points (typically at 30 min, 1, 3, 6, 12 and 18 days). At each time point, samples for FISH analysis, measurement of extracellular enzyme activities and DNA analysis were collected. For FISH, 20 ml of water was filtered through a 47 mm (0.2 μm pore size) polycarbonate filter, applying a gentle vacuum of 50 000 daltons, respectively. A single polysaccharide was added at a concentration of 1.75 μmol monomer-equivalent to each 500 ml water sample; each polysaccharide was incubated in triplicate, plus one killed control, as described above. Substrate staining, FISH and epifluorescence microscopy For all the time points, the cells were filtered as described and counter-stained with 4',6-diamidino-2-phenylindole (DAPI) and nile red and subsequently mounted using a Citifluor/VectaShield (4:1) mounting solution. Substrate-stained cells were visualised and enumerated using a fully automated microscope imaging system, described in detail by Bennke et al. (2016) , on a Zeiss AxioImager.Z2 microscope stand (Carl Zeiss MicroImaging GmbH, Göttingen, Germany) with a cooled charged-coupled-device (CCD) camera (AxioCam MRm; Carl Zeiss) and a Colibri LED light source (Carl Zeiss) with three light-emitting diodes (UV-emitting LED, 365±4.5 nm for DAPI; blue emitting LED, 470±14 nm for FLA-PS 488; red-emitting LED, 590±17.5 nm for the tyramide Alexa 594, FISH), combined with the HE-62 multifilter module (Carl Zeiss). This module consists of a triple emission filter TBP 425 (±25), 527 (±27), LP 615, including a triple beam splitter of TFT 395/495/610. All automatic cell counts were validated using manual cell counting. Briefly automated cell counting was carried out by initially acquiring images (using a 63 × magnification and 1.4 numerical aperture oil emersion plan apochromatic objective (Carl Zeiss)), at selected wavelengths (DAPI, FLA-PS, FISH), of a previously defined set of coordinates consisting of a minimum of 46 fields of view on each sample filter ( Bennke et al. , 2016 ). Subsequently, the images were imported into the ACMETOOL2.0 ( http://www.technobiology.ch/index.php?id=acmetool ) image analysis software. From the images, cells were deemed ‘substrate stained’ if they showed a positive signal in both the DAPI and FLA-PS (488) images. Additionally, these signals had to have a minimum overlap of 30%, a minimum area of 17 or 30 pixel (0.17–0.3 μm 2 ) (DAPI signal and FLA-PS signal, respectively) and a minimum signal background ratio of 1 or 2.5 (DAPI and FLA-PS signals, respectively) ( Bennke et al. 2016 ). FISH was carried out with slight alterations of the protocol by Manz et al. (1992) . The hybridisation buffer contained 900 m M NaCl, 20 m M Tris-HCl (pH 7.5), 0.02% sodium dodecyl sulphate, 10% dextran sulphate (wt/vol) and 1% (wt/vol) blocking reagent (Boehringer; Mannheim, Germany) with a formamide concentration optimised for individual probes ( Supplementary Table S1 ). All hybridisations were carried out at 46 °C in a humidity chamber for 3 h, with a subsequent wash in a buffer containing 14–900 m M NaCl (dependent on formamide concentration in the hybridisation buffer), 20 m M Tris/HCl (pH 8), 5 m M EDTA (pH 8) and 0.01% sodium dodecyl sulphate at 48 °C. For super-resolution structured illumination microscopy (SR-SIM), the cells were initially scraped from the filter using a sterile scalpel and heat fixed to coverslips at 46 °C. After heat fixation, FISH was carried out as described above.
Super-resolution structured illumination microscopy
Substrate incubation samples were visualised on a Zeiss ELYRA PS.1 (Carl Zeiss) using 561, 488 and 405 nm lasers and BP 573-613, BP 502-538 and BP 420-480+LP 750 optical filters. Z -stack images were taken with a Plan-Apochromat 63 × /1.4 Oil objective and processed with the software ZEN2011 (Carl Zeiss). SR-SIM images are taken by exciting the sample using non-uniform wide-field illumination. The laser light passes through an optical grating, generating a striped-shaped sinusoidal interference pattern. This pattern then combines with the sample information originating from structures below the diffraction limit to generate moire fringes. The image is detected by a CCD camera and contains high spatial frequency sample information shifted to a lower spatial frequency band that is transmitted through the objective. Mathematical reconstructions from raw image slices then allow for a reconstruction of a high-resolution image with doubled resolution in the xy plane ( Schermelleh et al. , 2010 ). Intensity line profiles of individual cells were carried out using the ZEN black software (Carl Zeiss).
Medium preparation
HaHa medium was prepared as described in detail by Hahnke and Harder (2013) and Hahnke et al. (2015) . The basic HaHa medium was supplemented with 0.2 μm sterile filtered carbon sources (glucose, cellobiose, yeast extract, peptone, casamino acids ( Hahnke and Harder, 2013 ), laminarin (Sigma-Aldrich) and FLA-laminarin) to make different carbon source media ( Supplementary Table S2 ).
Pure culture
FLA-PS incubations FLA-PS incubations were performed using a pure culture of Gramella forsetii strain KT0803 (DSM 17595), a marine member of Bacteroidetes . All growth experiments were carried out in biological duplicates. For all incubations and sampling time points (see below), cell growth and FLA-substrate uptake was analysed by fixing 1 ml of culture using 2% sterile filtered formaldehyde for 1 h at RT. Subsequently, the sample was filtered through a 25 mm polycarbonate filter (0.2 μm pore size), applying a gentle vacuum of
📊 Figures
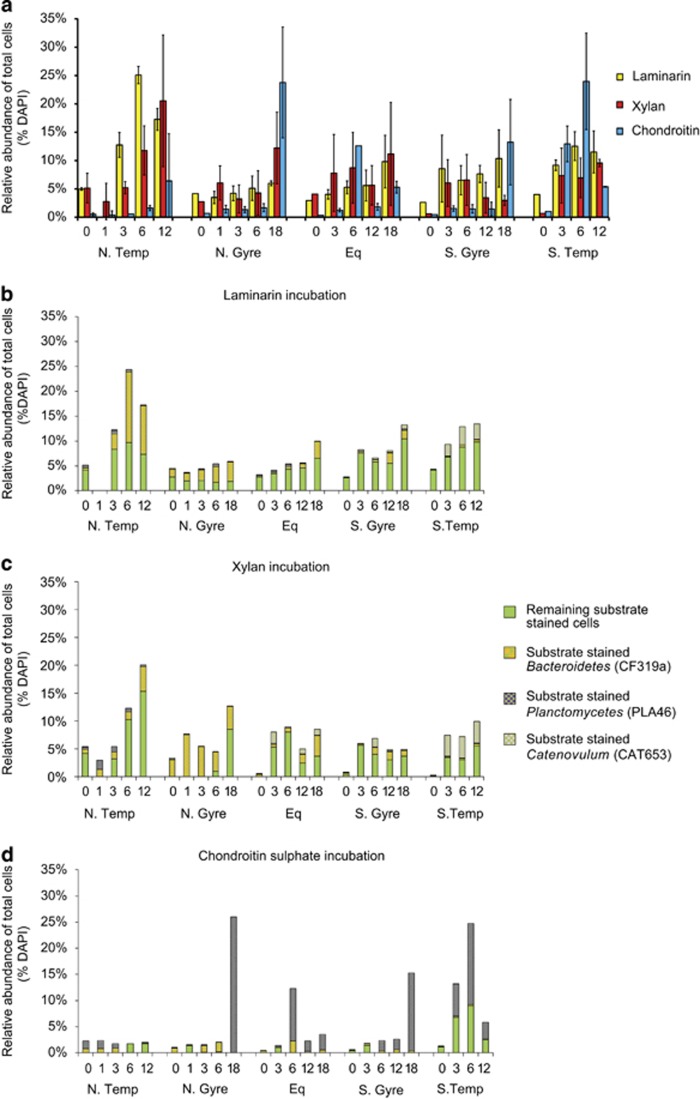
Figure 1
Relative abundance of substrate-stained cells and FISH identification of substrate-stained cells in incubations of seawater from five stations of different provinces of the Atlantic Ocean (see Supplem...
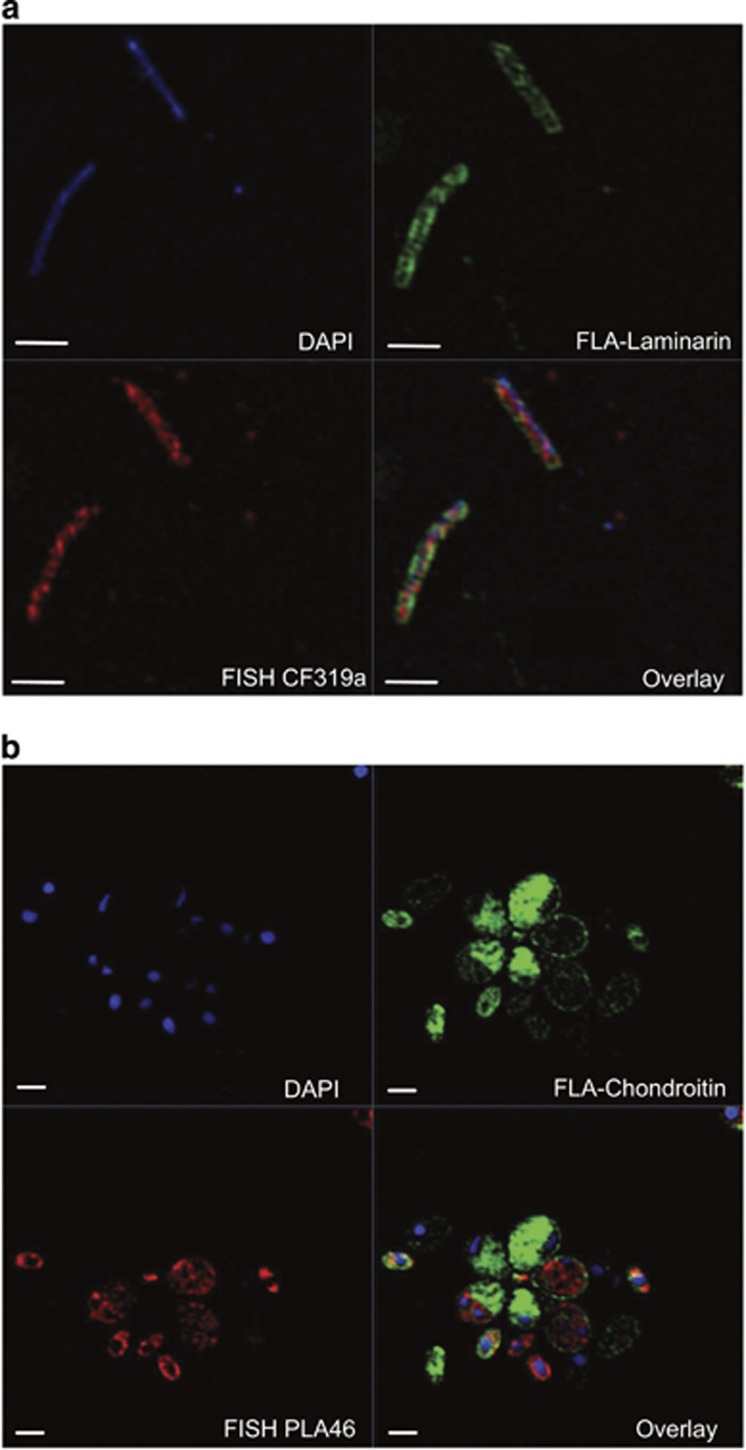
Figure 2
SR-SIM of cells stained by ( a ) DAPI (blue), FLA-laminarin (green) and Bacteroidetes -specific FISH probe (CF319a, red); ( b ) DAPI (blue), FLA-chondroitin sulphate (green) and Planctomycetes -specif...
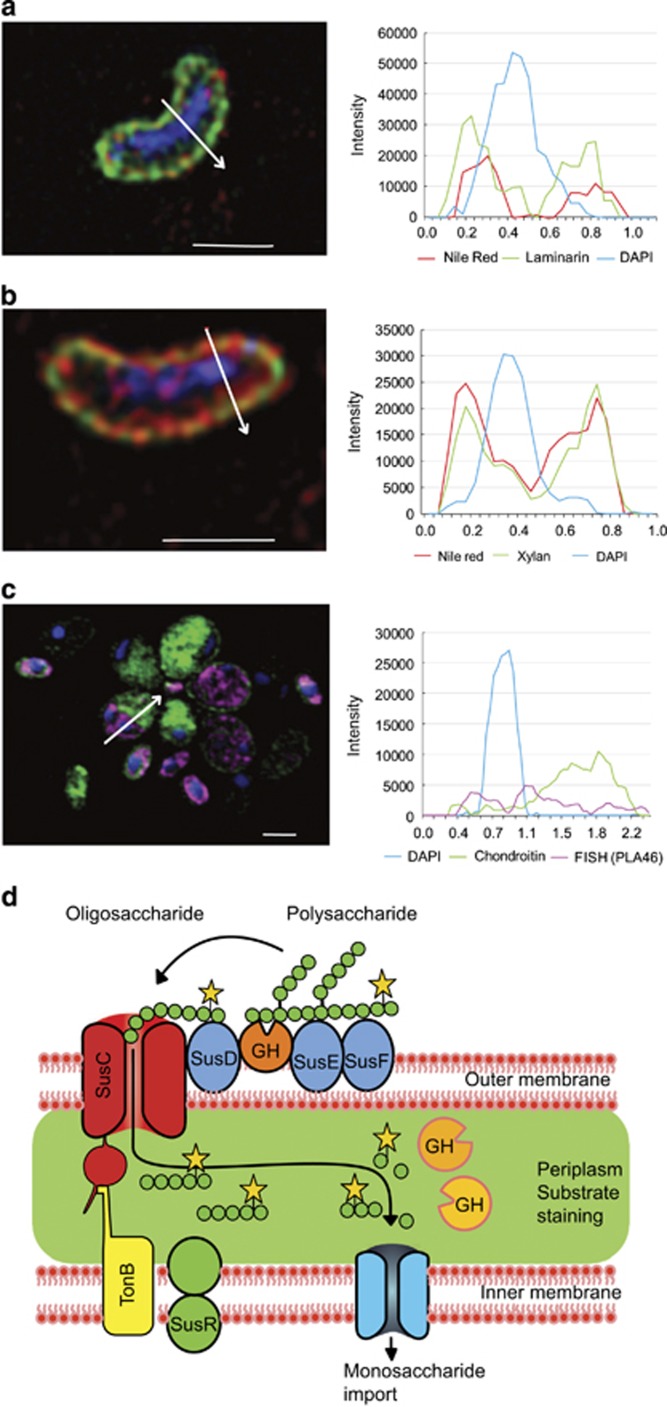
Figure 3
SR-SIM images showing Sus-like uptake of FLA-PS and fluorescence intensity line profiles localising substrate-specific staining after 6 days of incubation. ( a and b ) Cells stained with FLA-PS (green...
Figure images are served from the NIH/NLM PubMed Central Open Access Subset or Europe PMC; copyright remains with the publishers and authors.
💬 Discussion
0 commentsNo comments yet. Be the first to start a discussion!
Leave a Comment