Abstract
Abstract Apolipoprotein E (ApoE) is a multifaceted secreted molecule synthesized in the CNS by astrocytes and microglia, and in the periphery largely by the liver. ApoE has been shown to impact the integrity of the blood–brain barrier, and, in humans, the APOE4 allele of the gene is reported to lead to a leaky blood–brain barrier. We used allele specific knock-in mice expressing each of the common (human) ApoE alleles, and longitudinal multiphoton intravital microscopy, to directly monitor the impact of various ApoE isoforms on blood–brain barrier integrity. We found that humanized APOE4, but not APOE2 or APOE3, mice show a leaky blood–brain barrier, increased MMP9, impaired tight junctions, and reduced astrocyte end-foot coverage of blood vessels. Removal of astrocyte-produced ApoE4 led to the amelioration of all phenotypes while the removal of astrocyte-produced ApoE3 had no effect on blood–brain barrier integrity. This work shows a cell specific gain of function effect of ApoE4 in the dysfunction of the BBB and implicates astrocyte production of ApoE4, possibly as a function of astrocytic end foot interactions with vessels, as a key regulator of the integrity of the blood–brain barrier.
🔬 Techniques
🔭 Microscopes
💻 Software
✨ Fluorophores
🧪 Sample Preparation
🔬 Cell Lines
🏭 Microscope Brands
🧪 Reagent Suppliers
🔴 Lasers
💻 Software Details
🏛️ Research Organizations (ROR)
Affiliated research institutions:
📋 Methods
Animals Conditional humanized APOE knock-in
(KI) mice 19 were used for the study. These mouse lines were generated by replacing the endogenous mouse gene from the initiation codon to the termination codon by its human counterparts ( APOE-E2 , APOE-E3 and APOE-E4 ), flanking exons 2 to 4 with LoxP sites. 18 , 19 Apoe knockout (KO) mice were also used (The Jackson Laboratory). To generate mice with conditional knockout of huApoE in astrocytes, APOE -KI were crossed with tamoxifen inducible ALDH1L1-CRE mice (The Jackson Laboratory) for two successive generations to obtain heterozygous ALDH1L1 -Cre mice homozygous for various APOE isoforms. Genotyping for APOE and ALDH1L1-CRE were performed by PCR following protocols given by The Jackson’s Laboratory ( Apoe KO, ALDH1L1-CRE) or Taconic (huAPOE). Mice are termed APOE2, APOE3, APOE4 and APOE KO throughout the paper. Mice that have undergone flox recombination are termed APOE3 astrocyte knockout (aKO) and APOE4 aKO. Mice were group-housed in accredited facilities with temperature and humidity controls and were under a 12-h light/dark cycle. Mice had access to food and water ad libitum throughout all phases of the experiments. All animal experiments were approved by the Massachusetts General Hospital Subcommittee on Research Animal Care following the guidelines set forth by the National Institutes of Health Guide for the Care and Use of Laboratory Animals. Cranial window surgery At 8–8.5 months old, mice were anaesthetized with isoflurane (1–1.5% in oxygen) and a cranial window was implanted by removing a piece of skull above the somatosensory cortex and replacing it with an 8 mm diameter cover glass (as described previously 20 ). The cover glass was secured in place with dental cement mixed with crazy glue which allows for long term placement of the cover glass. After surgery, mice recovered for 3 weeks before imaging.
Show full methods section
Animals Conditional humanized APOE knock-in
(KI) mice 19 were used for the study. These mouse lines were generated by replacing the endogenous mouse gene from the initiation codon to the termination codon by its human counterparts ( APOE-E2 , APOE-E3 and APOE-E4 ), flanking exons 2 to 4 with LoxP sites. 18 , 19 Apoe knockout (KO) mice were also used (The Jackson Laboratory). To generate mice with conditional knockout of huApoE in astrocytes, APOE -KI were crossed with tamoxifen inducible ALDH1L1-CRE mice (The Jackson Laboratory) for two successive generations to obtain heterozygous ALDH1L1 -Cre mice homozygous for various APOE isoforms. Genotyping for APOE and ALDH1L1-CRE were performed by PCR following protocols given by The Jackson’s Laboratory ( Apoe KO, ALDH1L1-CRE) or Taconic (huAPOE). Mice are termed APOE2, APOE3, APOE4 and APOE KO throughout the paper. Mice that have undergone flox recombination are termed APOE3 astrocyte knockout (aKO) and APOE4 aKO. Mice were group-housed in accredited facilities with temperature and humidity controls and were under a 12-h light/dark cycle. Mice had access to food and water ad libitum throughout all phases of the experiments. All animal experiments were approved by the Massachusetts General Hospital Subcommittee on Research Animal Care following the guidelines set forth by the National Institutes of Health Guide for the Care and Use of Laboratory Animals. Cranial window surgery At 8–8.5 months old, mice were anaesthetized with isoflurane (1–1.5% in oxygen) and a cranial window was implanted by removing a piece of skull above the somatosensory cortex and replacing it with an 8 mm diameter cover glass (as described previously 20 ). The cover glass was secured in place with dental cement mixed with crazy glue which allows for long term placement of the cover glass. After surgery, mice recovered for 3 weeks before imaging.
Two-photon imaging
Mice were anaesthetized with isoflurane (1–1.5%) in oxygen and the coverglass was cleaned with 70% ethanol. Mice were imaged on an Olympus FluoView FV1000MPE multiphoton laser scanning system mounted on an Olympus BX61WI microscope and an Olympus 25× dipping objective (NA = 1.05, Olympus), with the emission path shielded from external light contamination. A DeepSee Mai Tai Ti:sapphire mode-locked laser (Mai Tai; Spectra-Physics) generated two-photon excitation at 800 nm, and detectors containing three photomultiplier tubes (PMTs; Hamamatsu) collected emitted light in the range of 380–480, 500–540, and 560–650 nm. PMTs settings remained unchanged throughout the different imaging sessions, but laser power was adjusted as needed. Immediately prior to imaging 0.1 ml fluorescein conjugated 40 kDa dextran (1.5 mg/ml) was injected retro-orbitally. Two fields of view were captured every 10 min (Z-series, 508 μm × 508 μm, 2 μm slices, depth of 100–200 μm) per mouse for 30 min. Mice were kept warm on a heat pad during imaging and after imaging the mouse was allowed to recover on a heating pad and then returned to its home cage.
Two-photon image processing
All images were opened in grey scale and the intra and extravascular fluorescence intensity was measured using the NIH ImageJ Integrated Density measurement function by an investigator blind to genotype. The in vivo BBB permeability for dextran was calculated as the normalized leakage by ( I t − I 0 )/ I 0 × 100 where I 0 is the fluorescence intensity within the parenchyma at time point 0 and I t is the intensity at the measured time point for the same cerebral region of interest.
Tamoxifen injection
Mice were injected intraperitoneally at ∼9.75 months of age with 100 mg/kg of tamoxifen (Tam) diluted to 20 mg/ml in corn oil or corn oil as a vehicle control. Mice were injected once per day for 4 days and were monitored. Mice were imaged for their second imaging session 1 week after the first day of tamoxifen injection. The third imaging session took place 1 month after tamoxifen injection and the fourth session occurred ∼2 months after tamoxifen (for five mice the final imaging session was delayed or brought forward by 1 week due to COVID-19 shutdowns, mice were not imaged further than 1 week from their intended 2 month imaging date). Mice in which technical issues precluded further imaging were included in analysis for all imaging sessions accomplished and were culled and processed for biochemistry, electron microscopy and/or RNAscope.
Tissue collection
Mice were culled using lethal dose of isoflurane in oxygen. Blood was collected using an EDTA-coated needle via cardiac puncture and spun for 10 min at 1500 g to obtain plasma. The mouse was then perfused with ice-cold phosphate-buffered saline (PBS) and tissue collected for immunohistochemical and/or biochemical analysis. A 4 mm thick coronal slice was removed from the middle of the right hemisphere and fixed by immersion in 4% paraformaldehyde in PBS for 48 h before being embedded in paraffin while a 2 mm thick coronal slice was removed from the middle of the left hemisphere and fixed by immersion in 1% paraformaldehyde and 1% glutaraldehyde in 0.1 M sodium cacodylate before being processed for electron microscopy. The cerebellum was removed and snap frozen for DNA extraction while the remainder of the brain was snap frozen and processed for RNA and protein extraction. Due to the size of the mouse brain not all mice were processed for all analyses and n numbers fluctuated. Graphs display each individual mouse as a data-point and thus mouse numbers per genotype or condition are indicated by each experimental results graph.
PCR for monitoring
Cre-dependent recombination DNA was extracted from the cerebellum using the DNeasy blood and tissue kit (Qiagen) and its concentration measured on a NanoDrop spectrophotometer (ThermoFisher). A small fragment of DNA corresponding to the site of flox recombination was amplified using KAPA taq PCR master mix (Roche). The forward primer was GGGTTACCTCCAGGAAGGAG and the reverse primer was CTCGACCTTGTCCATGTCCT. The resulting product was run on a 2% agarose gel with ethidium bromide at 120 V in TAE buffer for 1 h and imaged using UV.
Blood vessel isolation
Blood vessels were isolated from frozen mouse tissue as described previously. 21 , 22 A ∼200 mg piece of forebrain was minced into small pieces in ice cold buffer 1 Hanks Balanced Salt Solution (HBSS) with 10 mM HEPES, pH 7, and then manually homogenized using a dounce homogenizer. The homogenate was then transferred to a 50 ml conical tube containing 20 ml of Buffer 1 and centrifuged at 2000 g for 10 min at 4°C. The supernatant was discarded and the pellet was resuspended by shaking in 20 ml of Buffer 2 (18% dextran in HEPES-buffered HBSS). Samples were centrifuged again at 4400 g for 15 min at 4°C. Myelin was removed by carefully pouring out the supernatant and wiping the upper part of the tube with a kim wipe. The pellet was resuspended in 2 ml chilled 1% bovine serum albumin (BSA) HEPES-buffered HBSS and filtered through a 20 μm mesh (Millipore). The filter was rinsed with 30 ml 1% BSA HEPES-buffered HBSS and then blood vessels were collected by immersing the filter in a new conical containing 30 ml of the same buffer and shaking gently before centrifuging for 10 min at 2000 g at 4°C. The pellet was resuspended in 1 ml of the same buffer, transferred to a 1.5 ml Eppendorf and centrifuged at 3000 g for 10 min at 4°C. The buffer was removed and RNA was extracted from a section of forebrain using the RNeasy Mini Kit (Qiagen). Quantitative PCR RNA was extracted from a section of forebrain using the RNeasy Mini Kit (Qiagen) and was eluted in 80 μl of nuclease-free water. RNA was assessed using a NanoDrop spectrophotometer (ThermoFisher) and diluted to a standard concentration of 7.1 ng/μl for each sample. cDNA was synthesized using the QuantiTect Reverse Transcription kit (Qiagen) and was combined with RT 2 SYBR Green Mastermix fluorescent dye (Qiagen). Primers for APOE (QT00087297) Gapdh (QT00199388) Gtfb 2 (QT00156569) and Mmp9 (QT00108815) were ordered from Qiagen. Genes of interest ( APOE and Mmp9) were run alongside two housekeeping genes that were used to normalize for RNA amount. The plate was covered with a plastic seal to prevent sample evaporation and briefly spun at ∼300 g to remove bubbles. The qPCR reactions were performed using the BioRad CFX96 Real-Time Detection System. The sequence began with a 10-min incubation at 95°C to activate the DNA polymerase enzyme. Fluorescence data collection then commenced with 40 cycles of alternating 15 s at 95°C and 60 s at 60°C. The ΔΔCT relative quantification method was used to calculate gene expression. Two reference genes were included in the RT 2 -Profiler array: GTF2B and GAPDH. The geometric mean of the reference gene Ct values was calculated for each animal and subtracted from the Ct value of each target gene, yielding ΔCT values. For each gene, the average ΔCT value from APOE3 animals was then subtracted from each sample's ΔCT value to obtain ΔΔCT values. The relative quantification (RQ) value was calculated as 2 −ΔΔCT , which was then log2-transformed to yield fold changes. RNAscope Four mice per experimental condition were stained for APOE mRNA by RNAscope. RNAscope experiments were performed using the Manual Fluorescent Multiplex kit v2 (Advanced Cell Diagnostics) following manufacturer’s recommendations with minor adjustments. Briefly for each mouse a single paraffin section was baked onto a superfrost slide for use in APOE mRNA quantification. Following deparaffinization, target retrieval and protease digestion, probe hybridization was carried out at 40°C for 2 h with hs-APOE (433091), 3-plex Positive Control Probe_Mm (320881) and Negative Control Probe- DapB (310043). After amplification steps to obtain the RNAscope signals, the signal was developed using TSA-cy3 (Perkin Elmer FP1170). We then immediately performed immunohistochemistry. Sections were permeabilized in 0.5% Triton-X for 15 min before being blocked in 0.1% Triton-X and 5% normal goat serum for 1 h at room temperature. Primary antibodies GFAP (Millipore MAB 3402) was diluted 1:1000 in 0.05% and 2.5% normal goat serum overnight at 4°C. Secondary was goat anti-mouse 488 (Thermo-Fisher A11001) diluted 1:500 in 0.05% and 2.5% normal goat serum at room temperature for 1 h. Sections were then mounted using Vectashield Antifade mounting medium with DAPI (ZG0729) cover-slipped and imaged on an Olympus FV3000 confocal laser scanning microscope.
Electron microscopy
Tissue slices were left in electron microscopy fix until ready to process. Tissue sections were then rinsed in PBS and secondarily fixed in 1% osmium tetroxide in 0.1 M sodium cacodylate overnight at room temperature. Sections were then rinsed in 0.1 M sodium cacodylate before being dehydrated through ascending concentrations of ethanol. Sections were then incubated with propylene oxide before being embedded and baked for 48 h in Poly/Bed® 812 at 60°C. Tissue was then sectioned on an Ultracut microtrome and post-stained with 2% uranyl acetate and lead citrate. Sections were then examined using a Philips 208S electron microscope (Philips), with images collected at ×5000, ×20 000 and ×50 000 magnification.
Western blots
Mouse cortical tissue was homogenized in 10 volumes by weight of ice-cold TBS with protease and phosphatase inhibitors using a hand-held electric homogenizer. The homogenate was then spun at 10 000 g for 10 min and the supernatant (TBS-soluble fraction) was collected for western blot. Protein concentration was determined using a BCA assay. Total protein (5–10 μg) was loaded and separated by 4–12% NuPAGE gels in MES buffer, proteins were then separated by weight for 2 h at 120 V. Proteins were electrotransferred onto nitrocellulose membrane at 30 V for 1.5 h using the XCell II™ Blot Module system in tris-glycine transfer buffer. Membranes were incubated in blocking buffer (Li-Cor Biosciences) diluted 1:1 TBS for 1 h to reduce background staining. Membranes were then incubated with primary antibodies; rb anti-ApoE (Novus biologicals, NBP1-31123), rb anti-MMP9 (abcam ab38898), ms anti-GAPDH (Millipore MAB374), ms anti-Tubulin (Abcam ab7291) diluted in blocking buffer with added 0.1% Tween-20 overnight at room temperature while shaking. Membranes were then washed and incubated with the appropriate 680 and 800 IR dye secondary antibodies (Li-Cor Biosciences). The membranes were imaged using Odyssey infrared imaging system, and analysed using Odyssey software.
Statistical analyses
Statistical analyses were performed using GraphPad Prism 9. Data are most often presented as mean ± standard error of the mean (SEM), where one dot is representative of one mouse. If multiple measurements were taken for an individual mouse at a single time point, as in the case of the leakage experiments or the electron microcsopy, all measurements per mouse were averaged together and then mice were compared using an ANOVA with post hoc Tukey's multiple comparisons test. The exception to this is Fig. 4C where all tight junction measured were compared to show the increased spread in APOE4 animals. Simple linear regression analysis was used to assess intensity over time and the correlation between gene expression.
Data availability
The data that support the findings of this study are available from the corresponding author, upon reasonable request.
Supplementary Material awab478_Supplementary_Data Click here for additional data file.
Supplementary material Supplementary material is available at Brain online.
📊 Figures
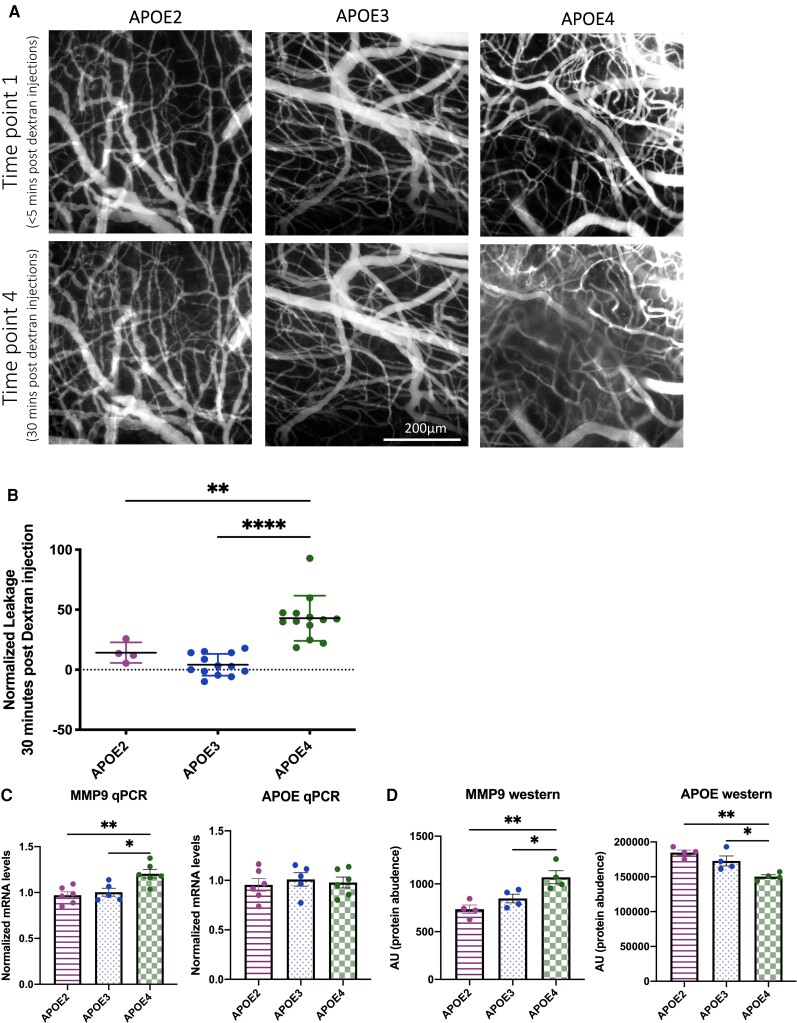
Figure 1
ApoE4-TR mice have an impaired BBB compared with ApoE3-TR and ApoE2-TR mice. ( A ) Multiphoton microscopy of 40u2005kDa fluorescein conjugated dextran in 9-month-old TR- APOE2 , TR- APOE3 and TR- APOE...
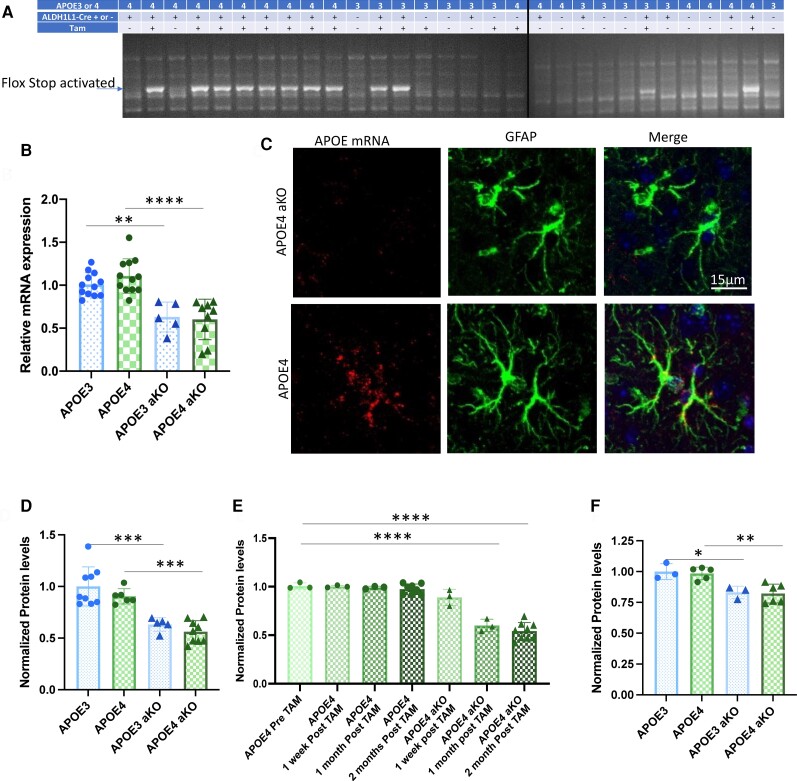
Figure 2
Tamoxifen injection induces a lasting knockout of APOE from astrocytes specifically. ( A ) PCR of the flox stop site indicates that CRE recombination has occurred in animals that have the ALDH1L1 CRE ...
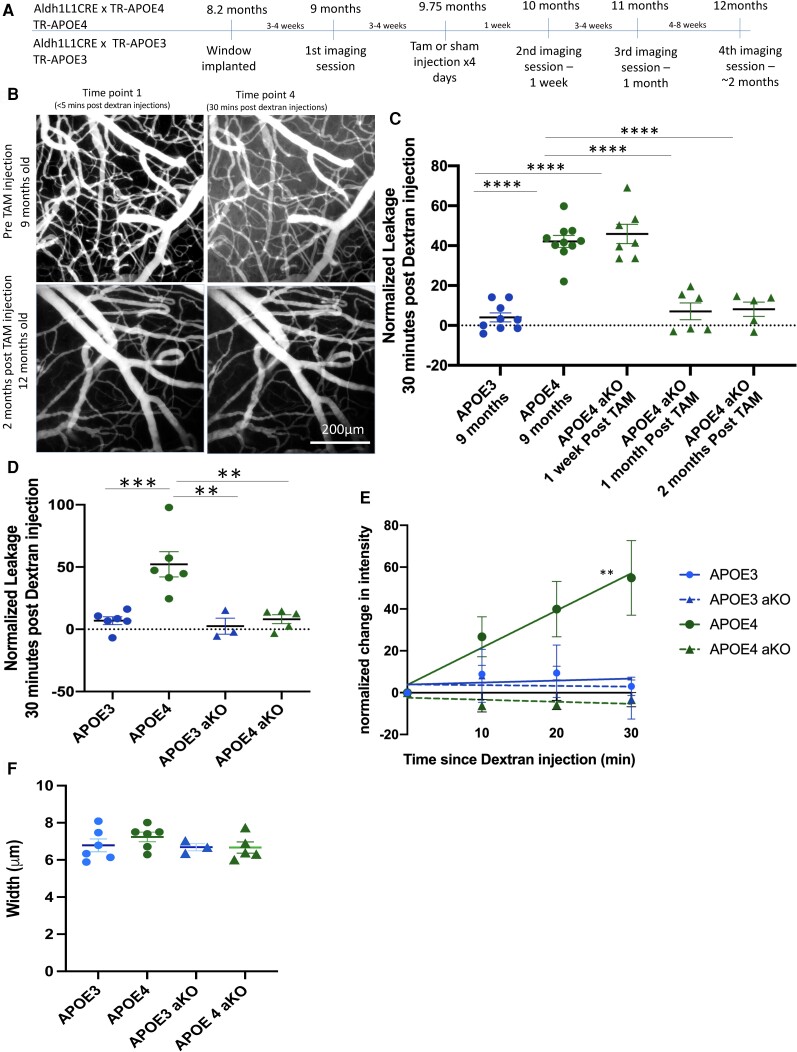
Figure 3
Astrocyte-specific knockout of APOE4 rescues BBB impairments. ( A ) Timeline of in vivo studies. ( B ) Multiphoton microscopy or 40u2005kDa fluorescein conjugated dextran in ALDH1L1CRE u00d7 TR- APOE4...
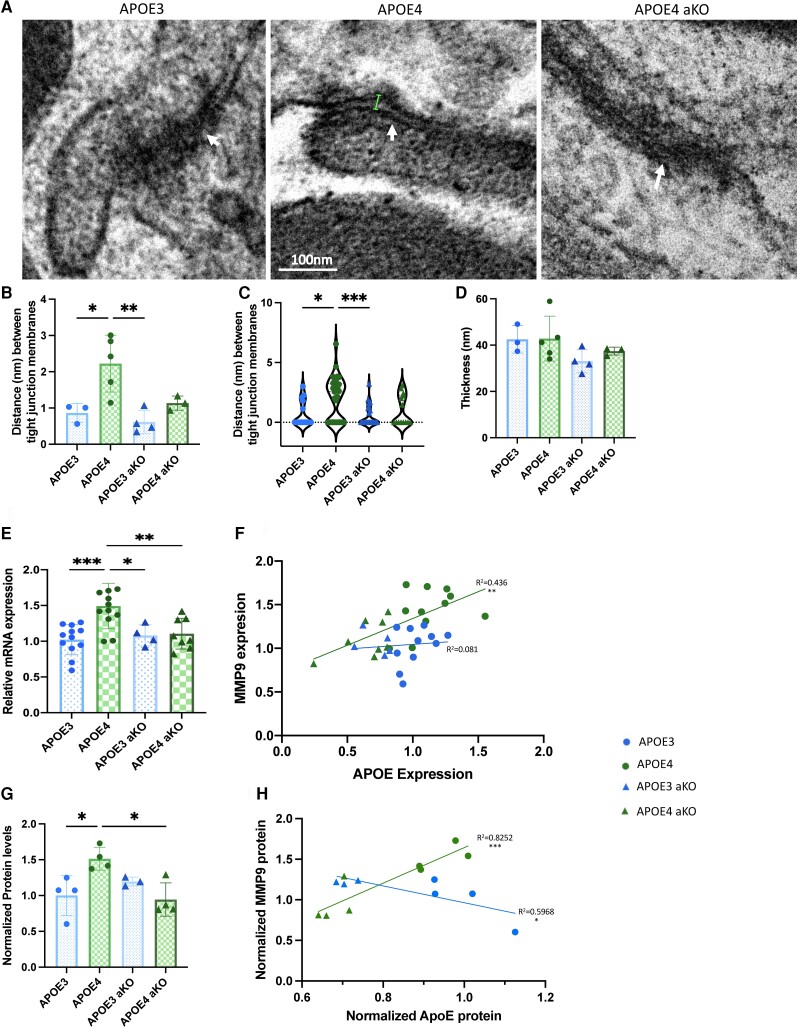
Figure 4
Tight junctions are impaired in ApoE4 mice along with MMP9 expression. ( A and B ) Electron microscopy analysis shows that APOE4 mice show an increased distance (as indicated by a small line) between ...
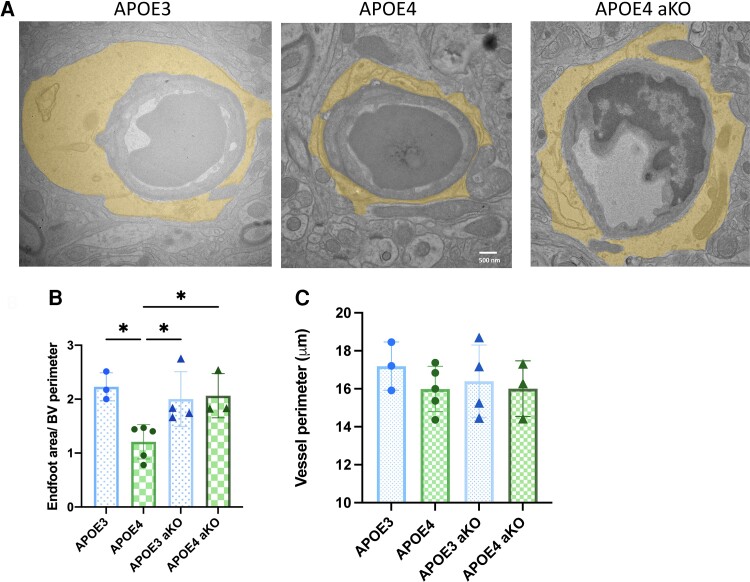
Figure 5
Astrocyte end-feet are impaired in APOE4 mice. ( A ) Analysis by electron microscopy shows that there is a decreased coverage of astrocytic end-feet (in yellow) in APOE4 mice when compared with APOE3 ...
Figure images are served from the NIH/NLM PubMed Central Open Access Subset or Europe PMC; copyright remains with the publishers and authors.
💬 Discussion
0 commentsNo comments yet. Be the first to start a discussion!
Leave a Comment