Abstract
The majority of biotechnologically relevant metabolites do not impart a conspicuous phenotype to the producing cell. Consequently, the analysis of microbial metabolite production is still dominated by bulk techniques, which may obscure significant variation at the single-cell level. In this study, we have applied the recently developed Lrp-biosensor for monitoring of amino acid production in single cells of gradually engineered L-valine producing Corynebacterium glutamicum strains based on the pyruvate dehydrogenase complex-deficient (PDHC) strain C. glutamicum ΔaceE. Online monitoring of the sensor output (eYFP fluorescence) during batch cultivation proved the sensor's suitability for visualizing different production levels. In the following, we conducted live cell imaging studies on C. glutamicum sensor strains using microfluidic chip devices. As expected, the sensor output was higher in microcolonies of high-yield producers in comparison to the basic strain C. glutamicum ΔaceE. Microfluidic cultivation in minimal medium revealed a typical Gaussian distribution of single cell fluorescence during the production phase. Remarkably, low amounts of complex nutrients completely changed the observed phenotypic pattern of all strains, resulting in a phenotypic split of the population. Whereas some cells stopped growing and initiated L-valine production, others continued to grow or showed a delayed transition to production. Depending on the cultivation conditions, a considerable fraction of non-fluorescent cells was observed, suggesting a loss of metabolic activity. These studies demonstrate that genetically encoded biosensors are a valuable tool for monitoring single cell productivity and to study the phenotypic pattern of microbial production strains.
🔬 Techniques
🧬 Organisms
💻 Software
✨ Fluorophores
🧪 Sample Preparation
🔬 Cell Lines
🏭 Microscope Brands
🧪 Reagent Suppliers
📷 Detectors
🎨 Filters
💻 Software Details
🏛️ Research Organizations (ROR)
Affiliated research institutions:
📋 Methods
Bacterial strains, media, and growth conditions Bacterial strains and plasmids used or constructed in this work are listed in Table 1 . Unless stated otherwise, pre-cultures of C. glutamicum were inoculated with single colonies from a fresh brain heart infusion (BHI) agar plate containing 51 mM acetate and incubated in 4 ml BHI complex medium with 51 mM acetate for 6 h at 30°C and 170 rpm. This first pre-culture was used to inoculate a 100 ml shake flask containing 20 ml CGXII minimal medium [29] with 222 mM glucose and 154 mM acetate. The cells of the second pre-culture were cultivated overnight at 30°C and 120 rpm, washed twice with 0.9% (w/v) saline and then used to inoculate the main culture to an optical density (OD 600 ) of 1. If not stated differently, cells in the main culture were cultivated under the same conditions as in the pre-culture. Potassium acetate was used in all experiments performed in this study. Escherichia coli DH5α was grown aerobically in LB medium on a rotary shaker (120 rpm) or on LB agar plates at 37°C [30] . Where appropriate, the media contained kanamycin (25 µg ml −1 for C. glutamicum or 50 µg ml −1 for E. coli DH5α) or isopropyl β- D -1-thiogalactopyranoside (IPTG), as indicated. For online monitoring of growth and fluorescence, cells were cultivated in 48-well flowerplates using the BioLector system (m2p-labs GmbH, Aachen, Germany) [31] . Cultivation conditions have been described previously [22] . 10.1371/journal.pone.0085731.t001 Table 1 Bacterial strains, plasmids, and oligonucleotides used in this study. Strains, plasmids Relevant characteristics Reference Strains E. coli DH5α supE44, ΔlacU169 ( φ 80 lacZ DM15), hsdR17, recA1, endA1, gyrA96,thi1,relA1 . Invitrogen C. glutamicum ATCC13032 Biotin-auxotrophic wild type. [48] ΔaceE C. glutamicum wild type with deletion of the aceE gene, coding for the E1p subunit of the pyruvate dehydrogenase-complex (PDHC). [49] Δ aceE Δ pqo C. glutamicum Δ aceE strain with deletion of the pqo gene, coding for pyruvate:quinone oxidoreductase. [50] Δ aceE Δ pqo Δ pgi C. glutamicum Δ aceE Δ pqo strain with deletion of the pgi gene, coding for the phosphoglucose isomerase. [28] ΔaceE Δ pqo Δ pgi Δ pyc C. glutamicum Δ aceE Δ pqo Δ pgi strain with deletion of the pyc gene, coding for the pyruvate carboxylase. [28] C. glutamicum sensor strain C. glutamicum wild type strain with chromosomally integrated Lrp-sensor (integrated into the intergenic region of cg1121-cg1122) and pJC4-ilvBNCE-crimson plasmid. This work. ΔaceE sensor strain ΔaceE strain with chromosomally integrated Lrp-sensor (cg1121-cg1122) and pJC4-ilvBNCE-crimson plasmid. This work. ΔaceE Δ pqo sensor strain ΔaceE Δ pqo strain with chromosomally integrated Lrp-sensor (cg1121-cg1122) and pJC4-ilvBNCE-crimson plasmid. This work. ΔaceE Δ pqo Δ pgi sensor strain ΔaceE Δ pqo Δ pgi strain chromosomally integrated Lrp-sensor (cg1121-cg1122) and pJC4-ilvBNCE-crimson plasmid. This work. ΔaceE Δ pqo Δ pgi Δ pyc sensor strain ΔaceE Δ pqo Δ pgi Δ pyc strain with chromosomally integrated Lrp-sensor (cg1121-cg1122) and pJC4-ilvBNCE-crimson plasmid. This work. Plasmids pJC1 E. coli-C. glutamicum shuttle vector, Kan R , oriV Ec , oriV Cg . [51] pJC1-lrp-brnF'-eyfp pJC1derivative containing Lrp-sensor cassette, which consists of lrp (cg0313), the intergenic region of lrp brnF (cg0314) and a transcriptional fusion of brnF with eyfp . [22] pJC4-ilvBNCE pJC1derivative carrying the ilvBNCE genes coding for the L-valine biosynthetic enzymes acetohydroxyacid synthase, isomeroreductase, and transaminase B. [25] pJC4-ilvBNCE-crimson pJC4-ilvBNCE derivative containing e2-crimson under transcriptional control of P tac . This work. pK18-mobsacB Vector for allelic exchange in C. glutamicum ; Kan R ; oriV Ec , sacB, lacZα . [52] pK18-mobsacB-cg1121, cg1122-Lrp-sensor pK18mobsacB derivative for genomic integration of the Lrp-sensor in the intergenic region of cg1121-cg1122 in C. glutamicum . This work. Oligonucleotides Sequence (5′ → 3′) lacI-fw TCAAGCCTTCGTCACTGGTCC This work. E2-Crimson-rv CTACTGGAACAGGTGGTGGCG This work. Int-cg1121-fw TTGGCGTGTGGTTGGTTAG This work. Int-cg1122-rv CGCATCAAGCAGATCTCTG This work. Recombinant DNA work Standard methods like PCR, DNA restriction or ligation were carried out according to standard protocols [30] . Synthesis of oligonucleotides and sequencing analysis were performed by Eurofins MWG Operon (Ebersfeld, Germany). The vector pE2-Crimson was derived by Clontech Laboratories (Mountain View, CA, USA). For the construction of pJC4-ilvBNCE-crimson, e2-crimson under transcriptional control of P tac was amplified using oligonucleotides lacI-fw and E2-Crimson-rv [32] . The PCR product was cloned into the vector pJC4-ilvBNCE [25] using the Bst1107I restriction site. For chromosomal integration of the Lrp-sensor, the sensor cassette was inserted into the intergenic region of cg1121-cg1122 using pK18-mobsacB-cg1121, cg1122 [22] . The transfer of the integration plasmid into C. glutamicum and selection of the first and second recombination events were performed as described previously [33] . Correct integration at the chromosomal locus was verified by colony PCR using primers Int-cg1121-fw and Int-cg1122-rv.
Show full methods section
Bacterial strains, media, and growth conditions Bacterial strains and plasmids used or constructed in this work are listed in Table 1 . Unless stated otherwise, pre-cultures of C. glutamicum were inoculated with single colonies from a fresh brain heart infusion (BHI) agar plate containing 51 mM acetate and incubated in 4 ml BHI complex medium with 51 mM acetate for 6 h at 30°C and 170 rpm. This first pre-culture was used to inoculate a 100 ml shake flask containing 20 ml CGXII minimal medium [29] with 222 mM glucose and 154 mM acetate. The cells of the second pre-culture were cultivated overnight at 30°C and 120 rpm, washed twice with 0.9% (w/v) saline and then used to inoculate the main culture to an optical density (OD 600 ) of 1. If not stated differently, cells in the main culture were cultivated under the same conditions as in the pre-culture. Potassium acetate was used in all experiments performed in this study. Escherichia coli DH5α was grown aerobically in LB medium on a rotary shaker (120 rpm) or on LB agar plates at 37°C [30] . Where appropriate, the media contained kanamycin (25 µg ml −1 for C. glutamicum or 50 µg ml −1 for E. coli DH5α) or isopropyl β- D -1-thiogalactopyranoside (IPTG), as indicated. For online monitoring of growth and fluorescence, cells were cultivated in 48-well flowerplates using the BioLector system (m2p-labs GmbH, Aachen, Germany) [31] . Cultivation conditions have been described previously [22] . 10.1371/journal.pone.0085731.t001 Table 1 Bacterial strains, plasmids, and oligonucleotides used in this study. Strains, plasmids Relevant characteristics Reference Strains E. coli DH5α supE44, ΔlacU169 ( φ 80 lacZ DM15), hsdR17, recA1, endA1, gyrA96,thi1,relA1 . Invitrogen C. glutamicum ATCC13032 Biotin-auxotrophic wild type. [48] ΔaceE C. glutamicum wild type with deletion of the aceE gene, coding for the E1p subunit of the pyruvate dehydrogenase-complex (PDHC). [49] Δ aceE Δ pqo C. glutamicum Δ aceE strain with deletion of the pqo gene, coding for pyruvate:quinone oxidoreductase. [50] Δ aceE Δ pqo Δ pgi C. glutamicum Δ aceE Δ pqo strain with deletion of the pgi gene, coding for the phosphoglucose isomerase. [28] ΔaceE Δ pqo Δ pgi Δ pyc C. glutamicum Δ aceE Δ pqo Δ pgi strain with deletion of the pyc gene, coding for the pyruvate carboxylase. [28] C. glutamicum sensor strain C. glutamicum wild type strain with chromosomally integrated Lrp-sensor (integrated into the intergenic region of cg1121-cg1122) and pJC4-ilvBNCE-crimson plasmid. This work. ΔaceE sensor strain ΔaceE strain with chromosomally integrated Lrp-sensor (cg1121-cg1122) and pJC4-ilvBNCE-crimson plasmid. This work. ΔaceE Δ pqo sensor strain ΔaceE Δ pqo strain with chromosomally integrated Lrp-sensor (cg1121-cg1122) and pJC4-ilvBNCE-crimson plasmid. This work. ΔaceE Δ pqo Δ pgi sensor strain ΔaceE Δ pqo Δ pgi strain chromosomally integrated Lrp-sensor (cg1121-cg1122) and pJC4-ilvBNCE-crimson plasmid. This work. ΔaceE Δ pqo Δ pgi Δ pyc sensor strain ΔaceE Δ pqo Δ pgi Δ pyc strain with chromosomally integrated Lrp-sensor (cg1121-cg1122) and pJC4-ilvBNCE-crimson plasmid. This work. Plasmids pJC1 E. coli-C. glutamicum shuttle vector, Kan R , oriV Ec , oriV Cg . [51] pJC1-lrp-brnF'-eyfp pJC1derivative containing Lrp-sensor cassette, which consists of lrp (cg0313), the intergenic region of lrp brnF (cg0314) and a transcriptional fusion of brnF with eyfp . [22] pJC4-ilvBNCE pJC1derivative carrying the ilvBNCE genes coding for the L-valine biosynthetic enzymes acetohydroxyacid synthase, isomeroreductase, and transaminase B. [25] pJC4-ilvBNCE-crimson pJC4-ilvBNCE derivative containing e2-crimson under transcriptional control of P tac . This work. pK18-mobsacB Vector for allelic exchange in C. glutamicum ; Kan R ; oriV Ec , sacB, lacZα . [52] pK18-mobsacB-cg1121, cg1122-Lrp-sensor pK18mobsacB derivative for genomic integration of the Lrp-sensor in the intergenic region of cg1121-cg1122 in C. glutamicum . This work. Oligonucleotides Sequence (5′ → 3′) lacI-fw TCAAGCCTTCGTCACTGGTCC This work. E2-Crimson-rv CTACTGGAACAGGTGGTGGCG This work. Int-cg1121-fw TTGGCGTGTGGTTGGTTAG This work. Int-cg1122-rv CGCATCAAGCAGATCTCTG This work. Recombinant DNA work Standard methods like PCR, DNA restriction or ligation were carried out according to standard protocols [30] . Synthesis of oligonucleotides and sequencing analysis were performed by Eurofins MWG Operon (Ebersfeld, Germany). The vector pE2-Crimson was derived by Clontech Laboratories (Mountain View, CA, USA). For the construction of pJC4-ilvBNCE-crimson, e2-crimson under transcriptional control of P tac was amplified using oligonucleotides lacI-fw and E2-Crimson-rv [32] . The PCR product was cloned into the vector pJC4-ilvBNCE [25] using the Bst1107I restriction site. For chromosomal integration of the Lrp-sensor, the sensor cassette was inserted into the intergenic region of cg1121-cg1122 using pK18-mobsacB-cg1121, cg1122 [22] . The transfer of the integration plasmid into C. glutamicum and selection of the first and second recombination events were performed as described previously [33] . Correct integration at the chromosomal locus was verified by colony PCR using primers Int-cg1121-fw and Int-cg1122-rv.
Quantification of amino acids
For determination of amino acid concentrations in the supernatant, samples of the cultures were centrifuged (13,000 rpm, 10 min, 4°C) and amino acid concentration was quantified by reversed-phase high-pressure liquid chromatography as described before [22] . Microfluidic chip cultivation Microfluidic PDMS-glass chips were fabricated according to [14] , [34] . The microfluidic monolayer cultivation system utilized in the present study was designed for microcolony growth and growth-coupled phenotypic studies at the single-cell level [14] , [35] . The device features 100 arrays of monolayer cultivation chambers (1 µm×40 µm×40 µm; height × width × length) for HT monitoring of microcolony growth under constant environmental conditions. The microfluidic chip connected to 1 ml disposable syringes (Omnifix 40 Duo, B. Braun Melsungen AG, Germany) for continuous media supply was placed inside an in-house manufactured incubator for temperature and atmosphere control. Media flow was controlled with syringe pumps (neMESYS, Cetoni GmbH, Korbussen, Germany). The incubator was mounted onto a fully motorized inverted Nikon Eclipse Ti microscope (Nikon GmbH, Düsseldorf, Germany) suitable for time-lapse live cell imaging. The setup was equipped with a focus assistant (Nikon PFS) compensating for thermal drift during long-term microscopy and a CFI Plan Apo Lambda DM 100X-magnification, 1.45 numeric aperture oil phase contrast objective. Temperature control of the objective was realized using an objective heater (ALA OBJ-Heater, Ala Scientific Instruments, USA). A cell suspension of OD 600 0.5-1, transferred from a pre-culture at exponential growth phase, was infused to the system. After successful cell seeding, the growth medium was infused at approximately 100 nl min −1 per channel.
Live cell imaging and image analysis
The microscope was equipped with an ANDOR LUCA R DL604 EMCCD camera (Andor Technology plc., Belfast, UK) for image recording and a 300 W Xenon light source for fluorescence excitation (Lambda DG4, Sutter Instruments, USA). Following fluorescence filters (AHF Analysentechnik, Germany) were applied: i) YFP: HQ 500/20 (excitation filter), Q515 (dichroic), and HQ 535/30 (emission); ii) E2-Crimson: HQ 600/37 (excitation filter), Q630 (dichroic) and Q675/67 (emission). Phase contrast and fluorescence microscopy images of several microcolonies were captured in 15 min time intervals. Growth and fluorescence were recorded for 10–20 isogenic microcolonies during each experiment. Image analysis was performed with the Nikon NIS Elements AR software package. The visualization of lineage tree was realized using our in-house developed Python-based software.
Supporting Information File S1 This file ncludes Figures S1, S2 and S3. Figure S1, Phenotypic heterogeneity of the ΔaceE Δpqo Δpgi Δpyc sensor strain upon switch from growth to production phase. (A) Microcolony showing transition to producing cells or (B) a mixture of growing and producing cells after medium switch (initiated after 240 min). In approximately 50% of the recorded colonies one or several single cells continued growth after medium switch. (C, D) Fluorescence histograms depicting single cell fluorescence to selected times during growth (0–240 min) and production phase (0–1200 min) of the microcolonies shown in A (C) and B (D) . Cultivation was performed in CGXII minimal medium containing 154 mM acetate, 222 mM glucose and 0.5% BHI during growth phase or 222 mM glucose and 0.5% BHI during production phase, respectively. Figure S2, Phenotypic heterogeneity of ΔaceE and ΔaceE Δpqo Δpgi upon switch from growth to production phase. (A) Δ aceE microcolonies where all cells stopped growth (blue stars) upon transition to the production phase (upper row) or a mixture of growing (red stars) and non-growing cells (lower row) after initiation of the production phase. In approximately 50% of the recorded colonies one or several single cells continued growth after medium switch (initiated after 250 min). (C) ΔaceE Δpqo Δpgi microcolonies. In the upper row, all cells stopped growth whereas in the lower row a microcolony is shown were some cells continued growth after initiation of the production phase. In approximately 50% of the recorded colonies one or several single cells continued growth after medium switch (initiated after 250 min). These findings confirm that the phenotypic split shown in Figure 5 is not due to the presence of the Lrp-sensor. Cultivation was performed in CGXII minimal medium containing 154 mM acetate, 222 mM glucose and 0.5% BHI during growth phase or 222 mM glucose and 0.5% BHI during production phase, respectively. Figure S3, Single cell traces of the ΔaceE Δpqo Δpgi Δpyc sensor strain upon switch from growth to production phase. (A) Single cell traces showing the switch from growth (cell length = blue line) to production (fluorescence = squares) after several cell divisions during production phase (t = 8.5 h, t = 15.0 h). (B) Single cell traces showing no switch from growth to production. Single cell traces are taken from the cultivation of ΔaceE Δpqo Δpgi Δpyc sensor strain shown in Figure S1. (PDF) Click here for additional data file. Video S1 Growth and production of C. glutamicum ATCC 13032 ΔaceE sensor strain. Upon the switch to the production phase, cells gradually stopped growing and simultaneously exhibited progressively increasing eYFP fluorescence. Growth phase: CGXII medium with 154 mM acetate and 222 mM glucose; production phase: CGXII medium with 222 mM glucose as carbon source. (WMV) Click here for additional data file. Video S2 Growth and production of C. glutamicum ATCC 13032 ΔaceE Δpqo Δpgi sensor strain. Upon the switch to the production phase, cells gradually stopped growing and simultaneously exhibited progressively increasing eYFP fluorescence. Growth phase: CGXII medium with 154 mM acetate and 222 mM glucose; production phase: CGXII medium with 222 mM glucose as carbon source. (WMV) Click here for additional data file. Video S3 Occurrence of non-fluorescent cells during the production phase of the C. glutamicum ATCC 13032 ΔaceE Δpqo Δpgi sensor strain. (WMV) Click here for additional data file. Video S4 Phenotypic heterogeneity of the C. glutamicum ΔaceE sensor strain. Cells were grown in CGXII medium with 154 mM acetate, 222 mM glucose and 0.5% BHI. After a primary growth phase, cells were supplemented with 222 mM glucose and 0.5% BHI to trigger L-valine production. Although most of the cells switched from growth to production ( Figure 5A ), in approximately 50% of the recorded colonies one or several single cells continued growing after the medium change. (WMV) Click here for additional data file. Video S5 Microcolonies of the C. glutamicum ΔaceE Δpqo Δpgi sensor strain displaying phenotypic heterogeneity. Growth of six microcolonies (CGXII medium with 154 mM acetate, 222 mM glucose and 0.5% BHI) is shown in microfluidic chip devices. After a primary growth phase, cells were supplemented with 222 mM glucose and 0.5% BHI to trigger L-valine production. In the upper three colonies all cells showed a switch from growth to production. In the lower three colonies one or several single cells continued growing after initiation of the production phase. (WMV) Click here for additional data file.
📊 Figures
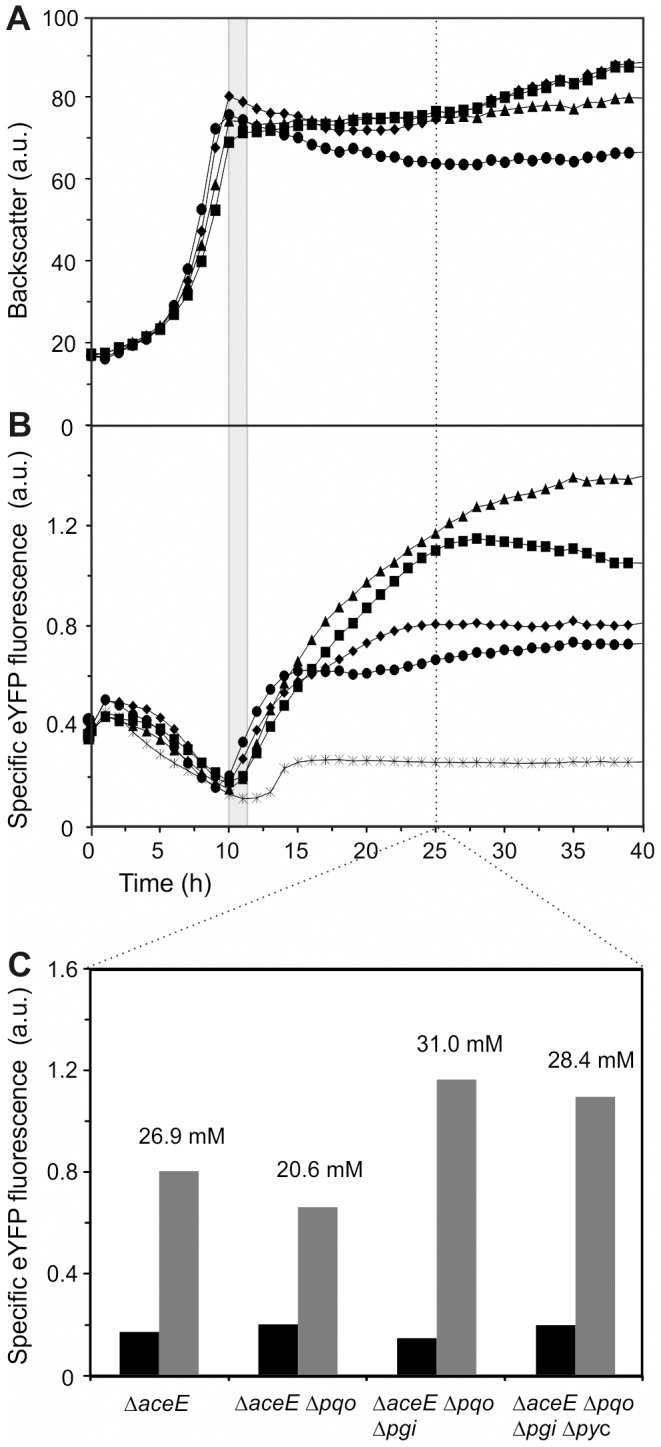
Figure 1
Biosensor-based online monitoring of L-valine production in PDHC-deficient C. glutamicum strains.
( A ) Growth and ( B ) Lrp-sensor output (eYFP fluorescence) of the sensor strains C. glutamicum ATCC 13032 wild type (stars), u0394aceE (diamonds), u0394aceE u0394pqo (circles), u0394aceE u0394pqo u0...
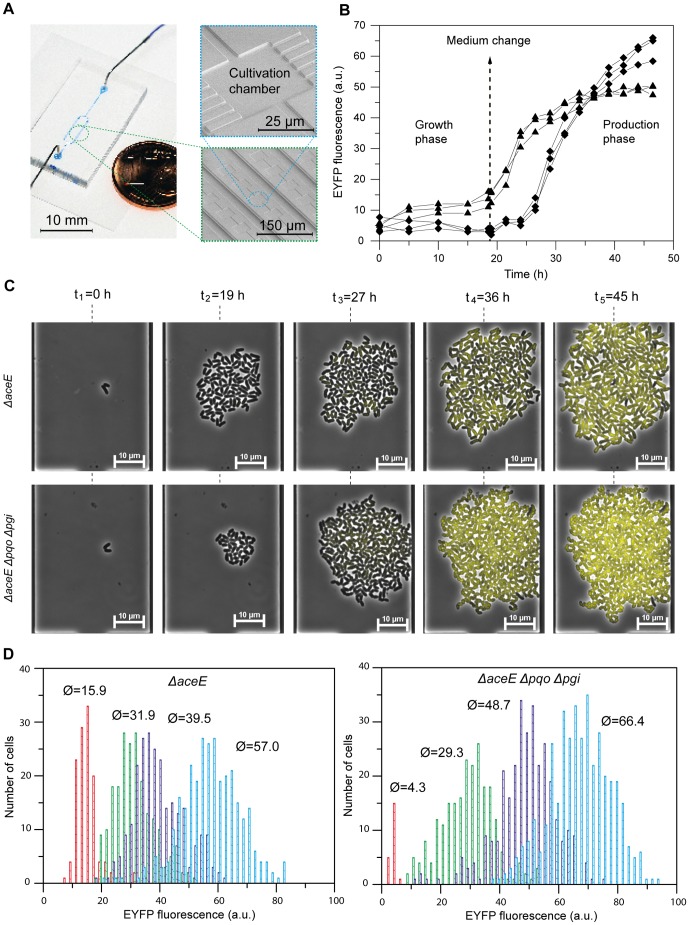
Figure 2
Live cell imaging of L-valine production strains using microfluidic monolayer cultivation chambers
. ( A ) Illustration of the microfluidic cultivation chambers. The system consists of several arrays of picoliter sized monolayer cultivation chambers. ( B ) Fluorescence emission of three entire micr...
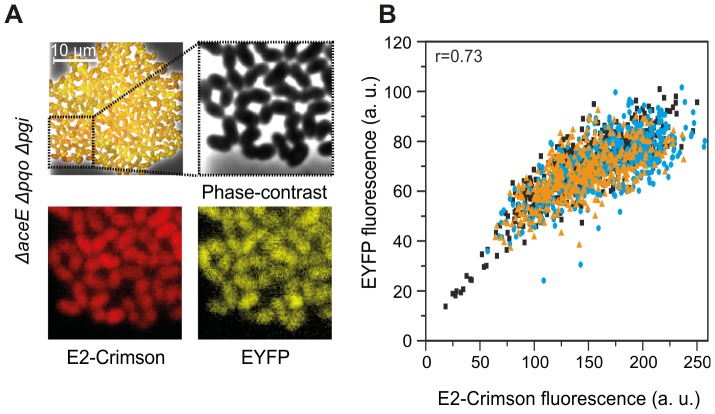
Figure 3
Correlation of the Lrp-sensor output (eYFP) and the plasmid marker E2-Crimson.
( A ) Microscopy overlay plot of phase-contrast, eYFP and E2-Crimson signal of an isogenic microcolony of the u0394ace E u0394pqo u0394pgi sensor strain after 46 h (see Figure 2C ). ( B ) Dot plot dis...
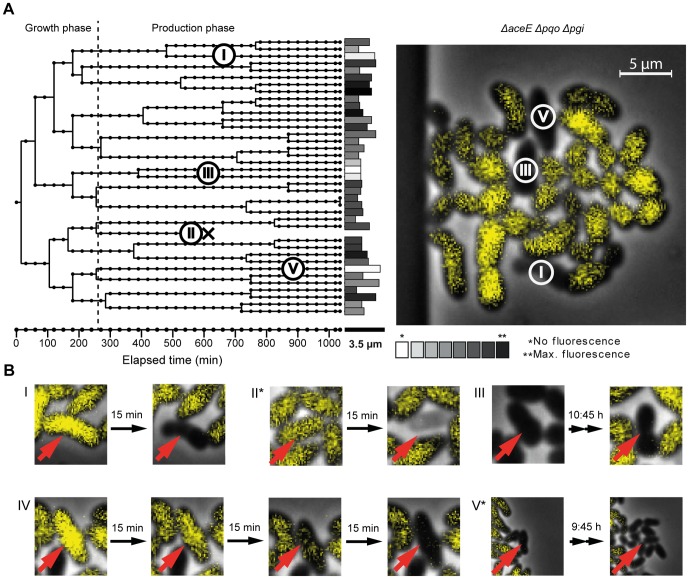
Figure 4
Occurrence of non-fluorescent cells during the production phase.
( A ) Microcolony and lineage tree of the u0394aceE u0394pqo u0394pgi sensor strain. Different types of non-fluorescent cells are illustrated in B. ( B ) (I+II) Lysing cells and (III) dormant/or dead ...
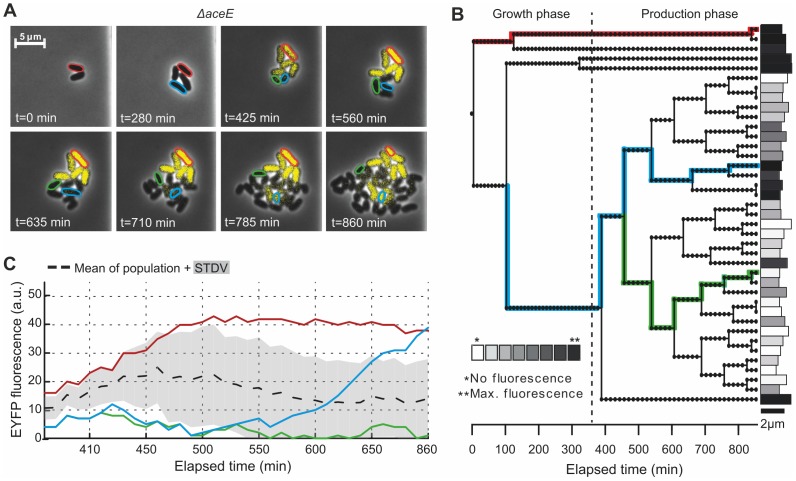
Figure 5
Biosensor-driven analysis of phenotypic heterogeneity.
In the presence of low amounts of complex carbon sources, significant cell-to-cell variability in the switch from growth to L-valine production was observed. ( A ) Growth and production phase (initiat...
Figure images are served from the NIH/NLM PubMed Central Open Access Subset or Europe PMC; copyright remains with the publishers and authors.
💬 Discussion
0 commentsNo comments yet. Be the first to start a discussion!
Leave a Comment