Abstract
Brazilian green propolis is a popular health supplement because of its various biological properties. The ethanol extract of Brazilian green propolis (EEBP) is characteristic for its herb-like smell and unique pungent taste. However, the ingredients responsible for its pungency have not yet been identified. This study provides the first evidence that artepillin C is the main pungent ingredient in EEBP and that it potently activates human transient receptor potential ankyrin 1 (TRPA1) channels. EEBP was fractionated using column chromatography with a step gradient elution of an ethanol-water solution, and the fractions having the pungent taste were determined by sensory tests. HPLC analysis revealed that the pungent fraction was composed primarily of artepillin C, a prenylated derivative of cinnamic acid. Artepillin C was also identified as the pungent compound of EEBP by organoleptic examiners. Furthermore, the effects of artepillin C and other cinnamic acids found in EEBP on TRPA1 channels were examined by calcium imaging and plate reader-based assays in human TRPA1-expressing cells to investigate the molecular mechanisms underlying their pungent tastes. Artepillin C and baccharin activated the TRPA1 channel strongly, whereas drupanin caused a slight activation and p-coumaric acid showed no activation. Because the EC(50) values of artepillin C, baccharin, and allyl isothiocyanate were 1.8 µM, 15.5 µM, and 6.2 µM, respectively, artepillin C was more potent than the typical TRPA1 agonist allyl isothiocyanate. These findings strongly indicate that artepillin C is the main pungent ingredient in EEBP and stimulates a pungent taste by activating TRPA1 channels.
🔬 Techniques
🧪 Sample Preparation
🔬 Cell Lines
🏭 Microscope Brands
🧪 Reagent Suppliers
📷 Detectors
🏛️ Research Organizations (ROR)
Affiliated research institutions:
📋 Methods
Materials and Chemicals We used Brazilian green propolis produced in the state of Minas Gerais. The main plant source is B. dracunculifolia DC [14] , [15] , [16] . A lump of propolis was crushed, soaked in 95% ethanol and stirred for 24 h at room temperature; the propolis grounds were then filtered out. The filtrate was stored at −20°C for more than 24 hours, and the insoluble matter was removed by filtration. The ethanol-extracted solution was prepared by adjusting its solid content to 55% (w/w); this mixture was designated as EEP-B55 (API Co., Ltd., Gifu, Japan). Artepillin C (3,5-diprenyl-4-hydroxycinnamic acid) was extracted from EEP-B55 and purified in our laboratory. Baccharin [( E )-3-prenyl-4-(2,3-dihydrocinnamoyloxy) cinnamic acid] was synthesized by Konan Chemical Industry Co., Ltd. (Osaka, Japan). Drupanin [( E )-3-prenyl-4-hydroxycinnnamic acid] was synthesized by Dr. Uto (Tokushima University, Japan). p -Coumaric acid and allyl isothiocyanate (AITC) were purchased from Tokyo Chemical Industry Co., Ltd. (Tokyo, Japan). HC-030031 was purchased from Sigma Aldrich (St. Louis, MO, USA). Capsaicin (purity >60%) was purchased from Wako Pure Chemical Industries, Ltd. (Osaka, Japan). Capsazepine was purchased from Biomol International (Plymouth Meeting, PA, USA). Fractionation Ten grams of EEP-B55 was applied to a Chromatorex ODS DM1020T (Fuji Silysia Chemical Co., Ltd., Aichi, Japan) column (Φ50 mm×250 mm) and eluted with a step gradient of ethanol-water solutions (30, 40, 50, 60, 70, 80, 90, and 100% (v/v)). Each fraction was dried and reconstituted with 5 ml of ethanol for pungency tasting. The pungent fraction was further purified by repeated chromatography with the same ODS column (Φ32 mm×250 mm) and a step gradient elution of ethanol-water solutions (50 and 60% (v/v)). The composition of the test fractions was subsequently analyzed using high-performance liquid chromatography (HPLC).
Show full methods section
Materials and Chemicals We used Brazilian green propolis produced in the state of Minas Gerais. The main plant source is B. dracunculifolia DC [14] , [15] , [16] . A lump of propolis was crushed, soaked in 95% ethanol and stirred for 24 h at room temperature; the propolis grounds were then filtered out. The filtrate was stored at −20°C for more than 24 hours, and the insoluble matter was removed by filtration. The ethanol-extracted solution was prepared by adjusting its solid content to 55% (w/w); this mixture was designated as EEP-B55 (API Co., Ltd., Gifu, Japan). Artepillin C (3,5-diprenyl-4-hydroxycinnamic acid) was extracted from EEP-B55 and purified in our laboratory. Baccharin [( E )-3-prenyl-4-(2,3-dihydrocinnamoyloxy) cinnamic acid] was synthesized by Konan Chemical Industry Co., Ltd. (Osaka, Japan). Drupanin [( E )-3-prenyl-4-hydroxycinnnamic acid] was synthesized by Dr. Uto (Tokushima University, Japan). p -Coumaric acid and allyl isothiocyanate (AITC) were purchased from Tokyo Chemical Industry Co., Ltd. (Tokyo, Japan). HC-030031 was purchased from Sigma Aldrich (St. Louis, MO, USA). Capsaicin (purity >60%) was purchased from Wako Pure Chemical Industries, Ltd. (Osaka, Japan). Capsazepine was purchased from Biomol International (Plymouth Meeting, PA, USA). Fractionation Ten grams of EEP-B55 was applied to a Chromatorex ODS DM1020T (Fuji Silysia Chemical Co., Ltd., Aichi, Japan) column (Φ50 mm×250 mm) and eluted with a step gradient of ethanol-water solutions (30, 40, 50, 60, 70, 80, 90, and 100% (v/v)). Each fraction was dried and reconstituted with 5 ml of ethanol for pungency tasting. The pungent fraction was further purified by repeated chromatography with the same ODS column (Φ32 mm×250 mm) and a step gradient elution of ethanol-water solutions (50 and 60% (v/v)). The composition of the test fractions was subsequently analyzed using high-performance liquid chromatography (HPLC).
HPLC Analysis
The solid contents of the test fractions were measured after vacuum drying, and the final solid concentration was adjusted to 2 mg/ml with methanol. These samples were subjected to HPLC analysis using the Prominence high-performance liquid chromatograph system (Shimadzu, Kyoto, Japan) with UV absorbance detection at 280 nm. The chromatography was performed at 40°C using a Shim-Pak CLC-ODS column (6.0 mm ID×150 mm L; Shimadzu, Kyoto, Japan) and gradient elution mode under the following conditions: solvent A was HPLC-grade water containing 2% acetic acid, and solvent B was acetonitrile containing 2% acetic acid; the gradient of solvent A and B was 0–100% B for 50 min and 100% B for 10 min, and the flow rate was 1.0 ml/min. Organoleptic Examination An organoleptic examination was performed by seven independent examiners (healthy adults of both sexes whose ages ranged between 20 and 60 years) to determine the pungency threshold of the test compound. The test compound was dissolved in 1 ml of ethanol and diluted to a volume of 50 ml with purified water or a soft drink solution (drink solution). The recipe for the drink solution is as follows: 0.1 g/ml of high-fructose corn syrup (Miekaryo Co., Ltd., Mie, Japan), 0.08 g/ml of isomaltooligosaccharide (B Food Science Co., Ltd., Aichi, Japan), and 0.005 mg/ml of citric acid (Archer Daniel Midland Company, IL, USA). The final concentrations of the test compound were 0.3 mg/ml, 0.225 mg/ml, 0.15 mg/ml, 0.1 mg/ml, 0.075 mg/ml, and 0.03 mg/ml. Using a pipette, each of the test solutions (2.0 ml) was applied to the entire tongue surface of the examiners in ascending order of concentration. The examiners judged the test solutions as “not pungent”, “slightly pungent”, or “obviously pungent”.
Cell Culture and Transfection
The entire coding region for human TRPA1 (NCBI refseq number: NM_007332.2) and human TRPV1 (NCBI refseq number: NG_029716.1) was amplified by PCR using commercially available plasmids (Open Bio Systems), and the products were subcloned into the pcDNA5/FRT vector (Invitrogen, Carlsbad, CA, USA) and pEAK10 vector (Edge Biosystems, Gaithersburg, MD, USA), respectively. The sequences were confirmed with sequencing using an ABI 3130 DNA genetic analyzer (Applied Biosystems, Foster City, CA, USA). The Flp-In system (Invitrogen) was used to construct the hTRPA1-expressing cell line. Flp-In 293 cells (Invitrogen) were cultured at 37°C in Dulbecco’s modified Eagle’s medium (Sigma-Aldrich Japan, Tokyo, Japan) supplemented with 10% fetal bovine serum (Invitrogen). The cell lines were generated according to the manufacturer’s protocol for the Flp-In pcDNA5/FRT Complete system (Invitrogen). In brief, the Flp-In 293 cells were transfected with both the constructed hTRPA1-expressing plasmid and pOG44 (Invitrogen) using Lipofectamine 2000 (Invitrogen). Forty-eight hours after transfection, the hTRPA1 expressing-cells were selected by treatment with 100 µg/ml hygromycin B (Invitrogen) for 2–3 weeks. Antibiotic-resistant cells were selected, cultured, and used for measuring cellular responses to the pungent components. The hTRPV1-expressing cells were prepared by transient transfection. HEK293T cells were cultured at 37°C in Dulbecco’s modified Eagle’s medium supplemented with 10% fetal bovine serum. The cells were seeded in 6-well plates and transiently transfected with the hTRPV1 expression plasmid using the Lipofectamine 2000 reagent. The cellular responses were measured 24–28 hrs after transfection.
Test Solutions for Calcium Imaging Analysis and Plate Reader-based Assay
The test compounds were dissolved in dimethyl sulfoxide and diluted with the assay buffer to the desired concentration. The calcium-containing buffer (assay buffer) included 10 mM 4-(2-hydroxyethyl)-1-piperazeneethanesulfonic acid (HEPES), 130 mM NaCl, 1 mM glucose, 5 mM KCl, 2 mM CaCl 2 , and 1.2 mM MgCl 2 (pH adjusted to 7.4 with NaOH).
Measurement of the Responses of hTRPA1- or hTRPV1-expressing
Cells by Calcium Imaging Analysis
On the day before the analysis, the cells were trypsinized and seeded into 96-well Lumox multiwell black-wall plates (SARSTEDT AG & Co., Nümbrecht, Germany). After 18–26 hrs, the cells were washed with the assay buffer and then loaded with 5 µM Fura 2-AM (Invitrogen) in 100 µl of the assay buffer for 30 min at 27°C. The cells were washed again with the assay buffer and incubated for up to 15 min at room temperature. The cells were stimulated with the test compound by adding 100 µl of the test solution. The intensities of Fura 2-AM fluorescence emissions resulting from the excitation at 340 nm and 380 nm were measured at 510 nm using a computer-controlled filter exchanger (Lambda 10-3; Sutter, San Rafael, CA, USA), a CoolSNAP HQ2 charge-coupled device camera (Photometrics, Tucson, AZ, USA), and an inverted fluorescence microscope (IX-71; Olympus, Tokyo, Japan). The images were recorded at 4-sec intervals and analyzed using MetalFluor software (Molecular Devices, Sunnyvale, CA, USA). The changes in the intracellular calcium ion concentrations were estimated from the changes in the ratio of the fluorescence intensity at the two excitation wavelengths ( F 340 / F 380 ). The TRPA1-specific inhibitor HC-030031 was used to demonstrate channel specificity for hTRPA1 at a concentration of 50 µM, and the hTRPV1 antagonist capsazepine (a synthetic analog of capsaicin) was also used at a concentration of 30 µM. The inhibitor was mixed in the test solution before the experiment. To perform the statistical analysis, 100 cells were randomly selected, and the fluorescent changes of the cells were measured between 2 seconds and 22 seconds after stimulation.
Measurement of the Responses of hTRPA1- or hTRPV1-expressing Cells
Using a Plate Reader-based Assay
The trypsinized cells were seeded at a density of 70,000 cells (for hTRPA1) or 60,000 cells (for hTRPV1) per well into 96-well black-wall CellBIND surface plates (Corning, Corning, NY, USA). After 17–23 hrs, the cells were washed with the assay buffer prior to loading with the calcium indicator dye of the FLIPR Calcium 4 Assay kit (Molecular Devices). The cells were incubated for 45 min at 27°C, and the measurements were obtained using FlexStation 3 (Molecular Devices). The changes in fluorescence (excitation at 485 nm, emission at 525 nm, and cutoff at 515 nm) were monitored at 2-sec intervals for 120 sec. An aliquot of 100 µl of the assay buffer containing the test compound was added 20 sec after beginning the experiment, and scanning was continued for an additional 100 sec. The final concentrations of AITC and artepillin C were 50 µM and 10 µM, respectively; the other compounds were used at 100 µM. Dose-response curves were generated using the same method described above, and each curve set contained 8 data points. For the calculation of the half-maximal effective concentration (EC 50 ) values, plots of the amplitudes versus the concentrations were prepared using Clampfit Version 9.2.0.09 (Molecular Devices). Nonlinear regression of the plot produced the function , where is the ligand concentration and is the Hill coefficient, which was used to calculate the EC 50 values for the ligand-receptor interactions. The response of each well was represented as ΔRFU (delta relative fluorescence unit), which was defined as follows: ΔRFU = (maximum fluorescence value) - (minimum fluorescence value). The responses were averaged from at least three wells receiving the same stimulus.
Statistical Analysis
The data are presented as the mean ± SEM and were assessed for statistical significance using Tukey’s multiple comparison test. The equality of the variances was measured using the Levene’s test with commercial software for statistical analysis (Ekuseru-Toukei 2006, Social Survey Research Information Co., Ltd., Tokyo, Japan). The differences were considered to be significant when the p value was less than 0.05.
Materials and Chemicals We used Brazilian green propolis produced in the state of Minas Gerais. The main plant source is B. dracunculifolia DC [14] , [15] , [16] . A lump of propolis was crushed, soaked in 95% ethanol and stirred for 24 h at room temperature; the propolis grounds were then filtered out. The filtrate was stored at −20°C for more than 24 hours, and the insoluble matter was removed by filtration. The ethanol-extracted solution was prepared by adjusting its solid content to 55% (w/w); this mixture was designated as EEP-B55 (API Co., Ltd., Gifu, Japan). Artepillin C (3,5-diprenyl-4-hydroxycinnamic acid) was extracted from EEP-B55 and purified in our laboratory. Baccharin [( E )-3-prenyl-4-(2,3-dihydrocinnamoyloxy) cinnamic acid] was synthesized by Konan Chemical Industry Co., Ltd. (Osaka, Japan). Drupanin [( E )-3-prenyl-4-hydroxycinnnamic acid] was synthesized by Dr. Uto (Tokushima University, Japan). p -Coumaric acid and allyl isothiocyanate (AITC) were purchased from Tokyo Chemical Industry Co., Ltd. (Tokyo, Japan). HC-030031 was purchased from Sigma Aldrich (St. Louis, MO, USA). Capsaicin (purity >60%) was purchased from Wako Pure Chemical Industries, Ltd. (Osaka, Japan). Capsazepine was purchased from Biomol International (Plymouth Meeting, PA, USA).
📊 Figures
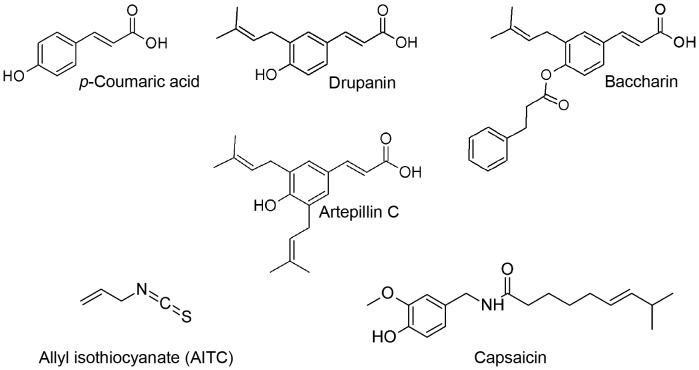
Figure 1
Chemical structures of p -coumaric acid, drupanin, artepillin C, baccharin, allyl isothiocyanate (AITC), and capsaicin.
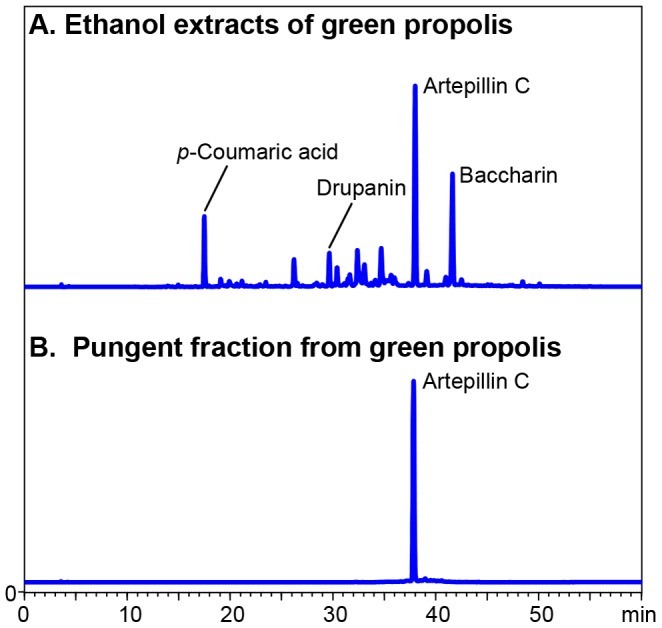
Figure 2
HPLC chromatograms of the EEBP and the fraction containing the pungent ingredient.
(A) The following major compounds were identified in the ethanol extract of Brazilian green propolis (EEBP) : p -coumaric acid, drupanin, artepillin C, and baccharin. (B) One peak was found at the sam...
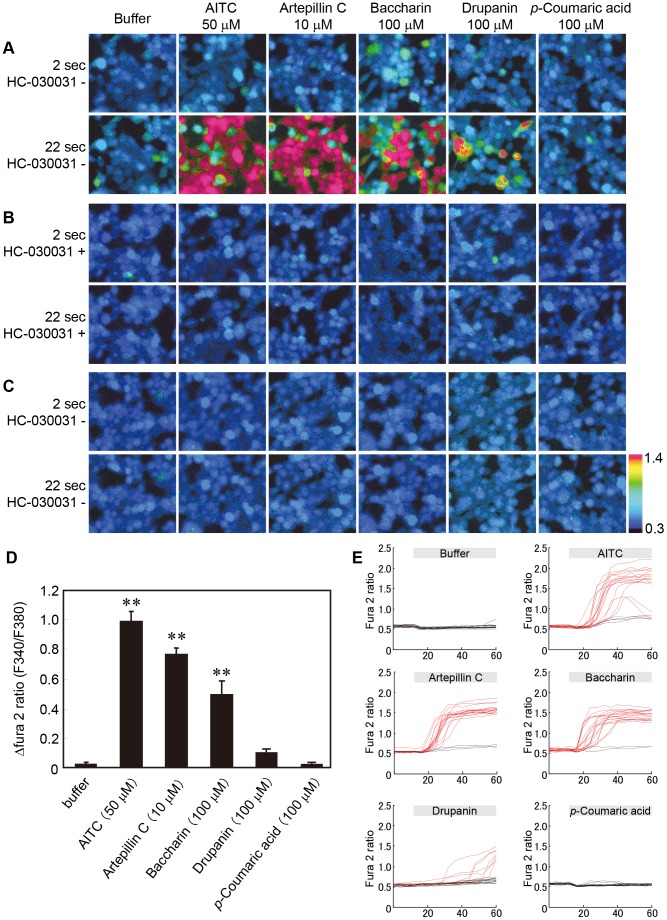
Figure 3
The responses of human TRPA1-expressing cells to the application of the compounds in EEBP.
(Au2013C) The compounds identified in the HPLC chromatogram were applied to hTRPA1-expressing (A and B) and Flp-In 293 cells (C). Representative ratiometric images of the cells obtained by the Ca 2+ i...
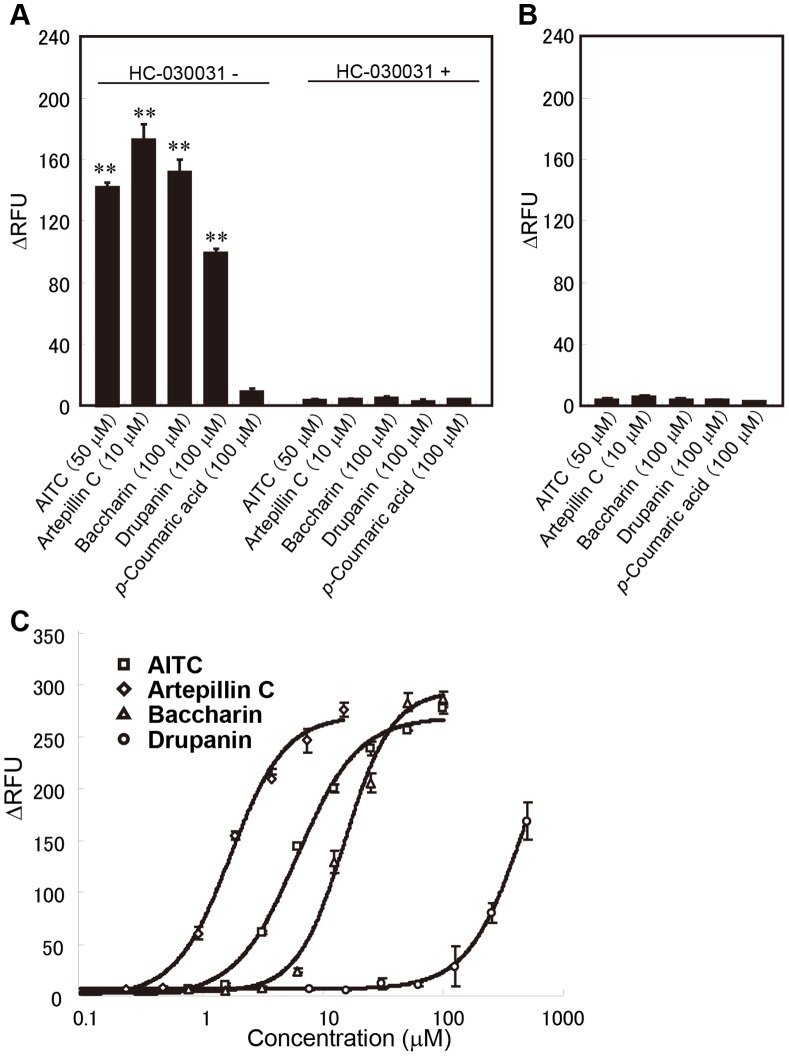
Figure 4
Effects of artepillin C, baccharin, drupanin, and AITC on the responses of hTRPA1-expressing cells.
The cellular responses to the test compounds were examined using a plate reader-based assay in the presence or absence of 50 u00b5M HC-030031, a TRPA1-specific inhibitor, in hTPRA1-expressing cells (A...
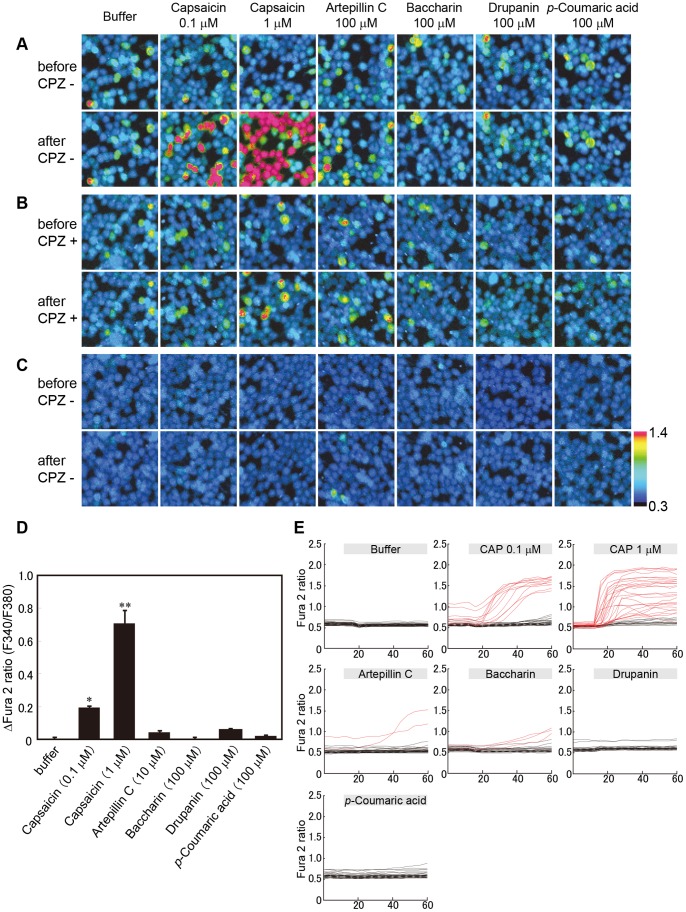
Figure 5
Effects of artepillin C, baccharin, drupanin, and capsaicin on the responses of hTRPV1-expressing cells.
(Au2013C) Representative ratiometric images of Fura 2-loaded hTRPV1-expressing (A and B) and mock-transfected (C) HEK293T cells. The upper and lower columns indicate the images obtained before and aft...
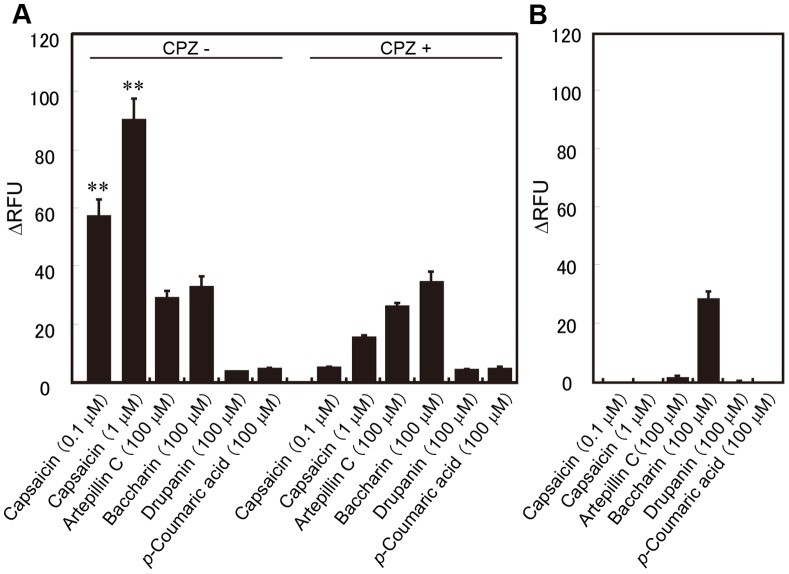
Figure 6
Effects of artepillin C, baccharin, drupanin, and capsaicin on the responses of hTRPV1-expressing cells.
The cellular responses to the test compounds were examined using a plate reader-based assay in the presence or absence of 30 u00b5M capsazepine in hTRPV1-expressing (A) or mock-transfected (B) HEK293T...
Figure images are served from the NIH/NLM PubMed Central Open Access Subset or Europe PMC; copyright remains with the publishers and authors.
💬 Discussion
0 commentsNo comments yet. Be the first to start a discussion!
Leave a Comment