Abstract
Abstract Cryo‐electron tomography analysis involves the selection of macromolecular complexes to be used for subsequent sub‐tomogram averaging and structure determination. Here, we describe a plugin developed for UCSF ChimeraX that allows for the display, selection, and editing of particles within tomograms. Positions and orientations of selected particles can be manually set, modified and inspected in real time, both on screen and in virtual reality, and exported to various file formats. The plugin allows for the parallel visualization of particles stored in several meta data lists, in the context of any three‐dimensional image that can be opened with UCSF ChimeraX. The particles are rendered in user‐defined colors or using colormaps, such that individual classes or groups of particles, cross‐correlation coefficients, or other types of information can be highlighted to the user. The implemented functions are fast, reliable, and intuitive, exploring the broad range of features in UCSF ChimeraX. They allow for a fluent human–machine interaction, which enables an effective understanding of the sub‐tomogram processing pipeline, even for non‐specialist users.
🔬 Techniques
🧬 Organisms
💻 Software
✨ Fluorophores
🔬 Cell Lines
🧪 Reagent Suppliers
💻 Software Details
💻 Code & Software
💾 Data Repositories
🏛️ Research Organizations (ROR)
Affiliated research institutions:
📋 Methods
Implementation
ArtiaX was implemented in Python 3.9 according to the ChimeraX bundle development guidelines. It is packaged and distributed as a Python wheel. The plugin was tested on ChimeraX 1.3 and 1.4. The implementation is compatible with both Qt5 and Qt6, and as such depends on either PyQt5 or PyQt6 for the graphical UI. Other third‐party dependencies include numpy (for linear algebra routines), superqt (for additional UI elements), starfile and pandas (for parsing RELION STAR files). The bundle source code, release and installation instructions are available from https://github.com/FrangakisLab/ArtiaX under GPLv3 license. It is also available on the ChimeraX Toolshed repository ( https://cxtoolshed.rvbi.ucsf.edu ) and can be installed from the ChimeraX menu entry Tools → More Tools.
Tomogram reconstruction and processing Tomograms of purified
Escherichia coli 70 S ribosomes from the publicly available EMPIAR‐10304 dataset 36 were reconstructed at a pixel size of 8.4 Å using super‐sampled SART. 37 , 38 Particle locations and orientations were determined using template matching 23 using the density map EMD‐10211 as a reference. Particles were visualized using EMD‐10211, low‐pass filtered to a resolution of 50 Å. A tomogram of a Mycoplasma genitalium G37 wild‐type cell was reconstructed from previously published tilt series 39 using super‐sampled SART 37 , 38 and binned to a pixel size of 13 Å. The cell membrane and terminal organelles were segmented using Amira 5.3.3 (ThermoFisherScientific, Waltham MA, USA). The segmentation of the cell membrane was post‐processed using mean curvature motion smoothing. 40 Locations and orientations of the major surface adhesion complex (NAP) were used as determined by previous sub‐tomogram alignment and averaging, 41 and visualized using the resulting average density map EMD‐20259, 42 low‐pass filtered to a resolution of 20 Å. Locations and orientations of ribosomes, GroEL/ES complexes and RNA‐polymerases were simulated by random placement within the cell body. For visualization, surfaces were generated from PDB‐7 K00, 43 PDB‐1PCQ, 44 and PDB‐1I6V, 45 respectively, using the ChimeraX “molmap”‐command at a resolution of 20 Å. Reconstructed tomograms of the EMPIAR‐10304 and the Mycoplasma genitalium cell, as well as the respective particle lists have been deposited to the Zenodo repository and are available under https://doi.org/10.5281/zenodo.7116187 .
Show full methods section
Implementation
ArtiaX was implemented in Python 3.9 according to the ChimeraX bundle development guidelines. It is packaged and distributed as a Python wheel. The plugin was tested on ChimeraX 1.3 and 1.4. The implementation is compatible with both Qt5 and Qt6, and as such depends on either PyQt5 or PyQt6 for the graphical UI. Other third‐party dependencies include numpy (for linear algebra routines), superqt (for additional UI elements), starfile and pandas (for parsing RELION STAR files). The bundle source code, release and installation instructions are available from https://github.com/FrangakisLab/ArtiaX under GPLv3 license. It is also available on the ChimeraX Toolshed repository ( https://cxtoolshed.rvbi.ucsf.edu ) and can be installed from the ChimeraX menu entry Tools → More Tools.
Tomogram reconstruction and processing Tomograms of purified
Escherichia coli 70 S ribosomes from the publicly available EMPIAR‐10304 dataset 36 were reconstructed at a pixel size of 8.4 Å using super‐sampled SART. 37 , 38 Particle locations and orientations were determined using template matching 23 using the density map EMD‐10211 as a reference. Particles were visualized using EMD‐10211, low‐pass filtered to a resolution of 50 Å. A tomogram of a Mycoplasma genitalium G37 wild‐type cell was reconstructed from previously published tilt series 39 using super‐sampled SART 37 , 38 and binned to a pixel size of 13 Å. The cell membrane and terminal organelles were segmented using Amira 5.3.3 (ThermoFisherScientific, Waltham MA, USA). The segmentation of the cell membrane was post‐processed using mean curvature motion smoothing. 40 Locations and orientations of the major surface adhesion complex (NAP) were used as determined by previous sub‐tomogram alignment and averaging, 41 and visualized using the resulting average density map EMD‐20259, 42 low‐pass filtered to a resolution of 20 Å. Locations and orientations of ribosomes, GroEL/ES complexes and RNA‐polymerases were simulated by random placement within the cell body. For visualization, surfaces were generated from PDB‐7 K00, 43 PDB‐1PCQ, 44 and PDB‐1I6V, 45 respectively, using the ChimeraX “molmap”‐command at a resolution of 20 Å. Reconstructed tomograms of the EMPIAR‐10304 and the Mycoplasma genitalium cell, as well as the respective particle lists have been deposited to the Zenodo repository and are available under https://doi.org/10.5281/zenodo.7116187 .
Performance measurements
Rendering performance was assessed for ChimeraX 1.3 using the ChimeraX “graphics rate”‐command, modified to write measured frame rates to text files. On each assessed machine (Table S1 ), a demo scene comprising three segmentation maps and 1720 particles (517 NAPs, 225 ribosomes, 364 GroEL/ES complexes and 614 RNA‐polymerases) was generated using a ChimeraX script and ArtiaX commands. For performance comparison, an identical scene was recreated via a Python script, using individual models for each particle and relying exclusively on built‐in ChimeraX functionality. Frame rates were measured at 1 s intervals for 100 s using “simple” and “soft” lighting settings. Baseline performance was measured using the same method with an empty scene. All maps and particle lists used for generating the demo scene, as well as Python scripts used for performance measurements have been deposited to the Zenodo repository and are available under https://doi.org/10.5281/zenodo.7116187 .
Supporting information Table S1 Hardware specifications of the computer systems used for measuring rendering performance. Click here for additional data file. Video S1 A video demonstration of particle list inspection tasks performed using ArtiaX, using a tomogram section from the EMPIAR‐10304 dataset and EMD‐10211 density map. Click here for additional data file. Video S2 A video demonstration of the assembly of a complex 3D scene using ArtiaX, comprising segmentations of an M. genitalium cell membrane and terminal organelles, as well as four particle lists containing 1720 particles in total. Click here for additional data file. Video S3 A video demonstrating particle picking, editing and removal using ArtiaX in virtual reality, as well as VR interaction with a complex 3D scene. Click here for additional data file. Video S4 A video demonstration of particle selection and orientation tasks performed using ArtiaX, using a tomogram of an M. genitalium cell. Click here for additional data file.
📊 Figures
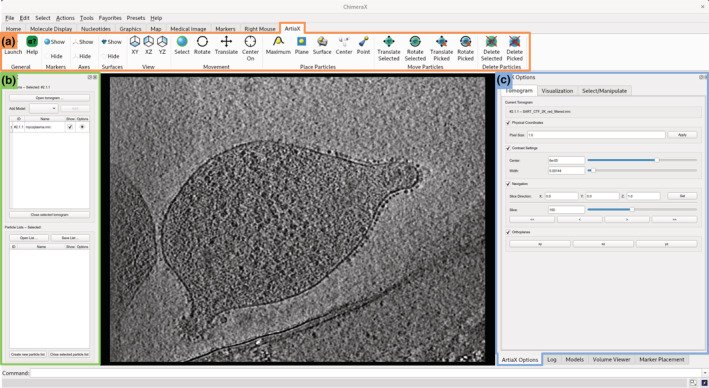
FIGURE 1
The user interface of ArtiaX within ChimeraX. (a) The ArtiaX toolbar provides shortcut access to frequently required operations and custom mouse modes. (b) Opened tomograms and particle lists are orga...
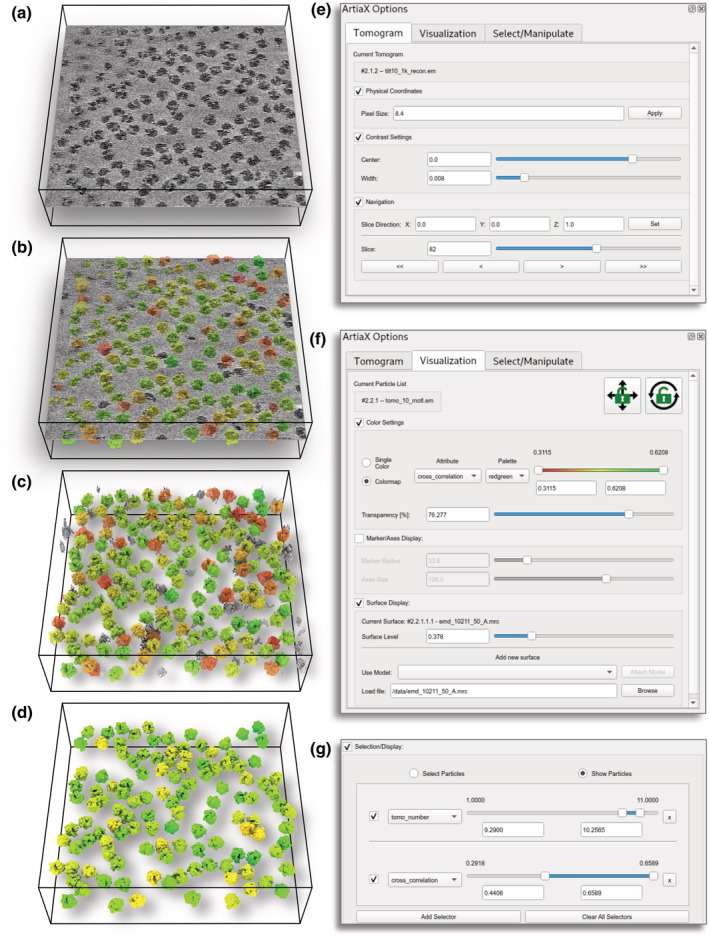
FIGURE 2
Tomogram display and metadatau2010based rendering. Tomographic volumes (EMPIARu201010304) are displayed as nonu2010transparent slices by default (a), and contrast settings, slice direction and positio...
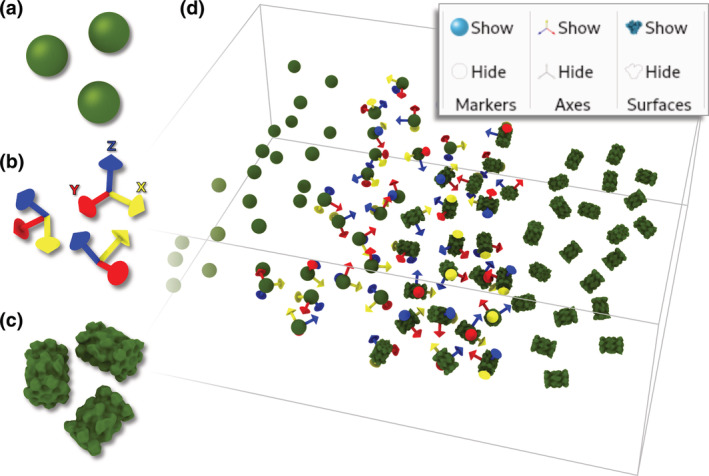
FIGURE 3
Particle list display styles. ArtiaX renders particles either as ChimeraX u201cmarkeru201d (a), using arrows indicating the particle orientation (b), or surfaces extracted from an associated density m...
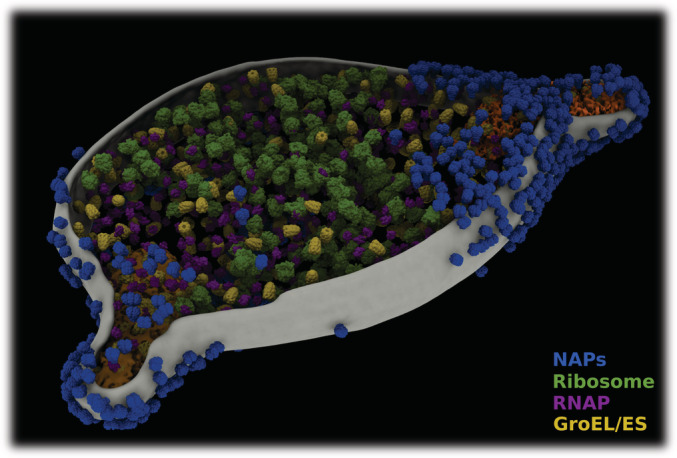
FIGURE 4
Visualization of segmentation maps and multiple particle species. Complex 3D scenes can be rendered and interactively visualized using ArtiaX. In this case, the segmented cell membrane and two termina...
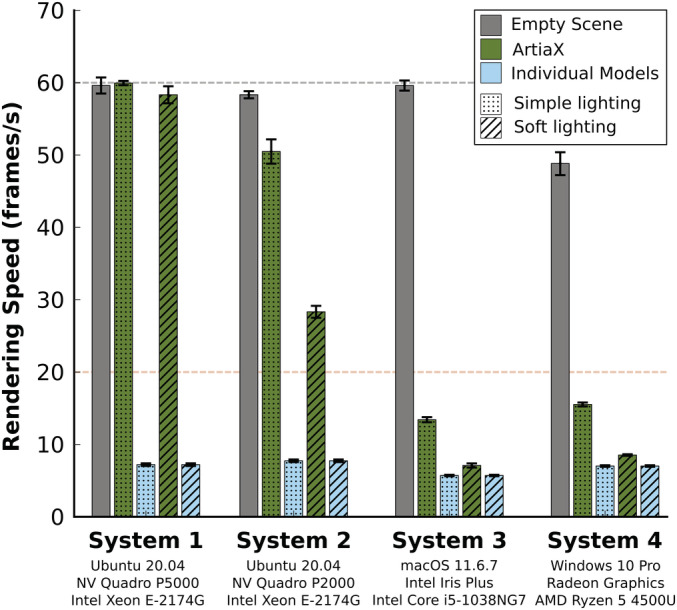
FIGURE 5
Rendering performance for complex 3D scenes. Rendering performance of the scene shown in Figure 4 is increased between twou2010 and ninefold in u201csimple lightingu201du2010mode (dotted bars) when us...
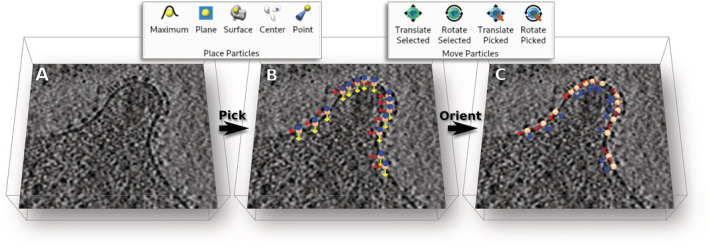
FIGURE 6
Particle picking and orientation: Individual major surface adhesion complexes can be picked on planes of a tomogram of an Mycoplasma genitalium cell 39 (a) using builtu2010in ChimeraX mouse modes (top...
Figure images are served from the NIH/NLM PubMed Central Open Access Subset or Europe PMC; copyright remains with the publishers and authors.
💬 Discussion
0 commentsNo comments yet. Be the first to start a discussion!
Leave a Comment