Abstract
Membrane trafficking during cytokinesis is not well understood. We used advanced live cell imaging techniques to track exocytosis of single vesicles to determine whether constitutively exocytosed membrane is focally delivered to the cleavage furrow. Ultrasensitive three-dimensional confocal time-lapse imaging of the temperature-sensitive membrane cargo protein vesicular stomatitis virus protein-yellow fluorescent protein revealed that vesicles from both daughter cells traffic out of the Golgi and into the furrow, following curvilinear paths. Immunolocalization and photobleaching experiments indicate that individual vesicles accumulate at the midbody and generate a reserve vesicle pool that is distinct from endosomal and lysosomal compartments. Total internal reflection fluorescence microscopy imaging provided direct evidence that Golgi-derived vesicles from both daughter cells not only traffic to the furrow region but dock and fuse there, supporting a symmetrically polarized exocytic delivery model. In contrast, quantitative analysis of midbody abscission showed inheritance of the midbody remnant by one daughter cell, indicating that cytokinesis is composed of both symmetrical and asymmetrical stages.
🔬 Techniques
✨ Fluorophores
🧪 Sample Preparation
🏭 Microscope Brands
🧪 Reagent Suppliers
📷 Detectors
🔎 Objectives
💻 Software Details
💾 Data Repositories
🏛️ Research Organizations (ROR)
Affiliated research institutions:
📋 Methods
Cell culture and VSVG-YFP fluorescence labeling
BSC1 and Hela cells were grown in DME (American Type Culture Collection) supplemented with 10% FBS, 1% penicillin/streptomycin, 1% l -glutamine, and 1% nonessential amino acids (Invitrogen). Cells were cultured at 37°C (unless otherwise noted), supplemented with 5% CO 2 , and plated on dishes (Mattek) before imaging. For VSVG-YFP and YFP-GPI expression, BSC1 and Hela cells were infected with adenovirus as previously described ( Toomre et al., 2000 ). YFP-GPI–infected cells were incubated at 19°C for 2 h before imaging. Immunofluorescence and VSVG/transferrin labeling BSC1 and Hela cells expressing VSVG-YFP (ts045 with spacer; Toomre et al., 2000 ) were released from the 39°C temperature-sensitive block for 60 min, permeabilized with 0.1% Triton X-100 and 4% PFA for 30 s, and fixed in 4% PFA with 0.02% glutaraldehyde for 20 min at room temperature. Cells were washed with PBS and immunostained with mouse anti-tubulin (Sigma-Aldrich), mouse α-EEA1 (BD Biosciences), or mouse α-LAMP1 (BD Biosciences) antibodies, followed by donkey α-mouse Cy5 or donkey α-mouse Texas red (Jackson ImmunoResearch Laboratories) secondary antibodies, and imaged with SDCM. For midbody immunofluorescence, cells were fixed on ice with ethanol for 15 min, and immunostained with rabbit α-MKLP1 (Santa Cruz Biotechnology, Inc.) and HOECHST 15090 dye (Serva) followed by donkey α-rabbit Cy2 (Jackson ImmunoResearch Laboratories). All confocal images shown are 2D projections of confocal stacks (typically ∼10 sections; 0.5-μm intervals). For VSVG/transferrin colabeling, BSC1 cells were coinfected with adenoviruses separately expressing VSVG-YFP and transferrin receptor for 1 h at 37°C. Cells were washed with PBS and incubated in DME for 9–12 h at 39.5°C before imaging. Cells were transferred to 32°C for 15 min before adding a pulse of 5 mg/ml transferrin–Texas red (Invitrogen) for 5 min. Cells were washed with PBS and incubated in DME at 32°C for an additional 15 min before live imaging of both fluorophores with SDCM.
Show full methods section
Cell culture and VSVG-YFP fluorescence labeling
BSC1 and Hela cells were grown in DME (American Type Culture Collection) supplemented with 10% FBS, 1% penicillin/streptomycin, 1% l -glutamine, and 1% nonessential amino acids (Invitrogen). Cells were cultured at 37°C (unless otherwise noted), supplemented with 5% CO 2 , and plated on dishes (Mattek) before imaging. For VSVG-YFP and YFP-GPI expression, BSC1 and Hela cells were infected with adenovirus as previously described ( Toomre et al., 2000 ). YFP-GPI–infected cells were incubated at 19°C for 2 h before imaging. Immunofluorescence and VSVG/transferrin labeling BSC1 and Hela cells expressing VSVG-YFP (ts045 with spacer; Toomre et al., 2000 ) were released from the 39°C temperature-sensitive block for 60 min, permeabilized with 0.1% Triton X-100 and 4% PFA for 30 s, and fixed in 4% PFA with 0.02% glutaraldehyde for 20 min at room temperature. Cells were washed with PBS and immunostained with mouse anti-tubulin (Sigma-Aldrich), mouse α-EEA1 (BD Biosciences), or mouse α-LAMP1 (BD Biosciences) antibodies, followed by donkey α-mouse Cy5 or donkey α-mouse Texas red (Jackson ImmunoResearch Laboratories) secondary antibodies, and imaged with SDCM. For midbody immunofluorescence, cells were fixed on ice with ethanol for 15 min, and immunostained with rabbit α-MKLP1 (Santa Cruz Biotechnology, Inc.) and HOECHST 15090 dye (Serva) followed by donkey α-rabbit Cy2 (Jackson ImmunoResearch Laboratories). All confocal images shown are 2D projections of confocal stacks (typically ∼10 sections; 0.5-μm intervals). For VSVG/transferrin colabeling, BSC1 cells were coinfected with adenoviruses separately expressing VSVG-YFP and transferrin receptor for 1 h at 37°C. Cells were washed with PBS and incubated in DME for 9–12 h at 39.5°C before imaging. Cells were transferred to 32°C for 15 min before adding a pulse of 5 mg/ml transferrin–Texas red (Invitrogen) for 5 min. Cells were washed with PBS and incubated in DME at 32°C for an additional 15 min before live imaging of both fluorophores with SDCM.
Microscopy
For ultra-sensitive 4D imaging (3D + time) a Yokagawa-type SDCM system equipped with a FRAP photokinesis unit was used (PerkinElmer). The system was mounted onto an inverted microscope (IX71; Olympus) equipped with a 1 Kb × 1 Kb electron-multiplying charge-coupled device camera (Hamamatsu Photonics) and a temperature-controlled stage set at 32°C, which was controlled by Ultraview ERS software (PerkinElmer). Samples were imaged in phenol red–free DME by a 60× 1.4 NA oil phase objective, yielding a spatial resolution of 0.14 μm per pixel. Excitation was achieved using 514-nm argon and 568-nm argon/krypton lasers (Melles Griot). Exposure times were 0.1–0.25 s. TIRFM images were acquired using an inverted microscope equipped with a 1.45 NA 60× TIRFM lens (Olympus), back-illuminated electron-multiplying charge-coupled device camera (512 × 512, 16-bit; iXon887; Andor Technologies), and controlled by Andor iQ software (Andor Technology). Excitation was achieved using a 514-nm line of argon laser, and exposure times were 0.1–0.2 s and acquired at 0.5–4 Hz. The calculated evanescent field depth was ∼100 nm. DIC images were acquired using either a 60× 1.2 NA water immersion objective or 60× 1.42 NA oil immersion objective, with an aluminum closed cell chamber that uses two 15-mm coverslips, and a BX-51 microscope (Olympus) with Nomarski optics, all enclosed within an Air-therm temperature-regulated environmental box at 37°C. Exposure times were 1 s, and two to four images were acquired per minute with an iXon887 electron-multiplying charge-coupled device camera. FRAP experiments A photokinesis unit mounted on the SDCM (described in Microscopy) was used for FRAP experimentation and controlled by Ultraview ERS software. Regions of interest (ROI) were identified and photobleached with a 514-nm argon laser at 100% power for 200 bleach cycles (∼3–5 s). Quantification of fluorescence recovery was obtained using Ultraview ERS software programs.
Image analysis Ultraview
ERS software was used to subtract background of images before analysis by Image J software (National Institutes of Health). No nonlinear algorithms were used to alter fluorescent signals. Colocalizations were quantified for numerous ROI that corresponded to EMMA on a pixel-per-pixel basis using Imaris (Biplane AG) automated software. Online supplemental material Fig. S1 shows that post-Golgi vesicles in the cleavage furrow are distinct from satellite Golgi. Fig. S2 shows that SDCM analysis of YFP-GPI–labeled post-Golgi vesicles indicates trafficking into the cleavage furrow from both daughter cells. Fig. S3 shows that quantitative imaging of VSVG-YFP in BSC1 cells by TIRFM differentiates between vesicles that leave the evanescent field and those that dock and fuse. Video 1 shows that SDCM analysis reveals that post-Golgi vesicles are directed to the cleavage furrow from both daughter cells (QuickTime video from Fig. 3 A). Video 2 shows manual tracking of post-Golgi vesicles that are directed to the cleavage furrow from both daughter cells (QuickTime video from Fig. 3 B). Video 3 shows that SDCM analysis reveals that YFP-GPI–labeled post-Golgi vesicles are directed to the cleavage furrow from both daughter cells. Video 4 shows that FRAP analysis suggests that post-Golgi membrane accumulations in the cleavage furrow consists of individual vesicles (QuickTime video from Fig. 3 E). Video 5 shows that TIRFM analysis reveals exocytosis of post-Golgi vesicles from both daughter cells at the cleavage furrow (QuickTime video from Fig. 4, A, D, and E). Video 6 shows that TIRFM analysis reveals exocytosis of post-Golgi vesicles from both daughter cells at the cleavage furrow. Video 7 shows that TIRFM analysis reveals exocytosis of post-Golgi vesicle at the cleavage furrow. Video 8 shows that DIC time-lapse imaging indicates asymmetrical midbody inheritance in BSC1 cells (QuickTime video from Fig. 5 D). Video 9 shows that DIC time-lapse imaging indicates asymmetrical midbody inheritance in Hela cells (QuickTime video from Fig. 5 E). Online supplemental material is available at http://www.jcb.org/cgi/content/full/jcb.200712137/DC1 .
Online supplemental material Fig. S1 shows that post-Golgi vesicles in the cleavage furrow are distinct from satellite Golgi. Fig. S2 shows that SDCM analysis of YFP-GPI–labeled post-Golgi vesicles indicates trafficking into the cleavage furrow from both daughter cells. Fig. S3 shows that quantitative imaging of VSVG-YFP in BSC1 cells by TIRFM differentiates between vesicles that leave the evanescent field and those that dock and fuse. Video 1 shows that SDCM analysis reveals that post-Golgi vesicles are directed to the cleavage furrow from both daughter cells (QuickTime video from Fig. 3 A). Video 2 shows manual tracking of post-Golgi vesicles that are directed to the cleavage furrow from both daughter cells (QuickTime video from Fig. 3 B). Video 3 shows that SDCM analysis reveals that YFP-GPI–labeled post-Golgi vesicles are directed to the cleavage furrow from both daughter cells. Video 4 shows that FRAP analysis suggests that post-Golgi membrane accumulations in the cleavage furrow consists of individual vesicles (QuickTime video from Fig. 3 E). Video 5 shows that TIRFM analysis reveals exocytosis of post-Golgi vesicles from both daughter cells at the cleavage furrow (QuickTime video from Fig. 4, A, D, and E). Video 6 shows that TIRFM analysis reveals exocytosis of post-Golgi vesicles from both daughter cells at the cleavage furrow. Video 7 shows that TIRFM analysis reveals exocytosis of post-Golgi vesicle at the cleavage furrow. Video 8 shows that DIC time-lapse imaging indicates asymmetrical midbody inheritance in BSC1 cells (QuickTime video from Fig. 5 D). Video 9 shows that DIC time-lapse imaging indicates asymmetrical midbody inheritance in Hela cells (QuickTime video from Fig. 5 E). Online supplemental material is available at http://www.jcb.org/cgi/content/full/jcb.200712137/DC1 .
Supplementary Material [Supplemental Material Index]
📊 Figures
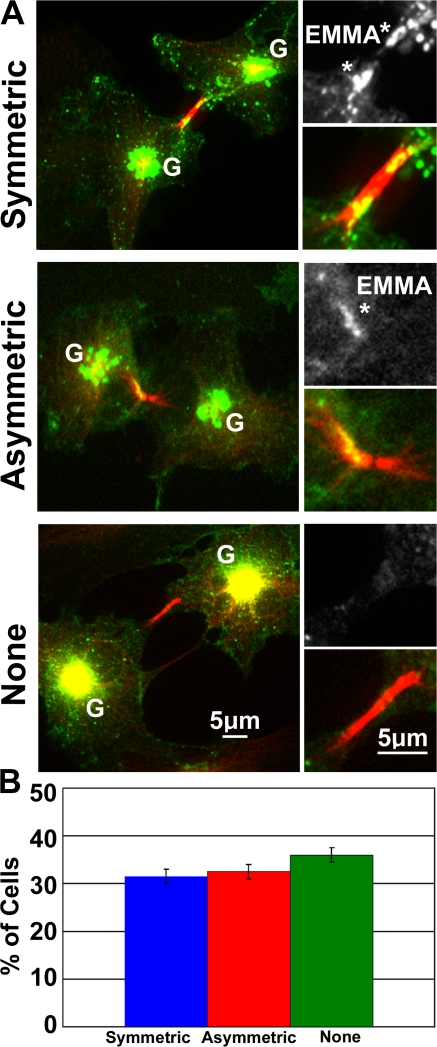
Figure 1.
Post-Golgi membrane accumulates in the cleavage furrow of cells undergoing cytokinesis. (A) BSC1 cells expressing VSVG-YFP were fixed 60 min after transfer to permissive temperature (32u00b0C) and imm...
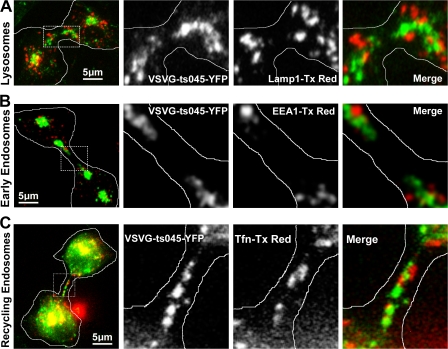
Figure 2.
Accumulation of VSVG-YFPu2013labeled post-Golgi exocytic membrane is distinct from other membrane compartments. (A and B) Hela cells expressing VSVG-YFP (green) were fixed 60 min after transfer to 32u...
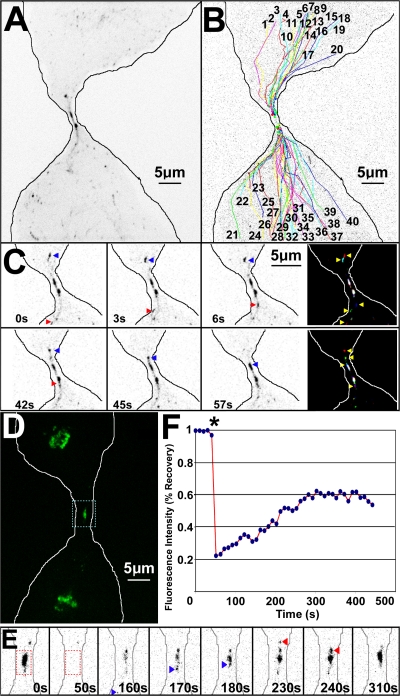
Figure 3.
SDCM and FRAP analysis reveals that post-Golgi vesicles are directed to the cleavage furrow from both daughter cells and form accumulations of individual vesicles. (A) BSC1 cells expressing VSVG-YFP w...
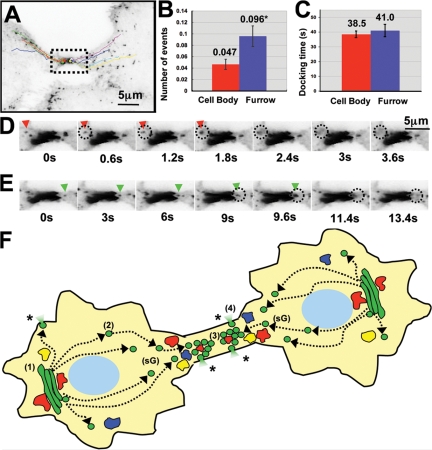
Figure 4.
TIRFM analysis reveals exocytosis of post-Golgi vesicles from both daughter cells at the cleavage furrow during cytokinesis. (A) BSC1 cells expressing VSVG-YFP were imaged by TIRFM at 1.67 frames/s (V...
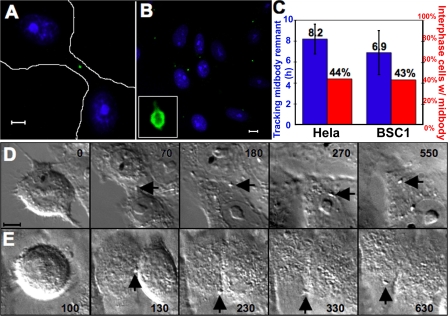
Figure 5.
The cytokinesis midbody is asymmetrically inherited by one daughter cell. (A and B) Hela or BSC1 cells were fixed and immunostained with u03b1-MKLP1. (A and B) During cytokinesis (A), MKLP1 localizes ...
Figure images are served from the NIH/NLM PubMed Central Open Access Subset or Europe PMC; copyright remains with the publishers and authors.
💬 Discussion
0 commentsNo comments yet. Be the first to start a discussion!
Leave a Comment