Abstract
The effectiveness of SARS-CoV-2 vaccines and therapeutic antibodies have been limited by the continuous emergence of viral variants and by the restricted diffusion of antibodies from circulation into the sites of respiratory virus infection. Here, we report the identification of two highly conserved regions on the Omicron variant receptor-binding domain recognized by broadly neutralizing antibodies. Furthermore, we generated a bispecific single-domain antibody that was able to simultaneously and synergistically bind these two regions on a single Omicron variant receptor-binding domain as revealed by cryo-EM structures. We demonstrated that this bispecific antibody can be effectively delivered to lung via inhalation administration and exhibits exquisite neutralization breadth and therapeutic efficacy in mouse models of SARS-CoV-2 infections. Importantly, this study also deciphered an uncommon and highly conserved cryptic epitope within the spike trimeric interface that may have implications for the design of broadly protective SARS-CoV-2 vaccines and therapeutics.
🔬 Techniques
🔭 Microscopes
🧬 Organisms
💻 Software
✨ Fluorophores
🧪 Sample Preparation
🔬 Cell Lines
🏭 Microscope Brands
🧪 Reagent Suppliers
💻 Software Details
💾 Data Repositories
🏷️ Research Resource Identifiers (RRIDs)
Verified research resources used in this paper:
🏛️ Research Organizations (ROR)
Affiliated research institutions:
📋 Methods
Key resources table
REAGENT or RESOURCE SOURCE IDENTIFIER Antibodies Monoclonal ANTI-FLAG® M2-Peroxidase
(HRP) antibody Sigma-Aldrich Cat# A8592-1MG; RRID: AB_439702 Anti-Human IgG (Fab specific)-Peroxidase antibody produced in goat Sigma-Aldrich Cat# A0293-1ML; RRID: AB_257875 Polyclonal rabbit anti-SARS Nucleocapsid protein antibody Rockland Cat# 200-402-A50; RRID: AB_828403 Goat anti-Rabbit IgG (H+L) Secondary Antibody, HRP ThermoFisher Cat# 31460; RRID: AB_228341 CB6 IgG This paper N/A P2B-2F6 IgG This paper N/A S309 IgG This paper N/A CR3022 IgG This paper N/A Bacterial and virus strains DH5α Competent Cells CWBIO Cat# CW0808 HB2151 Escherichia coli Strains This paper N/A SARS-CoV-2 strain nCoV-SH01 Fudan University N/A Biological samples Plasma, donor Vac01 This paper N/A Plasma, donor Vac02 This paper N/A Plasma, donor Vac03 This paper N/A Plasma, donor Vac04 This paper N/A Plasma, donor Vac05 This paper N/A Plasma, donor Vac06 This paper N/A Plasma, donor Vac07 This paper N/A Chemicals, peptides, and recombinant proteins Phosphate Buffered Saline solution HyClone Cat# SH30256.01B Bovine Serum Albumin (BSA) Yeasen Cat# 36101ES25 EZ-Trans Life-iLab Cat# AC04L098 Dulbecco's Modified Eagle Medium, high glucose Meilunbio Cat# PWL035-1 BirA500 Kit Avidity N/A Protein Standard Mix 15 -600 kDa Sigma-Aldrich Cat# 69385 HisSep Ni-NTA Agarose Resin 6FF Yeasen Cat# 20503ES10 High Fidelity PCR Master Roche Cat# 12140314001 IPTG Yeasen Cat# 10902ES60 SfiI New England Biolabs Cat# R0123L Protein A Resin GenScript Cat# L00210 Protein G Resin GenScript Cat# L00209 Oxoid™ Tryptone ThermoFisher Cat# LP0042T EZ-Link™ Sulfo-NHS-LC-LC-Biotin ThermoFisher Cat# A35358 Oxoid™ Yeast Extract ThermoFisher Cat# LP0021 Tween 20 Sigma-Aldrich Cat# 9005-64-5 TRIzol® Reagent ThermoFisher Cat# 335912 2-Propanol Sigma-Aldrich Cat# 67-63-0 Ethyl Alcohol Sigma-Aldrich Cat# 64-17-5 ABTS ThermoFisher Cat# 002024 TrueBlue™ Peroxidase Substrate Seracare Cat# 5510-0050 0.25% Trypsin EDTA phenol red Meilunbio Cat# MA0233 SARS-CoV-2 Spike RBD-His (Alpha) Sino Biological Inc. Cat# 40592-V08H18 SARS-CoV-2 Spike RBD-His (Beta) Sino Biological Inc. Cat# 40592-V08H85 SARS-CoV-2 Spike RBD-His (Gamma) Sino Biological Inc. Cat# 40592-V08H86 SARS-CoV-2 Spike RBD-His (Delta) Sino Biological Inc. Cat# 40592-V08H90 SARS-CoV-2 Spike RBD-His (Omicron) ACROBiosystems Cat# SPD-C522e SARS-CoV-2 Spike RBD-His Sino Biological Inc. Cat# 40592-V08B ACE2-His Protein Novoprotein Scientific Inc. Cat# C419 Critical commercial assays Luciferase Assay System Promega Cat# E1501 Dylight 800 Antibody Labeling Kit ThermoFisher Cat# 53062 FastKing RT Kit (With gDNAase) TianGen Cat# KR116-01 SuperReal PreMix Plus (SYB Green) TianGen Cat# FP205 VigoFect Vigorous Biotechnology Cat# T001 MultiS one step cloning kit Vazyme Cat# C113-01 Experimental models: Cell lines Expi293 Expression System ThermoFisher Cat# A14635 Vero E6 cells ATCC Cat# CRL-1586 Huh-7 cells Cell Bank of the Chinese Academy of Sciences N/A 293T cells ATCC Cat# CRL-3216 Experimental models: Organisms/strains hACE2 mice (B6/JGpt-Ace2 em1Cin(hACE2-stop) /Gpt) GemPharmatech Strain NO.T037630 hACE2 mice C57BL/6J-Tgtn (CAG-human ACE2-IRES-Luciferase-WPRE-polyA) Smoc Shanghai Model Organisms Center Cat# NM-TG-200002 Deposited data Cryo-EM map and the coordinated of SARS-CoV-2 Omicron S complexed with bn03(two down and 1 up RBDs) This paper EMD-32501 & PDB 7WHJ Cryo-EM map and the coordinated of SARS-CoV-2 Omicron S complexed with bn03(one down and 1 half-up RBDs) This paper EMD-32500 & PDB 7WHI Cryo-EM map and the coordinated of SARS-CoV-2 Omicron S complexed with bn03(two up and one down RBDs) This paper EMD-32503 & PDB 7WHK Recombinant DNA S ectodomain gene: SARS-CoV-2 (strain B.1.1.529) Genscript Cat# MC_0101274 RBD gene: SARS-CoV-2 (strain WIV04, GISAID accession no. EPI_ISL_402124) Genscript N/A VL and VH gene of S309, CR3022, CB6, P2B-2F6 Genscript N/A pComb3x vector Addgene Cat# 63891 pSecTag2B expression vector ThermoFisher Cat# V90020 Software and algorithms UCSF Chimera UCSF Software N/A DeepEMhancer python package N/A RELION v3.0 https://www3.mrc-lmb.cam.ac.uk/relion//index.php/Download_&_install N/A COOT https://www2.mrc-lmb.cam.ac.uk/Personal/pemsley/coot N/A cryoSPARC Structura Biotechnology Inc. N/A MotionCor2 UCSF Software https://docs.google.com/forms/d/e/1FAIpQLSfAQm5MA81qTx90W9JL6ClzSrM77tytsvyyHh1ZZWrFByhmfQ/viewform PHENIX https://phenix-online.org/ N/A Living Image® Software PerkinElmer N/A ForteBio Data Analysis software Pall ForteBio LLC N/A Prism 8.0 GraphPad https://www.graphpad.com/scientific-software/prism/ PyMol PyMol N/A PDBePISA Europea Bioinformatics Institute https://www.ebi.ac.uk/pdbe/prot_int/pistart.html Resource availability Lead contact Further information and requests for resources and reagents may be directed to and will be fulfilled by the lead contact, Tianlei Ying ( tlying@fudan.edu.cn ).
Show full methods section
Key resources table
REAGENT or RESOURCE SOURCE IDENTIFIER Antibodies Monoclonal ANTI-FLAG® M2-Peroxidase
(HRP) antibody Sigma-Aldrich Cat# A8592-1MG; RRID: AB_439702 Anti-Human IgG (Fab specific)-Peroxidase antibody produced in goat Sigma-Aldrich Cat# A0293-1ML; RRID: AB_257875 Polyclonal rabbit anti-SARS Nucleocapsid protein antibody Rockland Cat# 200-402-A50; RRID: AB_828403 Goat anti-Rabbit IgG (H+L) Secondary Antibody, HRP ThermoFisher Cat# 31460; RRID: AB_228341 CB6 IgG This paper N/A P2B-2F6 IgG This paper N/A S309 IgG This paper N/A CR3022 IgG This paper N/A Bacterial and virus strains DH5α Competent Cells CWBIO Cat# CW0808 HB2151 Escherichia coli Strains This paper N/A SARS-CoV-2 strain nCoV-SH01 Fudan University N/A Biological samples Plasma, donor Vac01 This paper N/A Plasma, donor Vac02 This paper N/A Plasma, donor Vac03 This paper N/A Plasma, donor Vac04 This paper N/A Plasma, donor Vac05 This paper N/A Plasma, donor Vac06 This paper N/A Plasma, donor Vac07 This paper N/A Chemicals, peptides, and recombinant proteins Phosphate Buffered Saline solution HyClone Cat# SH30256.01B Bovine Serum Albumin (BSA) Yeasen Cat# 36101ES25 EZ-Trans Life-iLab Cat# AC04L098 Dulbecco's Modified Eagle Medium, high glucose Meilunbio Cat# PWL035-1 BirA500 Kit Avidity N/A Protein Standard Mix 15 -600 kDa Sigma-Aldrich Cat# 69385 HisSep Ni-NTA Agarose Resin 6FF Yeasen Cat# 20503ES10 High Fidelity PCR Master Roche Cat# 12140314001 IPTG Yeasen Cat# 10902ES60 SfiI New England Biolabs Cat# R0123L Protein A Resin GenScript Cat# L00210 Protein G Resin GenScript Cat# L00209 Oxoid™ Tryptone ThermoFisher Cat# LP0042T EZ-Link™ Sulfo-NHS-LC-LC-Biotin ThermoFisher Cat# A35358 Oxoid™ Yeast Extract ThermoFisher Cat# LP0021 Tween 20 Sigma-Aldrich Cat# 9005-64-5 TRIzol® Reagent ThermoFisher Cat# 335912 2-Propanol Sigma-Aldrich Cat# 67-63-0 Ethyl Alcohol Sigma-Aldrich Cat# 64-17-5 ABTS ThermoFisher Cat# 002024 TrueBlue™ Peroxidase Substrate Seracare Cat# 5510-0050 0.25% Trypsin EDTA phenol red Meilunbio Cat# MA0233 SARS-CoV-2 Spike RBD-His (Alpha) Sino Biological Inc. Cat# 40592-V08H18 SARS-CoV-2 Spike RBD-His (Beta) Sino Biological Inc. Cat# 40592-V08H85 SARS-CoV-2 Spike RBD-His (Gamma) Sino Biological Inc. Cat# 40592-V08H86 SARS-CoV-2 Spike RBD-His (Delta) Sino Biological Inc. Cat# 40592-V08H90 SARS-CoV-2 Spike RBD-His (Omicron) ACROBiosystems Cat# SPD-C522e SARS-CoV-2 Spike RBD-His Sino Biological Inc. Cat# 40592-V08B ACE2-His Protein Novoprotein Scientific Inc. Cat# C419 Critical commercial assays Luciferase Assay System Promega Cat# E1501 Dylight 800 Antibody Labeling Kit ThermoFisher Cat# 53062 FastKing RT Kit (With gDNAase) TianGen Cat# KR116-01 SuperReal PreMix Plus (SYB Green) TianGen Cat# FP205 VigoFect Vigorous Biotechnology Cat# T001 MultiS one step cloning kit Vazyme Cat# C113-01 Experimental models: Cell lines Expi293 Expression System ThermoFisher Cat# A14635 Vero E6 cells ATCC Cat# CRL-1586 Huh-7 cells Cell Bank of the Chinese Academy of Sciences N/A 293T cells ATCC Cat# CRL-3216 Experimental models: Organisms/strains hACE2 mice (B6/JGpt-Ace2 em1Cin(hACE2-stop) /Gpt) GemPharmatech Strain NO.T037630 hACE2 mice C57BL/6J-Tgtn (CAG-human ACE2-IRES-Luciferase-WPRE-polyA) Smoc Shanghai Model Organisms Center Cat# NM-TG-200002 Deposited data Cryo-EM map and the coordinated of SARS-CoV-2 Omicron S complexed with bn03(two down and 1 up RBDs) This paper EMD-32501 & PDB 7WHJ Cryo-EM map and the coordinated of SARS-CoV-2 Omicron S complexed with bn03(one down and 1 half-up RBDs) This paper EMD-32500 & PDB 7WHI Cryo-EM map and the coordinated of SARS-CoV-2 Omicron S complexed with bn03(two up and one down RBDs) This paper EMD-32503 & PDB 7WHK Recombinant DNA S ectodomain gene: SARS-CoV-2 (strain B.1.1.529) Genscript Cat# MC_0101274 RBD gene: SARS-CoV-2 (strain WIV04, GISAID accession no. EPI_ISL_402124) Genscript N/A VL and VH gene of S309, CR3022, CB6, P2B-2F6 Genscript N/A pComb3x vector Addgene Cat# 63891 pSecTag2B expression vector ThermoFisher Cat# V90020 Software and algorithms UCSF Chimera UCSF Software N/A DeepEMhancer python package N/A RELION v3.0 https://www3.mrc-lmb.cam.ac.uk/relion//index.php/Download_&_install N/A COOT https://www2.mrc-lmb.cam.ac.uk/Personal/pemsley/coot N/A cryoSPARC Structura Biotechnology Inc. N/A MotionCor2 UCSF Software https://docs.google.com/forms/d/e/1FAIpQLSfAQm5MA81qTx90W9JL6ClzSrM77tytsvyyHh1ZZWrFByhmfQ/viewform PHENIX https://phenix-online.org/ N/A Living Image® Software PerkinElmer N/A ForteBio Data Analysis software Pall ForteBio LLC N/A Prism 8.0 GraphPad https://www.graphpad.com/scientific-software/prism/ PyMol PyMol N/A PDBePISA Europea Bioinformatics Institute https://www.ebi.ac.uk/pdbe/prot_int/pistart.html Resource availability Lead contact Further information and requests for resources and reagents may be directed to and will be fulfilled by the lead contact, Tianlei Ying ( tlying@fudan.edu.cn ).
Materials availability
All requests for resources and reagents should be directed to the lead contact author. This includes mice and viruses. All reagents will be made available on request after completion of a Materials Transfer Agreement.
Experimental model and subject details Human Specimen
This study included seven volunteers from Fudan University. The participants aged from 24 to 37 consist of 6 females and one male. All participants have received three doses of SARS-CoV-2 inactivated vaccine. Blood samples were collected three weeks after the third dose. All volunteers signed informed consent forms and protocols were approved by the Ethics Committee of the School of Basic Medical Sciences at Fudan University.
Animals
Pathogen-free, male hACE2 mice were purchased from GemPharmatech (B6/JGpt-Ace2 em1Cin(hACE2-stop) /Gpt) to mimic the mild infection model. Pathogen-free, male CAG-hACE2-IRES-Luc-Tg transgenic mice, expressing high level of hACE2 and more sensitive to SARS-CoV-2 infection were purchased from Shanghai Model Organisms Center to mimic sever infection model. The mice used in this study were 8-10 weeks old and well fed in BSL-3 labs for several days to adapt to the environment before performing experiments. Mice were randomly allocated to each group and all animal studies were performed in BSL-3 lab of Fudan University. Cells Vero E6 cells and 293 T cells were obtained from the American Type Culture Collection (ATCC), Huh-7 cells were obtained from Cell Bank of the Chinese Academy of Sciences (Shanghai, China). Cells were cultured in Dulbecco’s modified Eagle’s medium (DMEM) supplemented with 10% fetal bovine serum (FBS) in 37°C, 5% CO 2 atmosphere. Authentic SARS-CoV-2 virus The authentic SARS-CoV-2 virus hCoV-SH01 used in the focus-forming assay was obtained from Shanghai Medical College and stored at -80°C in a BSL-3 laboratory (Fudan University). Ethics statements All the procedures related to animal handling, care, and the treatment were performed and approved by the Ethics Committee of the School of Basic Medical Sciences at Fudan University in accordance with the recommendations in the Guide for the Care and Use of Laboratory Animals of Fudan University. The authentic SARS-CoV-2 infection and sample collection were performed in BSL-3 lab of Fudan University. Method details Antibody footprint analysis The SARS-CoV-2 spike structure from PDB (PDB entry 7VND) was used for displaying mutations within Omicron and epitope footprints of antibodies. The structures of RBD in complex with CB6 (PDB entry 7C01), B38 (PDB entry 7BZ5), CC12.1 (PDB entry 6XC2), CC12.3 (PDB entry 6XC4), C102 (PDB entry 7K8M), REGN10933 (PDB entry 6XDG), P2B-2F6 (PDB entry 7BWJ), LY-CoV555 (PDB entry 7KMG), S2E12 (PDB entry 7K45), n3113 (PDB entry 7VNB), COVA1-16 (PDB entry 7JMW), CR3022 (PDB entry 6W41) and spike in complex with C105 (PDB entry 6XCM), BD23 (PDB entry 7BYR), 5A6 (PDB entry 7KQB), S309 (PDB entry 6WS6), C135 (PDB entry 7K8Z), 47D11 (PDB entry 7KAJ), EY6A (PDB entry 6ZDH), 3D11 (PDB entry 7KQE) were used to analyze the antibody epitopes. Interface residues were identified by ePISA ( http://www.ebi.ac.uk/pdbe/prot_int/pistart.html ) using default parameters and checked in COOT. The graphs were drawn using PyMoL or ChimeraX.
Protein expression and purification
The sequences of single-domain antibody n3130v, n3113v and bn03 were cloned into pComb3x vector with N-terminal OmpA signal peptide (MKKTAIAIAVALAGFATVAQA) and C-terminal hexahistidine and Flag tag and was expressed in E.coli HB2151. Bacteria transformed with expression plasmid was amplified to express antibody at 30°C for 12 h under the induction of IPTG. The bacteria were pelleted, resuspended in phosphate buffered saline (PBS) buffer and disrupted by ultrasonication, followed by centrifugation at 17,000 rpm for 30 minutes. The supernatant of n3113v was purified by Ni-NTA (Yeasen) and n3130v, and bispecific single-domain antibodies (bn01-04) were purified by Protein A resin (GenScript) following the manufacture’s instruction. The light chain and heavy chain of S309, CB6, P2B-2F6, CR3022 were subcloned into pTT expression vector digested by Sfi I in IgG1 format. These IgG antibodies were expressed by Expi293 cells and purified by Protein G (GenScript). Protein integrity was analyzed by sodium dodecyl-sulfate polyacrylamide gel electrophoresis (SDS-PAGE). Wildtype RBD (WT) was produced and stored in our laboratory. His-tagged Omicron RBD was purchased from AcroBiosystems and other RBD variants (include Alpha, Beta, Gamma, Delta) were purchased from Sino Biological Inc. Enzyme-linked immunosorbent assay (ELISA) His-tagged WT and Omicron RBD at 100 ng per well was coated in 96 well half-area microplate (Corning #3690) over night at 4 °C. The antigen coated plate was blocked with PBS containing 5% bovine serum albumin (BSA) for 1 h at 37 °C and washed by three times of PBST (PBS with 0.05% Tween 20). 50 μL of three-fold serially diluted antibody in PBS or plasma from vaccinees at a dilution of 1:10 was added and incubated at 37 °C for 1.5 h. The plate was washed with PBST for three times. The anti-Flag-HRP (Sigma-Aldrich) was used for detection of n3130v and n3113v and anti-Fab-HRP (Sigma-Aldrich) for IgG antibody (S309, CB6, P2B-2F6, CR3022) and plasma. The plate was washed with PBST for five times and the absorbance at 405 nm was measured after incubation with ABTS substrate (Invitrogen) for 10 min. The data was plotted using Graphpad Prism and the antibody concentration or plasma dilution was transformed into log[concentration]/[dilution] for four parameters nonlinear regression fitting. The EC 50 (concentration for 50% of maximal effect) and ED 50 (median effective dose) were calculated. Bio-layer interferometry (BLI) binding assay The binding kinetics of antibodies to RBD were measured by BLI on an Octet-RED96 (ForteBio). The RBD with an AviTag on C terminal was biotinylated by BirA biotin-protein ligase following the manufacturer’s protocol (Avidity). The his-tagged RBD and biotinylated RBD at 10 μg/mL was loaded onto Ni-NTA and streptavidin-coated (SA) biosensors, respectively. Then the antigen immobilized sensors were incubated with three-fold serially diluted antibodies starting at 333 nM in PBST for 300 s for association, and then immersed into PBST for another 300 s at 30 °C. All the curves were fitted by 1:1 binding model using the Data Analysis software 10.0. K D values were determined with R 2 values of greater than 95% confidence level. For the binding-competition assay, the RBD immobilized sensors were incubated with the first antibody until saturation, and then the biosensors were immersed into the second antibody for the same time. Measurement of RBD binding antibodies, RBM binding antibodies, and non-RBM binding antibodies in vaccinee plasma by BLI The SA biosensors immobilized with biotin-labeled RBD were incubated with plasma and the signal represented RBD binding antibodies. To further determine the RBM binding antibodies and non-RBM binding antibodies, the competition assay was performed. The SA biosensors loaded with RBD were immersed into 200 nM ACE2 (Novoprotein) until the binding curve reaching saturation, confirming that the RBM of RBD was occupied by ACE2. After that, the complex was incubated 1:50 diluted plasma mixed with 200 nM ACE2. The binding signal indicated that antibodies bind to other regions on RBD except RBM region. The RBM antibodies were determined by RBD antibodies minus non-RBM antibodies. Spearman’s rank correlation test was applied to measure the correlation between plasma neutralization ID 50 against Omicron with the RBM antibodies or non-RBM antibodies.
Construction of plasmids encoding
SARS-CoV-2 spike protein of various variants for pseudovirus neutralization assay
The gene encoding Omicron S protein was purchased from Genscript and then subcloned into pcDNA3.1 vector. To generate the plasmid encoding SARS-CoV-2 spike protein of various variants (Alpha, Beta, Gamma, and Delta), the site-directed mutagenesis was performed by a QuickMutation™ Site-Directed Mutagenesis Kit (Beyotime Biotechnology). The vector pcDNA3.1 encoding S protein of SARS-CoV-2 from Wuhan-Hu-1 strain (GenBank: MN_908947) was generated and served as template. Firstly, two complementary primers containing the desired mutation were designed.
Following site-directed mutagenesis
PCR, mutated plasmid was amplified with staggered nicks and Dpn I restriction endonuclease (NEB) was added to digest the parental vector for about 3 hours at 37°C. Afterwards, the PCR products including nicked vector with the desired mutations were directly transformed into DH5α competent cells. The mutation was verified by DNA sequencing. Establishment and validation of a panel of SARS-CoV-2 pseudovirus Plasmids encoding spike protein of WT and various variants in pcDNA3.1 vector and luciferase reporter-expressing HIV-1 backbone in pNL4-3.luc.RE were 1:1 co-transfected into 293 T cells. After 8 hours, the culture medium was replaced with fresh DMEM medium and the cells were cultured for additional 48 hours. The supernatant containing pseudoviruses were harvested by centrifugation at 3500 rpm/min for 5 minutes and filtered by 0.45 μm pore size filter before stored at −80°C in aliquots for use. Ten-fold serially diluted pseudoviruses were used to infect Huh-7 cells for 12 hours. The supernatant was refreshed 12 hours post-infection and cells were cultured by an additional 48 hours. The luciferase activity was recorded to determine the infectivity of pseudovirus.
Pseudovirus neutralization assay
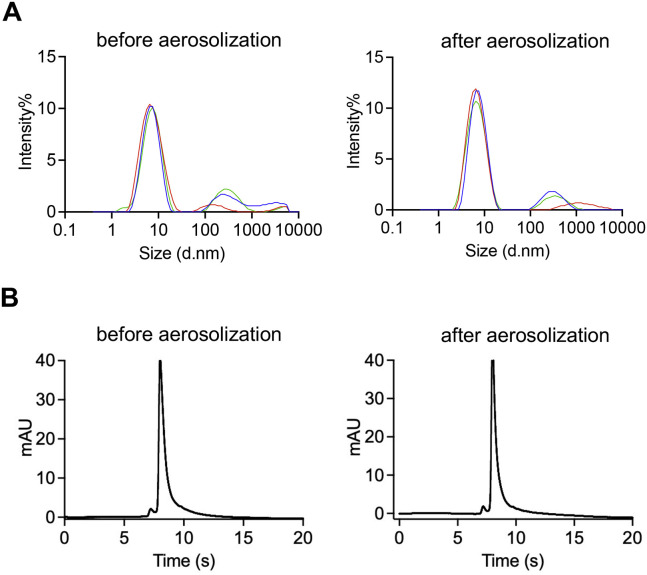
Huh-7 cells at density of 10,000 per well were coated in 96-well cell culture plate overnight to form monolayer adhered cells. According to the pseudo-viral infectivity determine assay mentioned above, viral dilution of relative light unit (RLU) at around 30,000 was used. Three-fold serially diluted antibody or vaccinated plasma was mixed with pseudovirus at ratio of 1:1 for 1 h at 37 °C. The mixture was added and incubated with Huh-7 cells for 12 hours, followed by refresh of the culture medium with fresh DMEM supplied with 10% FBS. The cells were incubated for another 48 hours, washed with PBS for two times, and subsequently lysed with 50 μL of lysis reagent (Promega). 30 μL of cell lysates were added into the substrate of Firefly Luciferase Assay Kit (Promega) and the RLU readout was detected. Percent of inhibition was calculated as relative reduction of RLU compared with the control well (add cells and pseudovirus, without antibody). Data were non-linear fitted and ID 50 was calculated by the equation of four parameters regression using GraphPad Prism. Determination of antibody homogeneity by analytical size exclusion chromatography (SEC) 100 μg of antibodies in 500 μL of injection volume was chromatographed onto the Superdex™ 200 10/300 GL on AKTA purifier (GE Healthcare). The flow rate was 0.5 mL/min and the system alarm pressure was 3 MPa. Absorbance at 280 nm was monitored. Molecular mass determination was calculated by reference to a protein standard mix (Sigma-Aldrich). Reduced and non-reduced PAGE For denaturing SDS-PAGE, 10 μL of protein sample (25 μg protein) were mixed with 2.5 μL of 5× sample loading buffer (Yeasen) and heated at 100 °C for 10 min. For non-reduced PAGE, 25 μg of protein samples were mixed with 2.5 μL of 5× no denaturing protein loading buffer (Yeasen). These samples were then loaded into precast 4%-12% gradient gels (Yeasen) with 8 μL of pre-stained SDS-PAGE Standards. Electrophoresis was performed at room temperature for approximately 60 min using a constant voltage (150 V) in running buffer until the dye front reached the end of the gel. The gels were stained using Coomassie Brilliant Blue (Yeasen) and imaged. Dynamic light scattering (DLS) For comparison of aggregation tendency of bn 03 before and after aerosolization by microsprayer aerosolizer (YUYANBIO), the bn03 was filtered through a 0.22-μm filter (Millipore) and adjusted to the concentration (1 mg/mL). After aerosolization, the aerosol was collected and measured using a Zetasizer Nano ZSZEN 3600 (Malvern Instruments Limited) to determine the size of protein particles. The samples (0.2 mL) were analyzed in polystyrene cuvettes at 25°C. Each sample was recorded three times with seven sub runs of 10 s. Ultra-high-performance liquid chromatography electrospray ionization quadrupole time of flight mass spectrometry (HPLC-ESI-Q-TOF MS) analysis The molecular size of bn03 was analyzed using an ultra-high performance liquid chromatography (UHPLC) system coupled with a quadrupole time-of-flight mass spectrometry (QTOF-MS) Xevo G2-XS QTOF from Waters equipped with an electrospray ionization (ESI) source operating in positive mode. Briefly, deglycosylated bn03 at a volume of 5 μL was injected by an auto sampler on a ACQUITY UPLC Protein BEH SEC column (200Å, 1.7 μm, 4.6 × 300 mm) for separation. Solvent A and B were water and acetonitrile with 0.1% formic acid, respectively. The gradient expressed as the solvent A ratio was as follows: 0 min, 95% A; 2 min, 95% A; 5 min, 5% A;9 min, 5% A; and 9.1 min, 95% A. The flow rate was 0.4 mL/min. Thereafter, bn03 was identified by ESI-MS under the following conditions: capillary voltage, 3 KV; nebulizer pressure, 40 psi; drying gas flow rate, 10 L/min; gas temperature, 450 °C; fragmentor voltage, 200 V. Size-exclusion-high-performance liquid chromatography (SEC-HPLC) Fifty μg of bn03 were applied to a TSK-Gel Super SW3000 (TSK-GEL) using Waters AQUITY UPLC H-class system. The mobile phase was PBS buffer (pH 7.4) run at a flow rate of 0.4 mL/min. Absorbance was monitored at 280 nm. The UV trace was analyzed and integrated by area under the curve to determine percent aggregation, monomer and degradants.
Expression and purification of SARS-CoV-2 Omicron Spike
The human-optimized codon gene encoding SARS-CoV-2 Omicron S ectodomain was purchased from GenScript. HexaPro mutations, “GSAS” substitution at furin cleavage site (residues 682-285) and a C-terminal T4 fibritin trimerization motif were introduced into the gene by MultiS one step cloning kit (Vazyme). The gene was then inserted into the mammalian expression vector pcDNA3.1 with a TwinStrepTag, and an 8×HisTag at C-terminal. The expression plasmid was transiently transfected into suspension HEK293F by polyethylenimine. After 72 hours, the supernatants were harvested and filtered for affinity purification by Histrap HP (GE Healthcare). The protein was then further purified by gel filtration using Superose 6 increase 10/300 column (GE Healthcare) in 20 mM Tris pH 8.0, 200 mM NaCl.
Cryo-EM sample preparation Purified SARS-CoV-2 Omicron
S at 0.5 mg/mL was mixed with bn03 antibody by a molar ratio of 1:2 and incubated for 10 min on ice. A 3 μL aliquot of the sample was loaded onto a freshly glow-discharged holey amorphous nickel-titanium alloy film supported by 400 mesh gold grids, with microarray pattern similar like the commercial Quantifoil 1.2/1.3 grid. The sample was vitrified in liquid ethane using Vitrobot IV (FEI/ThermoFisher), with 2 s blot time and -3 blot force and 10 s wait time.
Cryo-EM data collection and image processing
Cryo-EM data were collected on a Titan Krios microscope (ThermoFisher) operated at 300 kV, equipped with K3 summit direct detector (Gatan) and GIF energy filter (Gatan BioQuantum 967) setting to a slit width of 20 eV. Automated data acquisition was carried out with SerialEM software through beam-image shift method. Movies were taken in the super-resolution mode at a nominal magnification 81,000×, corresponding to a physical pixel size of 1.064 Å, and a defocus range from -1.2 μm to -2.5 μm. Each movie stack was dose-fractionated to 40 frames with a total exposure dose of about 58 e − /Å 2 and exposure time of 3 s. All the data processing was carried out using either modules on, or through, RELION v3.0 and cryoSPARC. A total of 4,336 movie stacks was binned 2 × 2, dose weighted, and motion corrected using MotionCor2 within RELION. Parameters of contrast transfer function (CTF) were estimated by using Gctf. All micrographs then were manually selected for further particle picking upon ice condition, defocus range and estimated resolution. Remaining 3,529 good images were imported into cryoSPARC for further patched CTF-estimating, blob-picking and 2D classification. Several good 2D classes were used as templates for template-picking. After 2D classification of particles from template-picking was finished, all good particles from blob-picking and template-picking were merged and deduplicated, subsequently being exported back to RELION through pyem package and re-extracted with binning by 2 (2.128 Å/pixel). After getting an initial-model from cryoSPARC as reference, all 682,853 particles were carried on 1 round of 3D classification in RELION. At this step, two kinds of conformational change could be observed. Then different classes were selected separately by conformational change and last 4 iterations of particles were selected, merged and deduplicated. Another round of 3D classification was carried out to get more certain particles of their own conformation. At last, 534,947 particles of spike protein with two RBD domains up (2-up) were re-extracted unbinned (1.064 Å/pixel) and auto-refined, then CTF-refined and polished, yielding a map at 2.81 Å. Meanwhile, 281,917 particles of spike protein with only one RBD domains up (state1) yielded a map at 2.99 Å through the same procedure. In the 2-up structure, one of the up RBDs was well-resolved, the other up-RBD is more flexible and less well-resolved relative to the rest of the spike protein. Thus, we carried out no-alignment 3D classification with the mask of this up-RBD and its neighboring NTD and nanobody (NTD_RBD_Nanobody, shortly for NRN). We got one class that contains two single-domain antibodies on this up-RBD and another two good classes contains one single-domain antibody on the RBD. These three classes of two conformations were refined with the mask of entire density. Finally, 294,267 particles yielded a 2-up map at 2.93 Å with 5 single-domain antibodies on it, and 170,469 particles yielded a 2-up map at 3.01 Å with 4 single-domain antibodies on it. Furthermore, to get clearer insight of two single-domain antibodies combining on the well-resolved up RBD, we used local-refine strategy to further improve the density of the two single-domain antibodies. That is, the certain particle signal of NRN from this up RBD was subtracted from these 534,947 refined particles. Then local 3D-classification was executed and one good class containing 150,802 particles was local-refined, yielding a 3.34 Å map, which includes two rather improved single-domain antibodies. In the 1-up structure, the density of bn03 was missed too much. Thus, we carried out no-alignment 3D classification with the mask of entire density to further classify the particles. We got one good class that contains relatively complete single-domain antibodies. This class containing 78,485 particles went on auto-refinement and yielded a 1-up map at 3.27 Å with 3 bn03 on it. The reported resolutions above are all based on the gold-standard Fourier shell correlation (FSC) 0.143 criterion. All the visualization and evaluation of 3D density maps were performed with UCSF Chimera. These sharpened maps were generated by DeepEMhancer and then “vop zflip” to get the correct handedness in UCSF Chimera for subsequent model building and analysis.
Model building and refinement
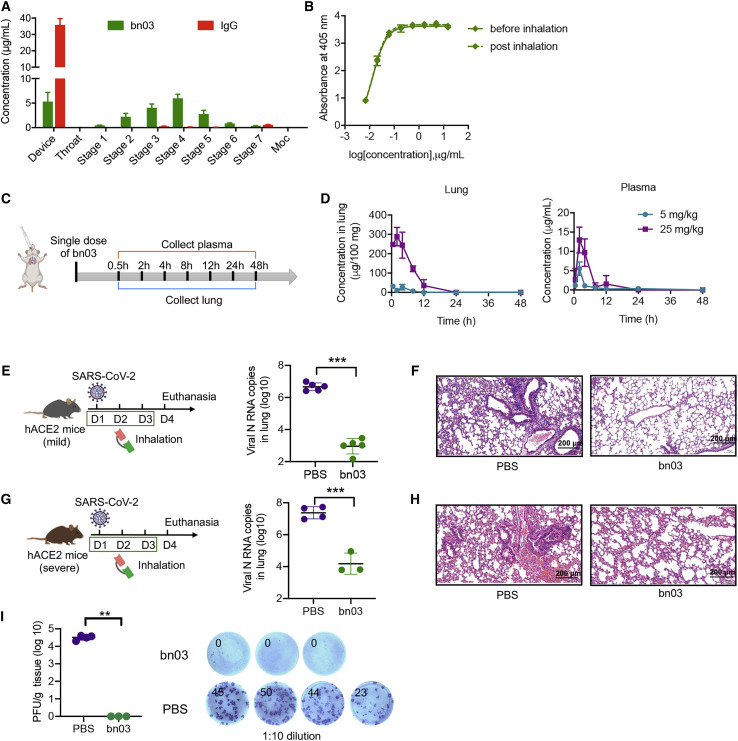
For model building of SARS-CoV-2 Omicron S trimer-bn03 complex, the SARS-CoV-2 D614G S trimer model and the nanobody model generated by swiss-model were fitted into the map using UCSF Chimera and then manually adjusted with COOT. COOT was used to introduce the mutations and adding glycans at N-linked glycosylation sites. Several iterative rounds of real-space refinement were further carried out in PHENIX. The RBD domain bounded with two single-domain antibodies was refined against the local refinement map and then docked back into the into global refinement trimer maps. Model validation was performed using MolProbity. Figures were prepared using UCSF Chimera and UCSF ChimeraX. Aerodynamic particle size measured by Next Generation Impactor To determine the size distribution of the aerosol antibodies, we used the NGI (Copley Scientific) to analyze the aerodynamic parameters of antibodies according the USP monograph. There are seven-stage droplets collectors representing different cutoff diameters of collected particles in the NGI located in its bottom frame. 2 mg/mL bispecific single-domain antibody bn03 and IgG were aerosolized and deposited on different collection cups at ambient room conditions within 5 s. Specifically, after the assembly was set up and airtight checked followed by vacuum pump running at the constant flow rates of 15 L/min, the antibody solution was added and fired into the cascade impactor immediately. Droplets of each collection plate was washed and collected by PBS, and then the components were dried up before next experiment. The concentration of IgG in collected solution was quantified by ELISA according to the corresponding standard curve fitted by four parameter nonlinear regression. For the bispecific antibody bn03, the concentration was determined by GatorPlus (Gator Bio). In brief, Ni-NTA biosensors immobilized with his-tagged RBD was immersed into serially diluted purified bn03 to obtain a dose-dependent binding curves and the standard curve is conducted by binding signal versus antibody concentration utilizing linear fitting. Then, the antibody concentrations were calculated from the standard curve.
Bio-distribution of single-domain antibody by inhalation and intraperitoneal injection
Single-domain antibody n3113v labeled by DyLight 800 antibody Labeling Kit (ThermoFisher) at 12 mg/kg was administrated through inhalation or intraperitoneal injection. The single-domain antibody was administrated through intratracheal route using microsprayer aerosolizer (YUYANBIO). Briefly, before performing trachea cannula, mice mouth was opened up by the laryngoscope to visualize the porch of the trachea. The tip syringe of high-pressure microsprayer was gently fed into the main trachea, and the aerosols were delivered quickly. Mice were imaged at different time-points (0.5 h, 1 h, 1.5 h, 2 h, 2.5 h, 4 h, 6 h) and the fluorescence radiance was captured by IVIS Lumina K Series III (PerkinElmer) at Ex/Em 780 nm/845 nm. At 4 hours and 6 hours post antibody administration, mice were sacrificed and organs were collected for fluorescence imaging. The pharmacokinetic of single-domain antibody in mice by inhalation and intraperitoneal injection For bn03, 5 mg/kg and 25 mg/kg bn03 were inhaled and administrated into mice using microsprayer aerosolizer. The single-domain antibody n3113v were administrated by inhalation and intraperitoneal injection at a dose of 12 mg/kg. After antibody administration, two mice were sacrificed to collect lung and plasma at indicated time-points ( Figure 6 C). The lung was weighed, homogenized and then centrifuged at 12,000 rpm. The supernatant was harvested and stored at -80 °C for further quantified. Antibody concentration in plasma and lung was determined by ELISA. In brief, SARS-CoV-2 RBD at 100 ng per well was coated in 96 well half-area microplate (Corning #3690) over night at 4 °C. The antigen coated plate was blocked with PBS containing 5% BSA for 1 h at 37 °C and washed by three times of PBST (PBS with 0.05% Tween 20). 50 μL of mice plasma or lung homogenate in PBS at a dilution of 1:100 was added for binding at 37 °C for 1.5 h. The plate was washed with PBST for three times and incubated with anti-Flag-HRP (Sigma-Aldrich) for 45 min at 37 °C. The plate was washed with PBST for five times and the enzyme activity was measured by recording the absorbance at 405 nm after incubation with ABTS substrate (Invitrogen) for 10 min. Gradient serially diluted purified antibodies were used to generate quantitative standard curve and fitted by a four-parameter logistic model. The antibody concentration in lung and plasma was calculated from the standard curve. Therapeutic efficacy of antibodies in the mouse model of SARS-CoV-2 infection Twelve hACE2 transgenic mice (B6/JGpt-Ace2 em1Cin(hACE2-stop) /Gpt) were purchased from GemPharmatech and randomly divided into three groups, inhalation group (INH), intraperitoneal group (IP) and negative control group (Control), respectively. All mice were inoculated intranasally with 1.16 × 10 5 plaque-forming unit (PFU) SARS-CoV-2 viruses under anesthesia to minimize animal suffering. Two hours post infection, mice were intraperitoneally treated with 12.5 mg/kg n3113v, or inhaled with 12.5 mg/kg n3113v once a day for three days. Animals were sacrificed at 4 dpi (days post infection) and lung tissues were harvested for viral load and histology analysis. To evaluated the efficacy of bispecific single-domain antibody bn03 in the mouse model of SARS-CoV-2 infection, two types of hACE2-transgenic mice with different hACE2 expressing level were used. The hACE2 mice purchased from GemPharmatech (B6/JGpt-Ace2 em1Cin(hACE2-stop) /Gpt) were inoculated intranasally with 1.16 × 10 5 PFU SARS-CoV-2 viruses to mimic the mild infection model. In contrast, CAG-hACE2-IRES-Luc-Tg transgenic mice (Shanghai Model Organisms Center), expressing high level of hACE2 and more sensitive to SARS-CoV-2 infection, were used as the severe infection model and inoculated intranasally with 1.16 × 10 4 PFU SARS-CoV-2 viruses two hours before treatment. Viral challenge was operated under anesthesia to minimize animal suffering. Mice were randomly divided into two groups, of which one group received intranasal inhalation of bn03 at 12.5 mg/kg (bn03 group) and the other one received PBS as control (PBS group) for three days. Animals were sacrificed at 4 dpi and lung tissues were harvested for viral load and histology analysis.
Determination of viral titer by qRT-PCR
Briefly, the lung tissue was collected and homogenized by electric homogenizer in Trizol. After centrifugation, the total RNA was extracted from the supernatant by chloroform and isopropanol and reverse-transcribed into cDNA. RNAs were quantitated by qRT-PCR kit (TianGen) in triplicates utilizing SARS-CoV-2 specific primers that target a conserved region in necleocapsid (N) gene of SARS-CoV-2. The SARS-CoV-2 N gene was cloned into a pcDNA3.1 expression plasmid and in vitro transcribed to obtain RNAs for standards. Indicated copies of N standards were 10-fold serially diluted and proceeded to qRT-PCR to obtain standard curves. Focus-forming assay 10-fold serially diluted lung homogenate was inoculated with monolayer Vero E6 cells in 96-well plate for 1.5 hours followed by the overlay of methylcellulose for 48 h at 37 °C. Cells were fixed with 4% paraformaldehyde for 30 min at 4 °C. The supernatant was removed and the plate was immersed into perm wash buffer with saponin. The cells were permeabilized by 0.2% triton for 15 min, followed by adding of 1:2000 diluted rabbit anti-SARS-CoV nucleocapsid antibody (Rockland) for 3 h at room temperature. The plate was washed by PBS for 2 times and the secondary goat anti-rabbit-HRP antibody was added and incubated for 3 h at room temperature. After washed with PBS for 2 times, TrueBlue substrate was added and the foci was visualized presented as the blue spot.
Quantification and statistical analysis
The results on binding ability of antibody to RBD and antibody concentration are presented as the mean values from two independent experiments. Neutralization titer is presented as the geometric mean of the IC 50 values calculated using four-parameter logistic regression from three independent experiments. The viral load is presented as the mean values from three duplicates on a single experiment. Error bars are defined as standard deviation (SD). All data were conducted using Prism software (version 8, GraphPad Software). Statistical significance was analyzed by Student’s t-test, one-way analysis of variance (ANOVA) with Tukey’s multiple comparisons test and spearman’s rank correlation test using Prism software (version 8, GraphPad Software).
Materials availability
All requests for resources and reagents should be directed to the lead contact author. This includes mice and viruses. All reagents will be made available on request after completion of a Materials Transfer Agreement.
Experimental model and subject details Human Specimen
This study included seven volunteers from Fudan University. The participants aged from 24 to 37 consist of 6 females and one male. All participants have received three doses of SARS-CoV-2 inactivated vaccine. Blood samples were collected three weeks after the third dose. All volunteers signed informed consent forms and protocols were approved by the Ethics Committee of the School of Basic Medical Sciences at Fudan University.
Animals
Pathogen-free, male hACE2 mice were purchased from GemPharmatech (B6/JGpt-Ace2 em1Cin(hACE2-stop) /Gpt) to mimic the mild infection model. Pathogen-free, male CAG-hACE2-IRES-Luc-Tg transgenic mice, expressing high level of hACE2 and more sensitive to SARS-CoV-2 infection were purchased from Shanghai Model Organisms Center to mimic sever infection model. The mice used in this study were 8-10 weeks old and well fed in BSL-3 labs for several days to adapt to the environment before performing experiments. Mice were randomly allocated to each group and all animal studies were performed in BSL-3 lab of Fudan University. Cells Vero E6 cells and 293 T cells were obtained from the American Type Culture Collection (ATCC), Huh-7 cells were obtained from Cell Bank of the Chinese Academy of Sciences (Shanghai, China). Cells were cultured in Dulbecco’s modified Eagle’s medium (DMEM) supplemented with 10% fetal bovine serum (FBS) in 37°C, 5% CO 2 atmosphere. Authentic SARS-CoV-2 virus The authentic SARS-CoV-2 virus hCoV-SH01 used in the focus-forming assay was obtained from Shanghai Medical College and stored at -80°C in a BSL-3 laboratory (Fudan University). Ethics statements All the procedures related to animal handling, care, and the treatment were performed and approved by the Ethics Committee of the School of Basic Medical Sciences at Fudan University in accordance with the recommendations in the Guide for the Care and Use of Laboratory Animals of Fudan University. The authentic SARS-CoV-2 infection and sample collection were performed in BSL-3 lab of Fudan University.
Method details Antibody footprint analysis The SARS-CoV-2 spike structure from PDB (PDB entry 7VND) was used for displaying mutations within Omicron and epitope footprints of antibodies. The structures of RBD in complex with CB6 (PDB entry 7C01), B38 (PDB entry 7BZ5), CC12.1 (PDB entry 6XC2), CC12.3 (PDB entry 6XC4), C102 (PDB entry 7K8M), REGN10933 (PDB entry 6XDG), P2B-2F6 (PDB entry 7BWJ), LY-CoV555 (PDB entry 7KMG), S2E12 (PDB entry 7K45), n3113 (PDB entry 7VNB), COVA1-16 (PDB entry 7JMW), CR3022 (PDB entry 6W41) and spike in complex with C105 (PDB entry 6XCM), BD23 (PDB entry 7BYR), 5A6 (PDB entry 7KQB), S309 (PDB entry 6WS6), C135 (PDB entry 7K8Z), 47D11 (PDB entry 7KAJ), EY6A (PDB entry 6ZDH), 3D11 (PDB entry 7KQE) were used to analyze the antibody epitopes. Interface residues were identified by ePISA ( http://www.ebi.ac.uk/pdbe/prot_int/pistart.html ) using default parameters and checked in COOT. The graphs were drawn using PyMoL or ChimeraX.
Protein expression and purification
The sequences of single-domain antibody n3130v, n3113v and bn03 were cloned into pComb3x vector with N-terminal OmpA signal peptide (MKKTAIAIAVALAGFATVAQA) and C-terminal hexahistidine and Flag tag and was expressed in E.coli HB2151. Bacteria transformed with expression plasmid was amplified to express antibody at 30°C for 12 h under the induction of IPTG. The bacteria were pelleted, resuspended in phosphate buffered saline (PBS) buffer and disrupted by ultrasonication, followed by centrifugation at 17,000 rpm for 30 minutes. The supernatant of n3113v was purified by Ni-NTA (Yeasen) and n3130v, and bispecific single-domain antibodies (bn01-04) were purified by Protein A resin (GenScript) following the manufacture’s instruction. The light chain and heavy chain of S309, CB6, P2B-2F6, CR3022 were subcloned into pTT expression vector digested by Sfi I in IgG1 format. These IgG antibodies were expressed by Expi293 cells and purified by Protein G (GenScript). Protein integrity was analyzed by sodium dodecyl-sulfate polyacrylamide gel electrophoresis (SDS-PAGE). Wildtype RBD (WT) was produced and stored in our laboratory. His-tagged Omicron RBD was purchased from AcroBiosystems and other RBD variants (include Alpha, Beta, Gamma, Delta) were purchased from Sino Biological Inc. Enzyme-linked immunosorbent assay (ELISA) His-tagged WT and Omicron RBD at 100 ng per well was coated in 96 well half-area microplate (Corning #3690) over night at 4 °C. The antigen coated plate was blocked with PBS containing 5% bovine serum albumin (BSA) for 1 h at 37 °C and washed by three times of PBST (PBS with 0.05% Tween 20). 50 μL of three-fold serially diluted antibody in PBS or plasma from vaccinees at a dilution of 1:10 was added and incubated at 37 °C for 1.5 h. The plate was washed with PBST for three times. The anti-Flag-HRP (Sigma-Aldrich) was used for detection of n3130v and n3113v and anti-Fab-HRP (Sigma-Aldrich) for IgG antibody (S309, CB6, P2B-2F6, CR3022) and plasma. The plate was washed with PBST for five times and the absorbance at 405 nm was measured after incubation with ABTS substrate (Invitrogen) for 10 min. The data was plotted using Graphpad Prism and the antibody concentration or plasma dilution was transformed into log[concentration]/[dilution] for four parameters nonlinear regression fitting. The EC 50 (concentration for 50% of maximal effect) and ED 50 (median effective dose) were calculated. Bio-layer interferometry (BLI) binding assay The binding kinetics of antibodies to RBD were measured by BLI on an Octet-RED96 (ForteBio). The RBD with an AviTag on C terminal was biotinylated by BirA biotin-protein ligase following the manufacturer’s protocol (Avidity). The his-tagged RBD and biotinylated RBD at 10 μg/mL was loaded onto Ni-NTA and streptavidin-coated (SA) biosensors, respectively. Then the antigen immobilized sensors were incubated with three-fold serially diluted antibodies starting at 333 nM in PBST for 300 s for association, and then immersed into PBST for another 300 s at 30 °C. All the curves were fitted by 1:1 binding model using the Data Analysis software 10.0. K D values were determined with R 2 values of greater than 95% confidence level. For the binding-competition assay, the RBD immobilized sensors were incubated with the first antibody until saturation, and then the biosensors were immersed into the second antibody for the same time. Measurement of RBD binding antibodies, RBM binding antibodies, and non-RBM binding antibodies in vaccinee plasma by BLI The SA biosensors immobilized with biotin-labeled RBD were incubated with plasma and the signal represented RBD binding antibodies. To further determine the RBM binding antibodies and non-RBM binding antibodies, the competition assay was performed. The SA biosensors loaded with RBD were immersed into 200 nM ACE2 (Novoprotein) until the binding curve reaching saturation, confirming that the RBM of RBD was occupied by ACE2. After that, the complex was incubated 1:50 diluted plasma mixed with 200 nM ACE2. The binding signal indicated that antibodies bind to other regions on RBD except RBM region. The RBM antibodies were determined by RBD antibodies minus non-RBM antibodies. Spearman’s rank correlation test was applied to measure the correlation between plasma neutralization ID 50 against Omicron with the RBM antibodies or non-RBM antibodies.
Construction of plasmids encoding
SARS-CoV-2 spike protein of various variants for pseudovirus neutralization assay
The gene encoding Omicron S protein was purchased from Genscript and then subcloned into pcDNA3.1 vector. To generate the plasmid encoding SARS-CoV-2 spike protein of various variants (Alpha, Beta, Gamma, and Delta), the site-directed mutagenesis was performed by a QuickMutation™ Site-Directed Mutagenesis Kit (Beyotime Biotechnology). The vector pcDNA3.1 encoding S protein of SARS-CoV-2 from Wuhan-Hu-1 strain (GenBank: MN_908947) was generated and served as template. Firstly, two complementary primers containing the desired mutation were designed.
Following site-directed mutagenesis
PCR, mutated plasmid was amplified with staggered nicks and Dpn I restriction endonuclease (NEB) was added to digest the parental vector for about 3 hours at 37°C. Afterwards, the PCR products including nicked vector with the desired mutations were directly transformed into DH5α competent cells. The mutation was verified by DNA sequencing. Establishment and validation of a panel of SARS-CoV-2 pseudovirus Plasmids encoding spike protein of WT and various variants in pcDNA3.1 vector and luciferase reporter-expressing HIV-1 backbone in pNL4-3.luc.RE were 1:1 co-transfected into 293 T cells. After 8 hours, the culture medium was replaced with fresh DMEM medium and the cells were cultured for additional 48 hours. The supernatant containing pseudoviruses were harvested by centrifugation at 3500 rpm/min for 5 minutes and filtered by 0.45 μm pore size filter before stored at −80°C in aliquots for use. Ten-fold serially diluted pseudoviruses were used to infect Huh-7 cells for 12 hours. The supernatant was refreshed 12 hours post-infection and cells were cultured by an additional 48 hours. The luciferase activity was recorded to determine the infectivity of pseudovirus.
Pseudovirus neutralization assay
Huh-7 cells at density of 10,000 per well were coated in 96-well cell culture plate overnight to form monolayer adhered cells. According to the pseudo-viral infectivity determine assay mentioned above, viral dilution of relative light unit (RLU) at around 30,000 was used. Three-fold serially diluted antibody or vaccinated plasma was mixed with pseudovirus at ratio of 1:1 for 1 h at 37 °C. The mixture was added and incubated with Huh-7 cells for 12 hours, followed by refresh of the culture medium with fresh DMEM supplied with 10% FBS. The cells were incubated for another 48 hours, washed with PBS for two times, and subsequently lysed with 50 μL of lysis reagent (Promega). 30 μL of cell lysates were added into the substrate of Firefly Luciferase Assay Kit (Promega) and the RLU readout was detected. Percent of inhibition was calculated as relative reduction of RLU compared with the control well (add cells and pseudovirus, without antibody). Data were non-linear fitted and ID 50 was calculated by the equation of four parameters regression using GraphPad Prism. Determination of antibody homogeneity by analytical size exclusion chromatography (SEC) 100 μg of antibodies in 500 μL of injection volume was chromatographed onto the Superdex™ 200 10/300 GL on AKTA purifier (GE Healthcare). The flow rate was 0.5 mL/min and the system alarm pressure was 3 MPa. Absorbance at 280 nm was monitored. Molecular mass determination was calculated by reference to a protein standard mix (Sigma-Aldrich). Reduced and non-reduced PAGE For denaturing SDS-PAGE, 10 μL of protein sample (25 μg protein) were mixed with 2.5 μL of 5× sample loading buffer (Yeasen) and heated at 100 °C for 10 min. For non-reduced PAGE, 25 μg of protein samples were mixed with 2.5 μL of 5× no denaturing protein loading buffer (Yeasen). These samples were then loaded into precast 4%-12% gradient gels (Yeasen) with 8 μL of pre-stained SDS-PAGE Standards. Electrophoresis was performed at room temperature for approximately 60 min using a constant voltage (150 V) in running buffer until the dye front reached the end of the gel. The gels were stained using Coomassie Brilliant Blue (Yeasen) and imaged. Dynamic light scattering (DLS) For comparison of aggregation tendency of bn 03 before and after aerosolization by microsprayer aerosolizer (YUYANBIO), the bn03 was filtered through a 0.22-μm filter (Millipore) and adjusted to the concentration (1 mg/mL). After aerosolization, the aerosol was collected and measured using a Zetasizer Nano ZSZEN 3600 (Malvern Instruments Limited) to determine the size of protein particles. The samples (0.2 mL) were analyzed in polystyrene cuvettes at 25°C. Each sample was recorded three times with seven sub runs of 10 s. Ultra-high-performance liquid chromatography electrospray ionization quadrupole time of flight mass spectrometry (HPLC-ESI-Q-TOF MS) analysis The molecular size of bn03 was analyzed using an ultra-high performance liquid chromatography (UHPLC) system coupled with a quadrupole time-of-flight mass spectrometry (QTOF-MS) Xevo G2-XS QTOF from Waters equipped with an electrospray ionization (ESI) source operating in positive mode. Briefly, deglycosylated bn03 at a volume of 5 μL was injected by an auto sampler on a ACQUITY UPLC Protein BEH SEC column (200Å, 1.7 μm, 4.6 × 300 mm) for separation. Solvent A and B were water and acetonitrile with 0.1% formic acid, respectively. The gradient expressed as the solvent A ratio was as follows: 0 min, 95% A; 2 min, 95% A; 5 min, 5% A;9 min, 5% A; and 9.1 min, 95% A. The flow rate was 0.4 mL/min. Thereafter, bn03 was identified by ESI-MS under the following conditions: capillary voltage, 3 KV; nebulizer pressure, 40 psi; drying gas flow rate, 10 L/min; gas temperature, 450 °C; fragmentor voltage, 200 V. Size-exclusion-high-performance liquid chromatography (SEC-HPLC) Fifty μg of bn03 were applied to a TSK-Gel Super SW3000 (TSK-GEL) using Waters AQUITY UPLC H-class system. The mobile phase was PBS buffer (pH 7.4) run at a flow rate of 0.4 mL/min. Absorbance was monitored at 280 nm. The UV trace was analyzed and integrated by area under the curve to determine percent aggregation, monomer and degradants.
Expression and purification of SARS-CoV-2 Omicron Spike
The human-optimized codon gene encoding SARS-CoV-2 Omicron S ectodomain was purchased from GenScript. HexaPro mutations, “GSAS” substitution at furin cleavage site (residues 682-285) and a C-terminal T4 fibritin trimerization motif were introduced into the gene by MultiS one step cloning kit (Vazyme). The gene was then inserted into the mammalian expression vector pcDNA3.1 with a TwinStrepTag, and an 8×HisTag at C-terminal. The expression plasmid was transiently transfected into suspension HEK293F by polyethylenimine. After 72 hours, the supernatants were harvested and filtered for affinity purification by Histrap HP (GE Healthcare). The protein was then further purified by gel filtration using Superose 6 increase 10/300 column (GE Healthcare) in 20 mM Tris pH 8.0, 200 mM NaCl.
Cryo-EM sample preparation Purified SARS-CoV-2 Omicron
S at 0.5 mg/mL was mixed with bn03 antibody by a molar ratio of 1:2 and incubated for 10 min on ice. A 3 μL aliquot of the sample was loaded onto a freshly glow-discharged holey amorphous nickel-titanium alloy film supported by 400 mesh gold grids, with microarray pattern similar like the commercial Quantifoil 1.2/1.3 grid. The sample was vitrified in liquid ethane using Vitrobot IV (FEI/ThermoFisher), with 2 s blot time and -3 blot force and 10 s wait time.
Cryo-EM data collection and image processing
Cryo-EM data were collected on a Titan Krios microscope (ThermoFisher) operated at 300 kV, equipped with K3 summit direct detector (Gatan) and GIF energy filter (Gatan BioQuantum 967) setting to a slit width of 20 eV. Automated data acquisition was carried out with SerialEM software through beam-image shift method. Movies were taken in the super-resolution mode at a nominal magnification 81,000×, corresponding to a physical pixel size of 1.064 Å, and a defocus range from -1.2 μm to -2.5 μm. Each movie stack was dose-fractionated to 40 frames with a total exposure dose of about 58 e − /Å 2 and exposure time of 3 s. All the data processing was carried out using either modules on, or through, RELION v3.0 and cryoSPARC. A total of 4,336 movie stacks was binned 2 × 2, dose weighted, and motion corrected using MotionCor2 within RELION. Parameters of contrast transfer function (CTF) were estimated by using Gctf. All micrographs then were manually selected for further particle picking upon ice condition, defocus range and estimated resolution. Remaining 3,529 good images were imported into cryoSPARC for further patched CTF-estimating, blob-picking and 2D classification. Several good 2D classes were used as templates for template-picking. After 2D classification of particles from template-picking was finished, all good particles from blob-picking and template-picking were merged and deduplicated, subsequently being exported back to RELION through pyem package and re-extracted with binning by 2 (2.128 Å/pixel). After getting an initial-model from cryoSPARC as reference, all 682,853 particles were carried on 1 round of 3D classification in RELION. At this step, two kinds of conformational change could be observed. Then different classes were selected separately by conformational change and last 4 iterations of particles were selected, merged and deduplicated. Another round of 3D classification was carried out to get more certain particles of their own conformation. At last, 534,947 particles of spike protein with two RBD domains up (2-up) were re-extracted unbinned (1.064 Å/pixel) and auto-refined, then CTF-refined and polished, yielding a map at 2.81 Å. Meanwhile, 281,917 particles of spike protein with only one RBD domains up (state1) yielded a map at 2.99 Å through the same procedure. In the 2-up structure, one of the up RBDs was well-resolved, the other up-RBD is more flexible and less well-resolved relative to the rest of the spike protein. Thus, we carried out no-alignment 3D classification with the mask of this up-RBD and its neighboring NTD and nanobody (NTD_RBD_Nanobody, shortly for NRN). We got one class that contains two single-domain antibodies on this up-RBD and another two good classes contains one single-domain antibody on the RBD. These three classes of two conformations were refined with the mask of entire density. Finally, 294,267 particles yielded a 2-up map at 2.93 Å with 5 single-domain antibodies on it, and 170,469 particles yielded a 2-up map at 3.01 Å with 4 single-domain antibodies on it. Furthermore, to get clearer insight of two single-domain antibodies combining on the well-resolved up RBD, we used local-refine strategy to further improve the density of the two single-domain antibodies. That is, the certain particle signal of NRN from this up RBD was subtracted from these 534,947 refined particles. Then local 3D-classification was executed and one good class containing 150,802 particles was local-refined, yielding a 3.34 Å map, which includes two rather improved single-domain antibodies. In the 1-up structure, the density of bn03 was missed too much. Thus, we carried out no-alignment 3D classification with the mask of entire density to further classify the particles. We got one good class that contains relatively complete single-domain antibodies. This class containing 78,485 particles went on auto-refinement and yielded a 1-up map at 3.27 Å with 3 bn03 on it. The reported resolutions above are all based on the gold-standard Fourier shell correlation (FSC) 0.143 criterion. All the visualization and evaluation of 3D density maps were performed with UCSF Chimera. These sharpened maps were generated by DeepEMhancer and then “vop zflip” to get the correct handedness in UCSF Chimera for subsequent model building and analysis.
Model building and refinement
For model building of SARS-CoV-2 Omicron S trimer-bn03 complex, the SARS-CoV-2 D614G S trimer model and the nanobody model generated by swiss-model were fitted into the map using UCSF Chimera and then manually adjusted with COOT. COOT was used to introduce the mutations and adding glycans at N-linked glycosylation sites. Several iterative rounds of real-space refinement were further carried out in PHENIX. The RBD domain bounded with two single-domain antibodies was refined against the local refinement map and then docked back into the into global refinement trimer maps. Model validation was performed using MolProbity. Figures were prepared using UCSF Chimera and UCSF ChimeraX. Aerodynamic particle size measured by Next Generation Impactor To determine the size distribution of the aerosol antibodies, we used the NGI (Copley Scientific) to analyze the aerodynamic parameters of antibodies according the USP monograph. There are seven-stage droplets collectors representing different cutoff diameters of collected particles in the NGI located in its bottom frame. 2 mg/mL bispecific single-domain antibody bn03 and IgG were aerosolized and deposited on different collection cups at ambient room conditions within 5 s. Specifically, after the assembly was set up and airtight checked followed by vacuum pump running at the constant flow rates of 15 L/min, the antibody solution was added and fired into the cascade impactor immediately. Droplets of each collection plate was washed and collected by PBS, and then the components were dried up before next experiment. The concentration of IgG in collected solution was quantified by ELISA according to the corresponding standard curve fitted by four parameter nonlinear regression. For the bispecific antibody bn03, the concentration was determined by GatorPlus (Gator Bio). In brief, Ni-NTA biosensors immobilized with his-tagged RBD was immersed into serially diluted purified bn03 to obtain a dose-dependent binding curves and the standard curve is conducted by binding signal versus antibody concentration utilizing linear fitting. Then, the antibody concentrations were calculated from the standard curve.
Bio-distribution of single-domain antibody by inhalation and intraperitoneal injection
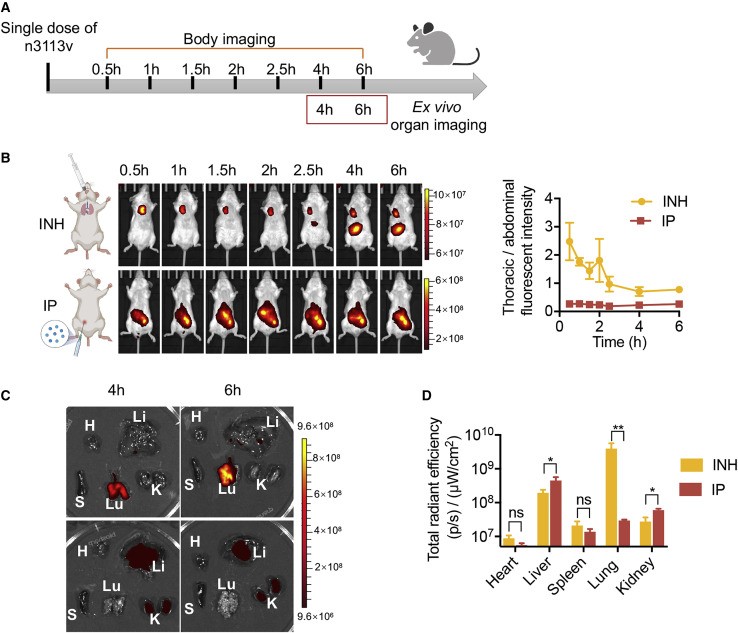
Single-domain antibody n3113v labeled by DyLight 800 antibody Labeling Kit (ThermoFisher) at 12 mg/kg was administrated through inhalation or intraperitoneal injection. The single-domain antibody was administrated through intratracheal route using microsprayer aerosolizer (YUYANBIO). Briefly, before performing trachea cannula, mice mouth was opened up by the laryngoscope to visualize the porch of the trachea. The tip syringe of high-pressure microsprayer was gently fed into the main trachea, and the aerosols were delivered quickly. Mice were imaged at different time-points (0.5 h, 1 h, 1.5 h, 2 h, 2.5 h, 4 h, 6 h) and the fluorescence radiance was captured by IVIS Lumina K Series III (PerkinElmer) at Ex/Em 780 nm/845 nm. At 4 hours and 6 hours post antibody administration, mice were sacrificed and organs were collected for fluorescence imaging. The pharmacokinetic of single-domain antibody in mice by inhalation and intraperitoneal injection For bn03, 5 mg/kg and 25 mg/kg bn03 were inhaled and administrated into mice using microsprayer aerosolizer. The single-domain antibody n3113v were administrated by inhalation and intraperitoneal injection at a dose of 12 mg/kg. After antibody administration, two mice were sacrificed to collect lung and plasma at indicated time-points ( Figure 6 C). The lung was weighed, homogenized and then centrifuged at 12,000 rpm. The supernatant was harvested and stored at -80 °C for further quantified. Antibody concentration in plasma and lung was determined by ELISA. In brief, SARS-CoV-2 RBD at 100 ng per well was coated in 96 well half-area microplate (Corning #3690) over night at 4 °C. The antigen coated plate was blocked with PBS containing 5% BSA for 1 h at 37 °C and washed by three times of PBST (PBS with 0.05% Tween 20). 50 μL of mice plasma or lung homogenate in PBS at a dilution of 1:100 was added for binding at 37 °C for 1.5 h. The plate was washed with PBST for three times and incubated with anti-Flag-HRP (Sigma-Aldrich) for 45 min at 37 °C. The plate was washed with PBST for five times and the enzyme activity was measured by recording the absorbance at 405 nm after incubation with ABTS substrate (Invitrogen) for 10 min. Gradient serially diluted purified antibodies were used to generate quantitative standard curve and fitted by a four-parameter logistic model. The antibody concentration in lung and plasma was calculated from the standard curve. Therapeutic efficacy of antibodies in the mouse model of SARS-CoV-2 infection Twelve hACE2 transgenic mice (B6/JGpt-Ace2 em1Cin(hACE2-stop) /Gpt) were purchased from GemPharmatech and randomly divided into three groups, inhalation group (INH), intraperitoneal group (IP) and negative control group (Control), respectively. All mice were inoculated intranasally with 1.16 × 10 5 plaque-forming unit (PFU) SARS-CoV-2 viruses under anesthesia to minimize animal suffering. Two hours post infection, mice were intraperitoneally treated with 12.5 mg/kg n3113v, or inhaled with 12.5 mg/kg n3113v once a day for three days. Animals were sacrificed at 4 dpi (days post infection) and lung tissues were harvested for viral load and histology analysis. To evaluated the efficacy of bispecific single-domain antibody bn03 in the mouse model of SARS-CoV-2 infection, two types of hACE2-transgenic mice with different hACE2 expressing level were used. The hACE2 mice purchased from GemPharmatech (B6/JGpt-Ace2 em1Cin(hACE2-stop) /Gpt) were inoculated intranasally with 1.16 × 10 5 PFU SARS-CoV-2 viruses to mimic the mild infection model. In contrast, CAG-hACE2-IRES-Luc-Tg transgenic mice (Shanghai Model Organisms Center), expressing high level of hACE2 and more sensitive to SARS-CoV-2 infection, were used as the severe infection model and inoculated intranasally with 1.16 × 10 4 PFU SARS-CoV-2 viruses two hours before treatment. Viral challenge was operated under anesthesia to minimize animal suffering. Mice were randomly divided into two groups, of which one group received intranasal inhalation of bn03 at 12.5 mg/kg (bn03 group) and the other one received PBS as control (PBS group) for three days. Animals were sacrificed at 4 dpi and lung tissues were harvested for viral load and histology analysis.
Determination of viral titer by qRT-PCR
Briefly, the lung tissue was collected and homogenized by electric homogenizer in Trizol. After centrifugation, the total RNA was extracted from the supernatant by chloroform and isopropanol and reverse-transcribed into cDNA. RNAs were quantitated by qRT-PCR kit (TianGen) in triplicates utilizing SARS-CoV-2 specific primers that target a conserved region in necleocapsid (N) gene of SARS-CoV-2. The SARS-CoV-2 N gene was cloned into a pcDNA3.1 expression plasmid and in vitro transcribed to obtain RNAs for standards. Indicated copies of N standards were 10-fold serially diluted and proceeded to qRT-PCR to obtain standard curves. Focus-forming assay 10-fold serially diluted lung homogenate was inoculated with monolayer Vero E6 cells in 96-well plate for 1.5 hours followed by the overlay of methylcellulose for 48 h at 37 °C. Cells were fixed with 4% paraformaldehyde for 30 min at 4 °C. The supernatant was removed and the plate was immersed into perm wash buffer with saponin. The cells were permeabilized by 0.2% triton for 15 min, followed by adding of 1:2000 diluted rabbit anti-SARS-CoV nucleocapsid antibody (Rockland) for 3 h at room temperature. The plate was washed by PBS for 2 times and the secondary goat anti-rabbit-HRP antibody was added and incubated for 3 h at room temperature. After washed with PBS for 2 times, TrueBlue substrate was added and the foci was visualized presented as the blue spot.
📊 Figures
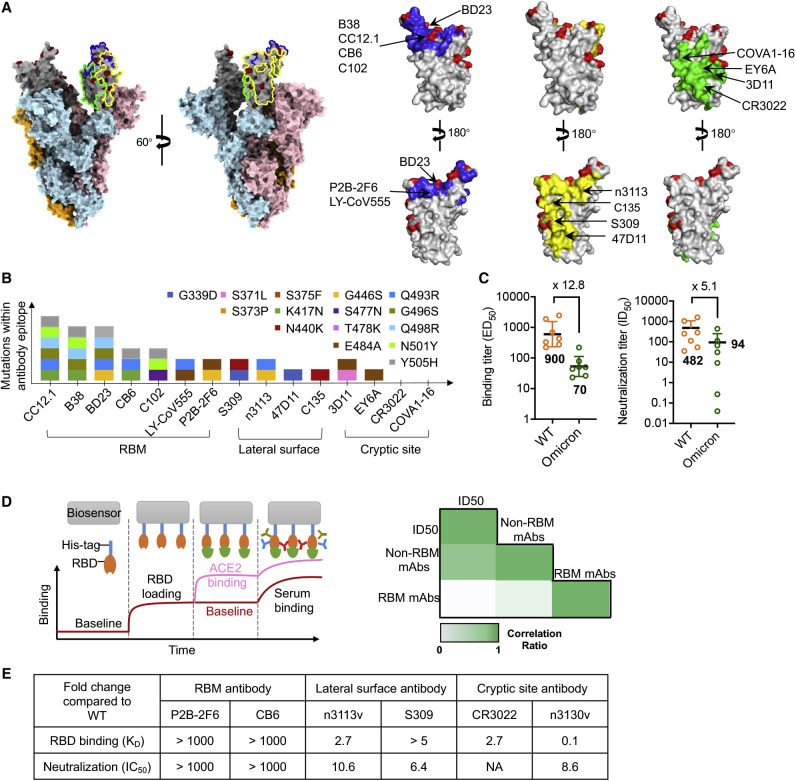
Figureu00a01
Non-RBM antibodies confer resistance against the SARS-CoV-2 Omicron variant (A) Epitope clustering of RBD-targeting antibodies on the spike protein and RBD. The Omicron S was shown as surface, with RB...
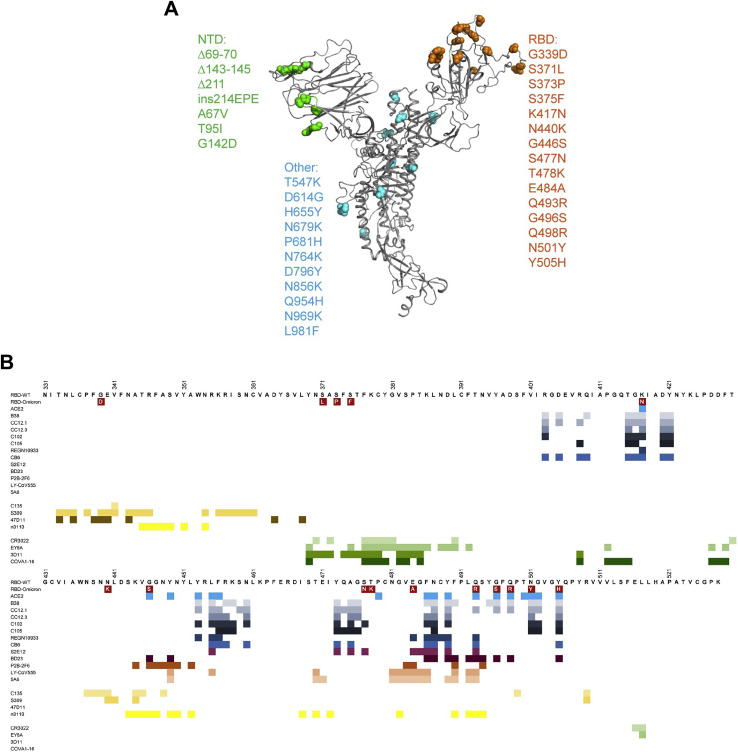
Figureu00a0S1
Illustration of mutations on spike of Omicron variant and epitopes for RBD-targeting antibodies, related to Figureu00a01 (A) The mutations in Omicron variant are shown on spike. The monomeric spike is...
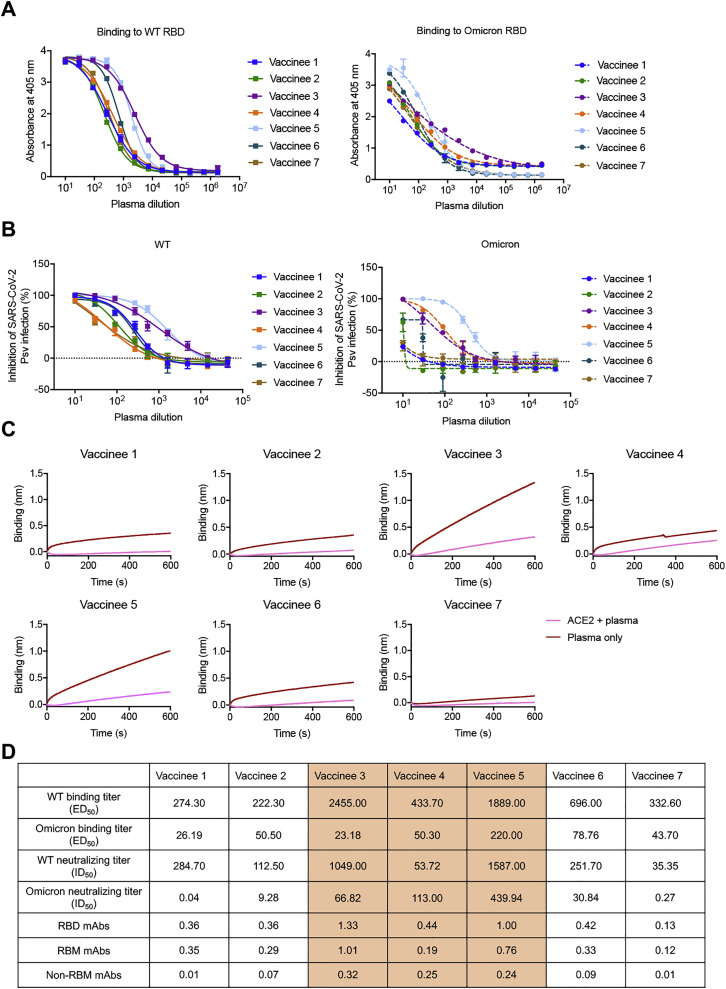
Figureu00a0S2
The Omicron variant reduces the binding activity and neutralizing potency of boosted vaccinee plasma, related to Figureu00a01 (A) Binding curves for WT or Omicron RBD by individual plasma, as determin...
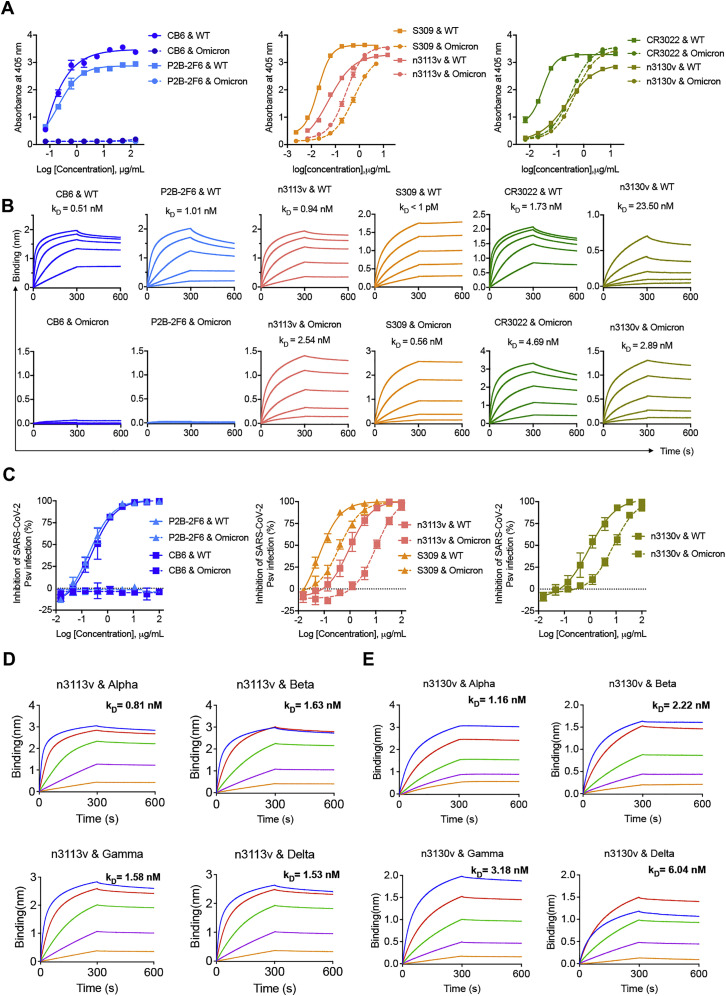
Figureu00a0S3
Binding affinity and neutralization of distinct antibody clusters to WT and Omicron variant, related to Figureu00a01 (A) Binding capacity of antibodies to WT and Omicron RBD, as measured by ELISA. (B)...
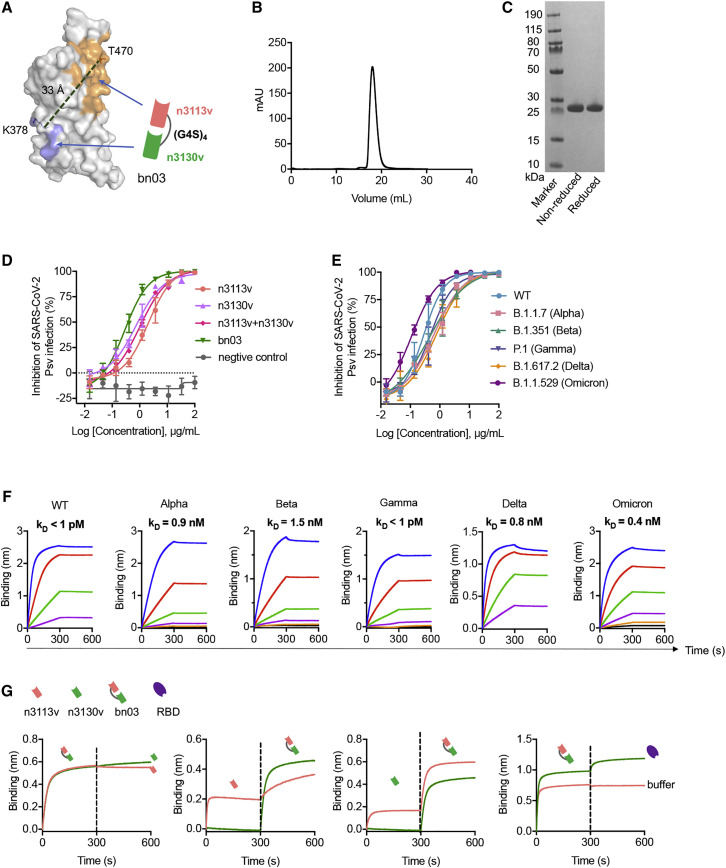
Figureu00a02
The design of bispecific single-domain antibody bn03 (A) The bispecific single-domain antibody bn03 contains n3130v and n3113v linked with a linker (GGGGS) 4 . n3113v and n3130v are colored in pink an...
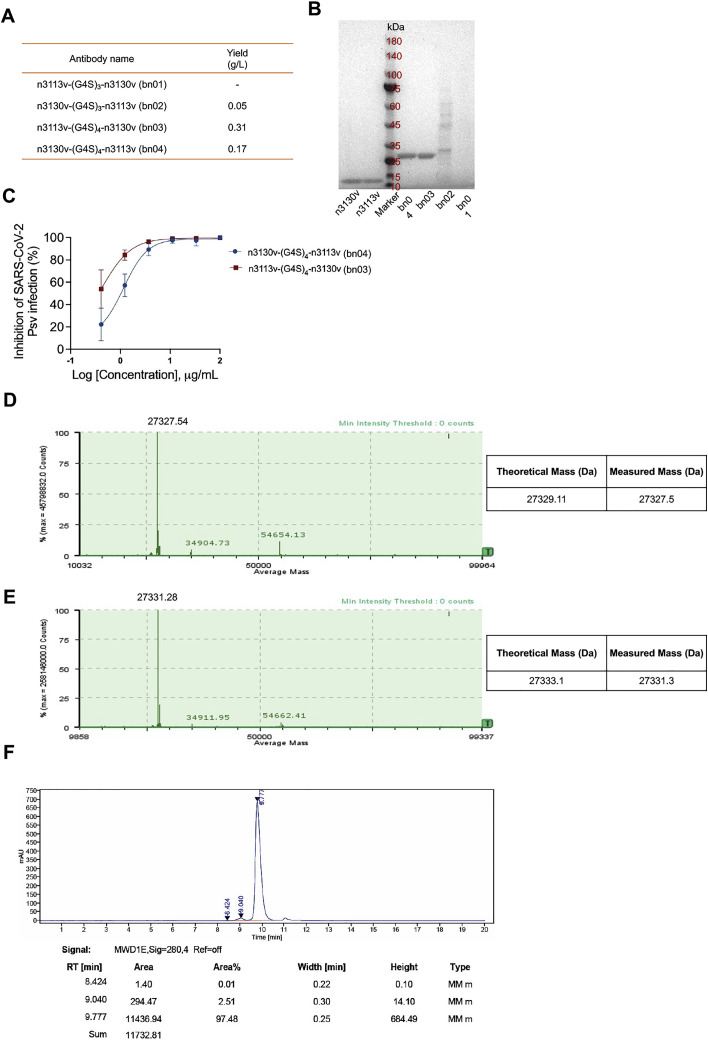
Figureu00a0S4
The properties and neutralization of bispecific single-domain antibodies containing n3113v and n3130v connected with different linkers, related to Figureu00a02 (A) Four types of bispecific single-doma...
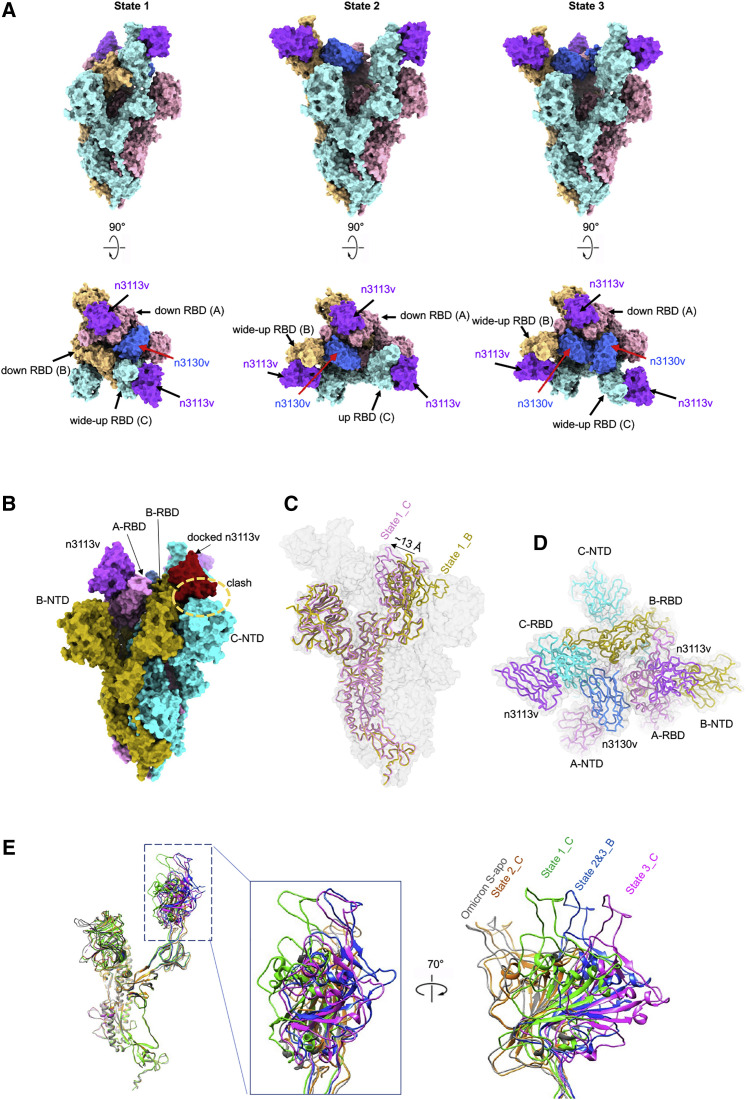
Figureu00a03
Cryo-EM structures of Omicron S trimer in complex with bispecific single-domain antibody bn03 (A) Bispecific single-domain antibody bn03 binds to Omicron S trimers in 3 states. Two perpendicular views...
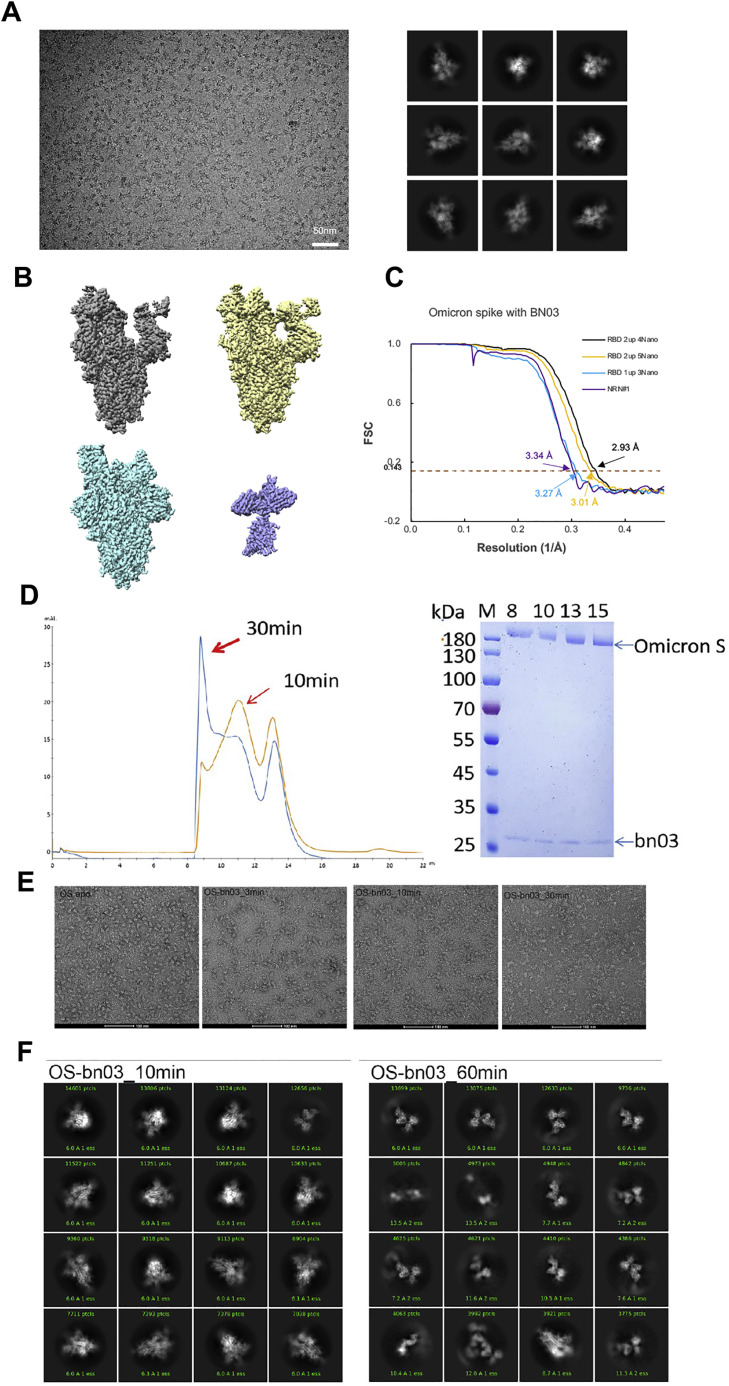
Figureu00a0S5
Cryo-EM data collection and processing of bn03 bound SARS-CoV-2 Omicron S, related to Figureu00a03 (A) Representative electron micrograph and 2D classification results of XG014 bound SARS-CoV-2 S. (B)...
Figureu00a0S6
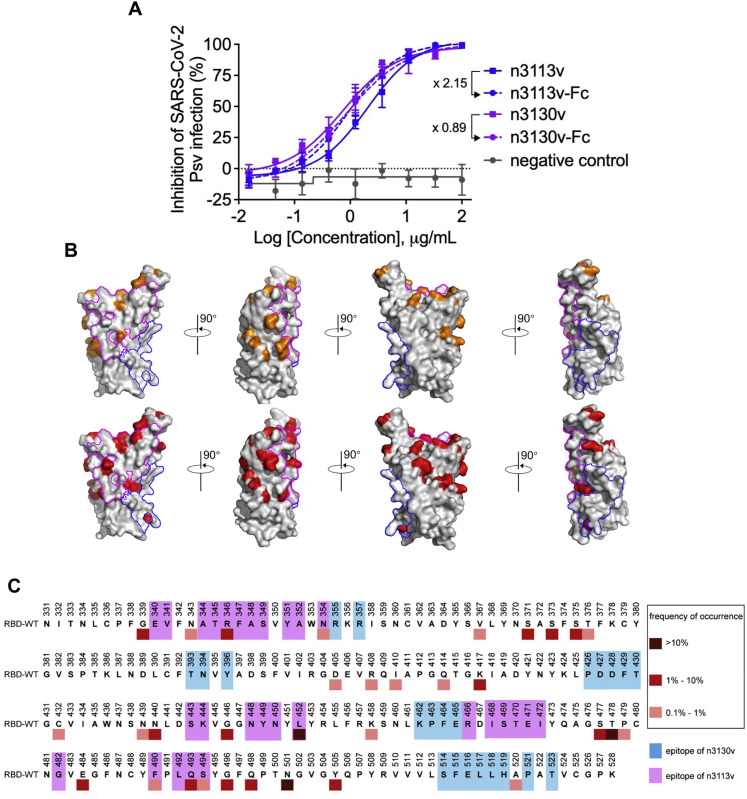
Neutralizing activity of n3113v, n3113v-Fc, n3130v, and n3130v-Fc against SARS-CoV-2 WT pseudovirus, and illustration of epitopes of single-domain antibodies on RBD, related to Figureu00a04 (A) Fold c...
Figureu00a04
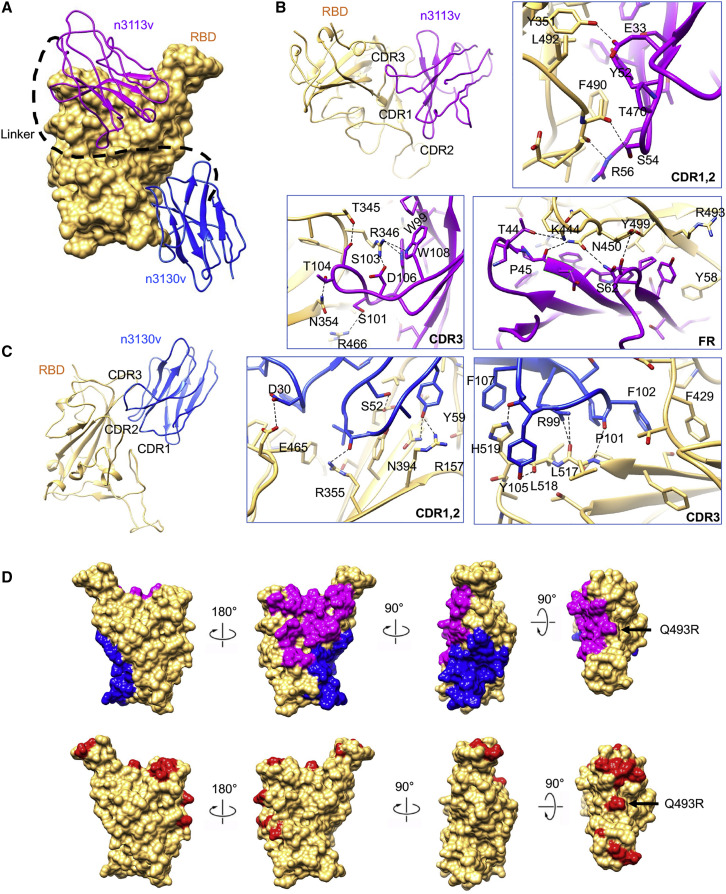
Two conserved epitopes recognized by bn03 (A) Close-up view of the interactions between bn03 and Omicron RBD. The Omicron RBD is displayed in yellow surface. n3113v and n3130v are shown as cartoon col...
Figureu00a05
Effective delivery of single-domain antibody to lung via inhalation (A) Schematic diagram of n3113v biodistribution in mice by inhalation and intraperitoneal injection. (B) Bio-imaging of mice body at...
Figureu00a06
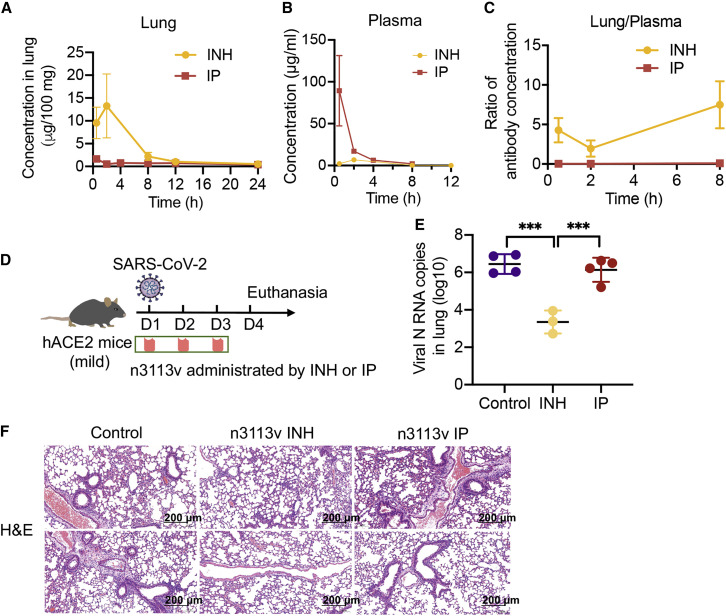
Inhalation of single-domain antibody exhibits effective therapeutic effects (Au2013C) Concentration of n3113v in lung (A), plasma (B), and the ratio of n3113v in lung relative to plasma (C), n = 2. (D...
Figureu00a07
Inhalation of bn03 effectively treats SARS-CoV-2 infection in mice (A) The aerosol performances of bn03 and IgG (S309) by NGI. The concentration of aerosolized particles in different stages is quantif...
Figureu00a0S7
The properties of bn03 were determined by DLSu00a0and HPLCu00a0before and after aerosolization by microsprayer aerosolizer, related to Figureu00a07 (A)u00a0Properties of bn03 determined by DLS and (B)...
Figure images are served from the NIH/NLM PubMed Central Open Access Subset or Europe PMC; copyright remains with the publishers and authors.
💬 Discussion
0 commentsNo comments yet. Be the first to start a discussion!
Leave a Comment