Abstract
Eggs of the helminth Schistosoma mansoni accumulate in the colon following infection and generate Th2-biassed inflammatory granulomas which become down- modulated in size as the infection proceeds to chronicity. However, although CD4+CD25+FoxP3+ regulatory T cells (T(regs)) are known to suppress Th1-mediated colitis, it is not clear whether they control Th2-associated pathologies of the large intestine which characterise several helminth infections. Here we used a novel 3D-multiphoton confocal microscopy approach to visualise and quantify changes in the size and composition of colonic granulomas at the acute and chronic phases of S. mansoni infection. We observed decreased granuloma size, as well as reductions in the abundance of DsRed+ T cells and collagen deposition at 14 weeks (chronic) compared to 8 weeks (acute) post-infection. Th2 cytokine production (i.e. IL-4, IL-5) in the colonic tissue and draining mesenteric lymph node (mLN) decreased during the chronic phase of infection, whilst levels of TGF-β1 increased, co-incident with reduced mLN proliferative responses, granuloma size and fibrosis. The proportion of CD4+CD25+FoxP3+T(regs): CD4+ cells in the mLN increased during chronic disease, while within colonic granulomas there was an approximate 4-fold increase. The proportion of CD4+CD25+FoxP3+T(regs) in the mLN that were CD103+ and CCR5+ also increased indicating an enhanced potential to home to intestinal sites. CD4+CD25+ cells suppressed antigen-specific Th2 mLN cell proliferation in vitro, while their removal during chronic disease resulted in significantly larger granulomas, partial reversal of Th2 hypo-responsiveness and an increase in the number of eosinophils in colonic granulomas. Finally, transfer of schistosome infection-expanded CD4+CD25+T(regs) down-modulated the development of colonic granulomas, including collagen deposition. Therefore, CD4+CD25+FoxP3+T(regs) appear to control Th2 colonic granulomas during chronic infection, and are likely to play a role in containing pathology during intestinal schistosomiasis.
🔬 Techniques
💻 Software
✨ Fluorophores
🧪 Sample Preparation
🔬 Cell Lines
🏭 Microscope Brands
🧪 Reagent Suppliers
💻 Software Details
🏛️ Research Organizations (ROR)
Affiliated research institutions:
📋 Methods
Ethics statement
All experiments were carried out in accordance with UK Animal's Scientific Procedures Act 1986 and with the approval of The University of York Ethics Committee. Experimental infection and parasitological readout C57BL/6 (B.6) and hCD2-VaDsRed-B.6 mice were maintained within the University of York under specific pathogen-free conditions. hCD2-DsRed-B6 mice, were a gift of D. Kioussis and A. Patel (National Institute for Medical Research, London) and express fluorescent DSRed T cells (>90% CD3+) to facilitate in situ detection of T cells by multiphoton microscopy (see below). Eight to ten-week female mice were infected percutaneously via the abdomen with 25 S. mansoni cercariae, and infections allowed to mature for either 8 or 14 weeks representing the acute and chronic phases of infection respectively. Adoptive transfer recipients were infected with 100 cercariae. Egg burdens in the 5 cm of colon proximal to the cecum were enumerated following digestion in 4% KOH. Eggs in faecal material were enumerated following dispersion in PBS, filtration through 100 µm pore mesh, and concentration. Colonic granulomas were isolated as previously described [16] . Volumes were calculated by measuring the longest and widest points and extrapolating volume using standard formulae for sphere or cylinder, depending on individual granuloma shape.
Histology and confocal microscopy
C olonic tissue were fixed in 4% formaldehyde and embedded in wax. Transverse cross-sections (5 µm) were stained with H&E, or haemotoxylin and Van Geison (Department of Veterinary Pathology, University of Liverpool). Digital photomicrographs were analysed using AxioVision software (Zeiss). For multiphoton imaging, proximal colon segments were mounted within 10 mm depression slides, and granulomas imaged from the serosal surface to egg mid-point using a 510 NLO laser-scanning microscope (LSM, Zeiss) with multi-photon laser (Coherent) tuned to 872 nm. 3D projections of ‘half-granulomas’ were rendered from z stacks using Volocity 4 software (Improvision). Quantification of Ds-Red + lymphocytes, granuloma and collagen volumes were performed using “ROI” and “RGB” measurement tools within Volocity. For immunofluorescent staining, frozen tissues were cryosectioned at 8 µm intervals, fixed with 10% methanol, permeabilised with 0.5% saponin (Sigma), and blocked with 5% rabbit serum / 1% FCS. Sections were labelled with anti-CD4 AF488 and anti-FoxP3 AF647 (both eBioscience) and fluorescence captured using the 510 NLO LSM. Settings for acute and chronic fluorescence images are matched both with respect to laser scanning settings at the time of image capture and post-image digital enhancement. Baseline laser scanning settings were undertaken on isotype controls and resultant negative control images contain undetectable fluorescent signal.
Show full methods section
Ethics statement
All experiments were carried out in accordance with UK Animal's Scientific Procedures Act 1986 and with the approval of The University of York Ethics Committee. Experimental infection and parasitological readout C57BL/6 (B.6) and hCD2-VaDsRed-B.6 mice were maintained within the University of York under specific pathogen-free conditions. hCD2-DsRed-B6 mice, were a gift of D. Kioussis and A. Patel (National Institute for Medical Research, London) and express fluorescent DSRed T cells (>90% CD3+) to facilitate in situ detection of T cells by multiphoton microscopy (see below). Eight to ten-week female mice were infected percutaneously via the abdomen with 25 S. mansoni cercariae, and infections allowed to mature for either 8 or 14 weeks representing the acute and chronic phases of infection respectively. Adoptive transfer recipients were infected with 100 cercariae. Egg burdens in the 5 cm of colon proximal to the cecum were enumerated following digestion in 4% KOH. Eggs in faecal material were enumerated following dispersion in PBS, filtration through 100 µm pore mesh, and concentration. Colonic granulomas were isolated as previously described [16] . Volumes were calculated by measuring the longest and widest points and extrapolating volume using standard formulae for sphere or cylinder, depending on individual granuloma shape.
Histology and confocal microscopy
C olonic tissue were fixed in 4% formaldehyde and embedded in wax. Transverse cross-sections (5 µm) were stained with H&E, or haemotoxylin and Van Geison (Department of Veterinary Pathology, University of Liverpool). Digital photomicrographs were analysed using AxioVision software (Zeiss). For multiphoton imaging, proximal colon segments were mounted within 10 mm depression slides, and granulomas imaged from the serosal surface to egg mid-point using a 510 NLO laser-scanning microscope (LSM, Zeiss) with multi-photon laser (Coherent) tuned to 872 nm. 3D projections of ‘half-granulomas’ were rendered from z stacks using Volocity 4 software (Improvision). Quantification of Ds-Red + lymphocytes, granuloma and collagen volumes were performed using “ROI” and “RGB” measurement tools within Volocity. For immunofluorescent staining, frozen tissues were cryosectioned at 8 µm intervals, fixed with 10% methanol, permeabilised with 0.5% saponin (Sigma), and blocked with 5% rabbit serum / 1% FCS. Sections were labelled with anti-CD4 AF488 and anti-FoxP3 AF647 (both eBioscience) and fluorescence captured using the 510 NLO LSM. Settings for acute and chronic fluorescence images are matched both with respect to laser scanning settings at the time of image capture and post-image digital enhancement. Baseline laser scanning settings were undertaken on isotype controls and resultant negative control images contain undetectable fluorescent signal.
Anti-CD25 mAb treatment
Three doses of anti-CD25 mAb (50 µg; clone PC61, a gift from F. Powrie, University of Oxford), or purified rat IgG2a, were delivered intraperitoneally to infected mice at 9, 11, and 13 weeks. T reg cell purification, adoptive transfer and in vitro culture T regs from the mLN were purified by depletion of non-CD4 + cells followed by isolation of CD25 + cells using antibodies conjugated to magnetic beads (Miltenyi Biotec). For adoptive transfer, 2.5×10 6 CD4 + CD25 + T regs (>90% purity) were injected via the lateral tail vein. Total mLN cells (2×10 6 /ml), sorted CD4 + CD25 − effector cells (1×10 6 /ml), and CD4 + CD25 + T regs (0.5×10 6 /ml) from infected mice cultured in complete RPMI-1640 medium (containing 10% FCS, 50 µg/ml penicillin/streptomycin), in combination with naïve mLN CD4 − CD25 − cells (0.1×10 6 /ml) as a source of APC. Cells were stimulated with plate-bound anti-CD3 mAb (1 µg; Becton Dickinson), or SEA (50 µg/ml) [16] . Cells were cultured for 72 h and supernatants retained for cytokine analysis. Proliferation was measured from 72 to 96 h by 3 H-thymidine incorporation and scintillation counting. Cytokine and collagen quantifications ELISAs were used to quantify IL-4, IL-5 and IFNγ [17] , while IL-10 and IL-13 were measured by Cytoset (Invitrogen) or DuoSet (R&D Systems) kits respectively. A TGFβ-sensitive, mink lung epithelial cell bio-assay (MLEC transfected with firefly luciferase; gift from Daniel Rifkin, NY Medical Center) was used to determine levels of bio-active TGFβ1 [18] . As the bio-assay was not compatible with tissue extracts, a TGFβ1 ELISA (R&D Systems) was employed. In order to determine cytokine levels in the colon, frozen tissues were first homogenised in proprietary tissue extraction buffer containing detergent and protease inhibitors (Thermo Scientific) and then incubated/rotated overnight at 4°C and the soluble fractions isolated by centrifugation prior analysis by ELISA. Salt-soluble collagen was quantified using colorimetric assay (Sircol, Biocolor).
Quantitative Real Time PCR
Total colonic mRNA was used to generate cDNA using Superscript III DNA polymerase (Invitrogen) and foxp3 transcript analysed by qRT-PCR (ABI PRISM 7000; Applied Biosystems) using Taqman probes (Sigma-Aldrich). The relative expression of foxp3 was normalised to values obtained for cd3 . Primer pairs and probes were; foxp3 5′-GCAGTGTGGACCGTAGATGA , 5′-CACAGCCTCAGTCTCATGGT , Probe 5′-ACAAGTGCTCCAATCCCTGCCCTT and cd3 5′-GAGCACCCTGCTACTCCTTG , 5′- ATGTCCCAGCACTGGCTACT , Probe 5′- TGCTCTTCAGCCTCCTGGTGAACAC .
Flow Cytometry
Cells were blocked with anti-CD16/CD32 (eBioscience) at 0.5 µg / 1×10 6 cells, then labelled with anti-CD4-Pacific Blue, anti-CD25-APC (PC-61), anti-CD103-PE (all eBioscience), anti-CD25-FITC (7D4), anti-CTLA-4-FITC, or anti-CCR5-biotin (BD Bioscience) for 30 minutes. Biotinylated antibodies were sequentially detected with streptavidin-PE-Cy7 (eBioscience). For intracellular staining of FoxP3, cells were fixed in 1% formalin, re-suspended in permeablisation buffer (Becton Dickinson) prior to labelling with anti-FoxP3-PE or -AF647 (eBioscience). Cells were analysed using a Cyan flow cytometer with Summit software (Beckman Coulter).
Statistical analyses
Significant differences between two experimental groups were determined by unpaired Student's T test, and between three or more groups by 1-way ANOVA with Tukey post-hoc tests using Prism software (GraphPad). Because colonic egg counts were skewed, analysis was undertaken after Log10 transformation. All data are representative of a minimum of two independent experiments. Significance is indicated *** P
📊 Figures
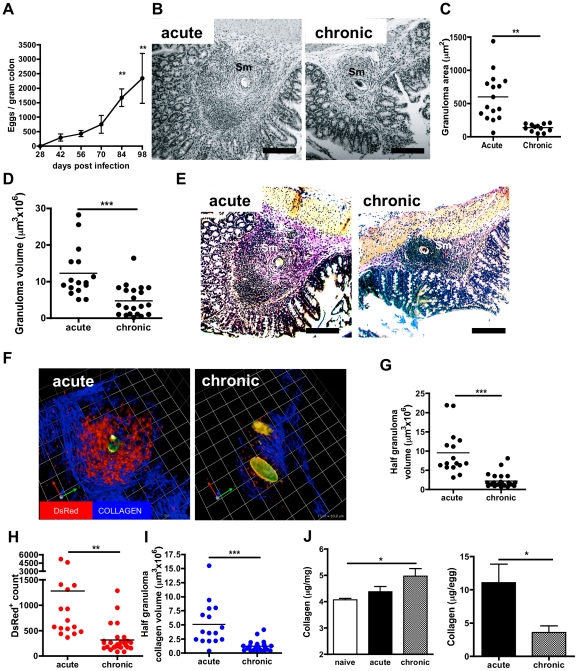
Figure 1
Colonic granuloma size and fibrosis is reduced in the chronic phase of schistosome infection.
A). Accumulation of eggs /gram of colon tissue (nu200a=u200a4 mice/time point); mean eggs (u00b1 SEM). B ) Representative photomicrographs of the colon at the acute (8 wks) or chronic (14 wks) stage o...
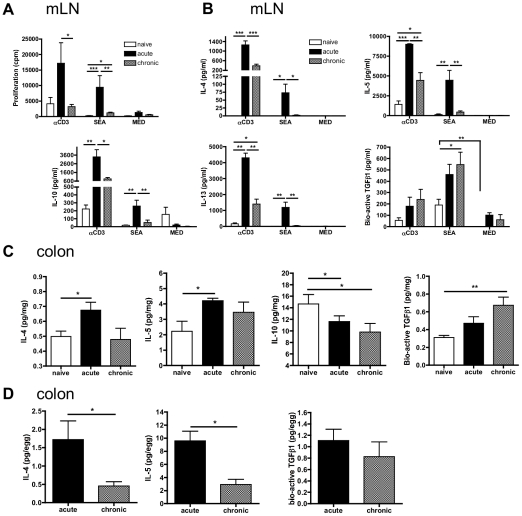
Figure 2
Egg antigen-specific Th2, but not TGF-u03b21 responses become down-modulated within the mLN and colon during chronic infection.
A) Proliferative responses and B) cytokine release (pg/ml) by mLN cells from nau00efve, acute, or chronic mice (n = 4/group) to anti-CD3 mAb, or SEA. C) Cytokine levels within colonic tissues (pg/mg t...
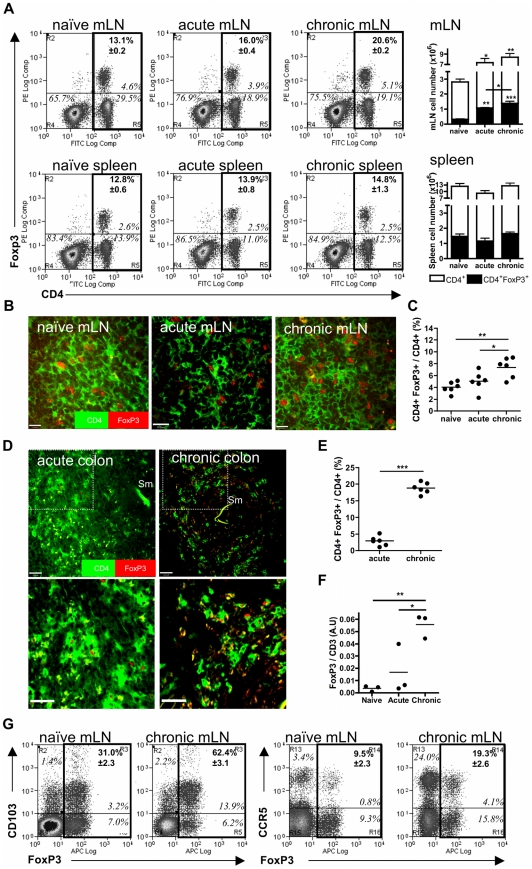
Figure 3
Frequencies of CD4 + FoxP3 + T regs increase at the chronic phase in both the mLN and colonic granulomas.
A ) Representative flow cytograms showing the frequencies of labelled CD4 + and FoxP3 + cells in suspensions of the mLN and spleen. Values in italics are quadrant percentages. Values in bold, upper ri...
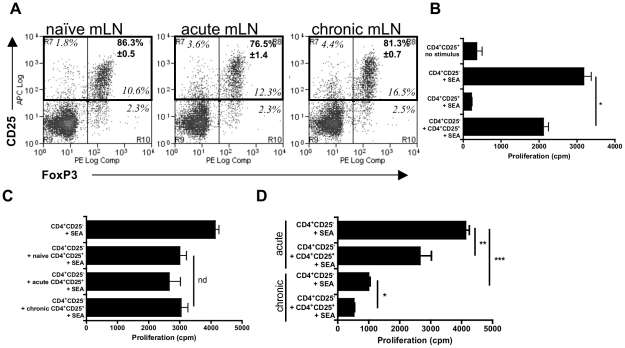
Figure 4
CD4 + CD25 + mLN cells suppress antigen-specific CD4 + Th2 responses in vitro.
A ) Flow plots of mLN cell suspensions (nu200a=u200a3 mice) labelled with anti-CD25 and anti-FoxP3, gated on CD4 expression. Values in italics are quadrant percentages. Values in bold, upper right-han...
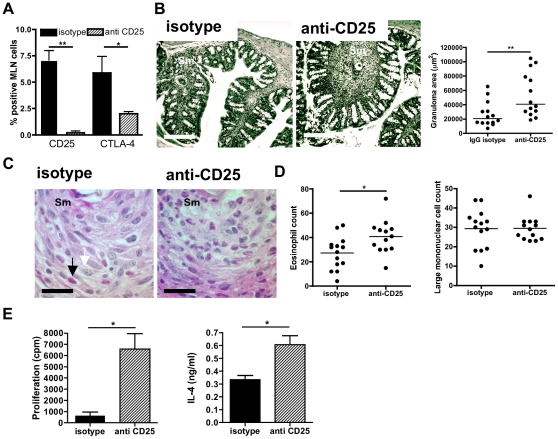
Figure 5
In vivo ablation of CD25 + cells impairs regulation of colonic granulomas and antigen-specific Th2 responses.
A ) Percentage of CD25 + or CTLA-4 + mLN lymphocytes from mice with chronic infection after treatment with anti-CD25 mAb, or isotype control. Antibodies given at 2 week intervals from wk 9 to wk 13, t...
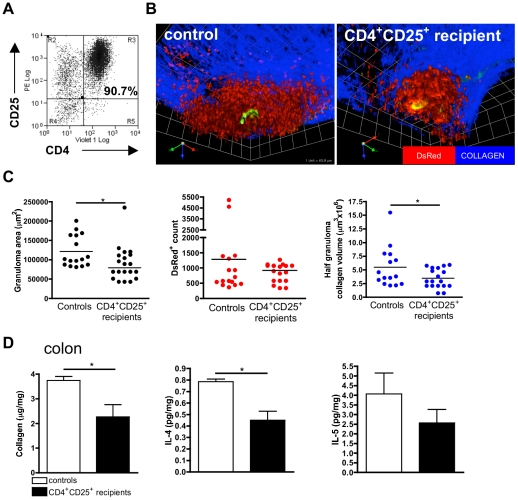
Figure 6
Transfer of schistosome-expanded CD4 + CD25 + T regs modulates the development of acute-stage granulomas.
A) Isolated mLN CD4 + CD25 + T regs from mice with chronic infection used for transfer. B) 3D images of multiphoton confocal stacks of colonic tissue viewed in situ at the acute stage of infection in ...
Figure images are served from the NIH/NLM PubMed Central Open Access Subset or Europe PMC; copyright remains with the publishers and authors.
💬 Discussion
0 commentsNo comments yet. Be the first to start a discussion!
Leave a Comment