Abstract
The rod-shaped Gram-negative bacterium Escherichia coli multiplies by elongation followed by binary fission. Longitudinal growth of the cell envelope and synthesis of the new poles are organized by two protein complexes called elongasome and divisome, respectively. We have analyzed the spatio-temporal localization patterns of many of these morphogenetic proteins by immunolabeling the wild type strain MC4100 grown to steady state in minimal glucose medium at 28°C. This allowed the direct comparison of morphogenetic protein localization patterns as a function of cell age as imaged by phase contrast and fluorescence wide field microscopy. Under steady state conditions the age distribution of the cells is constant and is directly correlated to cell length. To quantify cell size and protein localization parameters in 1000s of labeled cells, we developed 'Coli-Inspector,' which is a project running under ImageJ with the plugin 'ObjectJ.' ObjectJ organizes image-analysis tasks using an integrated approach with the flexibility to produce different output formats from existing markers such as intensity data and geometrical parameters. ObjectJ supports the combination of automatic and interactive methods giving the user complete control over the method of image analysis and data collection, with visual inspection tools for quick elimination of artifacts. Coli-inspector was used to sort the cells according to division cycle cell age and to analyze the spatio-temporal localization pattern of each protein. A unique dataset has been created on the concentration and position of the proteins during the cell cycle. We show for the first time that a subset of morphogenetic proteins have a constant cellular concentration during the cell division cycle whereas another set exhibits a cell division cycle dependent concentration variation. Using the number of proteins present at midcell, the stoichiometry of the divisome is discussed.
🔬 Techniques
🧬 Organisms
💻 Software
✨ Fluorophores
🧪 Sample Preparation
🔬 Cell Lines
🏭 Microscope Brands
📷 Detectors
💻 Software Details
🏛️ Research Organizations (ROR)
Affiliated research institutions:
📋 Methods
Growth Conditions and Media Escherichia coli K12 cells were grown to steady state in glucose minimal medium (Gb1) containing 6.33 g of K 2 HPO 4 .3H 2 O, 2.95 g of KH 2 PO 4 , 1.05 g of (NH 4 ) 2 SO 4 , 0.10 g of MgSO 4 .7H 2 O, 0.28 mg of FeSO 4 .7H 2 O, 7.1 mg of Ca(NO 3 ) 2 .4H 2 O, 4 mg of thiamine, 4 g of glucose and 50 μg of required amino acids per liter pH 7.0 at 28°C. MC4100 (LMC500) requires Lys for growth in minimal medium. Absorbance was measured at 450 nm with a 300-T-1 spectrophotometer (Gilford Instrument Laboratories Inc.). Steady state growth was achieved by dilution of an over night culture 1:1000 in fresh prewarmed medium of 28°C. The cells were allowed to grow up to a density of 0.2 and then diluted again in prewarmed medium. This procedure was repeated during 40 generations of exponential growth. The mass doubling time of MC4100 is 80 min under these conditions. The overnight dilution was calculated using the equation: D = 2 t/Td ( OD now OD des ) , where D is the required dilution of the culture to obtain the desired optical density (OD des ) after t minutes, and Td is the mass doubling time in min. OD now is the optical density of the culture to be diluted. The steady state cultures were fixed by addition of a mixture of formaldehyde (f.c. 2.8%) and glutaraldehyde (f.c. 0.04%) to the shaking water bath. This gives an osmotic shock that does not affect the localization of membrane or cytosolic proteins ( Hocking et al., 2012 ; van der Ploeg et al., 2013 ). Unfortunately, periplasmic proteins that are freely diffusing are shocked toward the poles. Therefore, the procedure is not suitable for immunolabeling of periplasmic proteins and if used, their localization pattern should be verified using fluorescent protein (FP) fusions and live imaging. Immunolabeling Immunolabeling of the cells was performed as described ( Buddelmeijer et al., 2013 ). Antisera were either pre-purified using cells of a deletion strain ( Table 1 ) of the particular protein against which the antiserum was directed, or the specific IgG was purified using the native protein against which it was directed ( Karczmarek et al., 2007 ; Typas et al., 2010 ). In brief, formaldehyde/glutaraldehyde fixed and Tx100/lysozyme permeabilized cells were incubated for 1 h at 37°C with purified polyclonal antibodies directed against FtsK, FtsN, FtsB, FtsZ, ZipA, MinC, MinD, PBP3, PBP5, PBP1B, PBP1A, LpoB, LpoA, ZapA, all diluted in blocking buffer. ZapB was immunolabeled with Fabs conjugated to Cy3. As secondary antibody, donkey anti-rabbit conjugated to Cy3 (Jackson Immunochemistry, USA) diluted 1:300 in blocking buffer (0.5% (wt/vol) blocking reagents (Boehringer, Mannheim, Germany) in PBS) was used, and the samples were incubated for 30 min at 37°C. For immunolocalization, cells were immobilized on 1% agarose in water slabs coated object glasses as described ( Koppelman et al., 2004 ) and photographed with a Coolsnap fx (Photometrics) CCD camera mounted on an Olympus BX-60 fluorescence microscope through a 100x/N.A. 1.35 oil objective. Images were taken using the program ImageJ with MicroManager 2 . Table 1 Used strains and their genotypes.
Show full methods section
Growth Conditions and Media Escherichia coli K12 cells were grown to steady state in glucose minimal medium (Gb1) containing 6.33 g of K 2 HPO 4 .3H 2 O, 2.95 g of KH 2 PO 4 , 1.05 g of (NH 4 ) 2 SO 4 , 0.10 g of MgSO 4 .7H 2 O, 0.28 mg of FeSO 4 .7H 2 O, 7.1 mg of Ca(NO 3 ) 2 .4H 2 O, 4 mg of thiamine, 4 g of glucose and 50 μg of required amino acids per liter pH 7.0 at 28°C. MC4100 (LMC500) requires Lys for growth in minimal medium. Absorbance was measured at 450 nm with a 300-T-1 spectrophotometer (Gilford Instrument Laboratories Inc.). Steady state growth was achieved by dilution of an over night culture 1:1000 in fresh prewarmed medium of 28°C. The cells were allowed to grow up to a density of 0.2 and then diluted again in prewarmed medium. This procedure was repeated during 40 generations of exponential growth. The mass doubling time of MC4100 is 80 min under these conditions. The overnight dilution was calculated using the equation: D = 2 t/Td ( OD now OD des ) , where D is the required dilution of the culture to obtain the desired optical density (OD des ) after t minutes, and Td is the mass doubling time in min. OD now is the optical density of the culture to be diluted. The steady state cultures were fixed by addition of a mixture of formaldehyde (f.c. 2.8%) and glutaraldehyde (f.c. 0.04%) to the shaking water bath. This gives an osmotic shock that does not affect the localization of membrane or cytosolic proteins ( Hocking et al., 2012 ; van der Ploeg et al., 2013 ). Unfortunately, periplasmic proteins that are freely diffusing are shocked toward the poles. Therefore, the procedure is not suitable for immunolabeling of periplasmic proteins and if used, their localization pattern should be verified using fluorescent protein (FP) fusions and live imaging. Immunolabeling Immunolabeling of the cells was performed as described ( Buddelmeijer et al., 2013 ). Antisera were either pre-purified using cells of a deletion strain ( Table 1 ) of the particular protein against which the antiserum was directed, or the specific IgG was purified using the native protein against which it was directed ( Karczmarek et al., 2007 ; Typas et al., 2010 ). In brief, formaldehyde/glutaraldehyde fixed and Tx100/lysozyme permeabilized cells were incubated for 1 h at 37°C with purified polyclonal antibodies directed against FtsK, FtsN, FtsB, FtsZ, ZipA, MinC, MinD, PBP3, PBP5, PBP1B, PBP1A, LpoB, LpoA, ZapA, all diluted in blocking buffer. ZapB was immunolabeled with Fabs conjugated to Cy3. As secondary antibody, donkey anti-rabbit conjugated to Cy3 (Jackson Immunochemistry, USA) diluted 1:300 in blocking buffer (0.5% (wt/vol) blocking reagents (Boehringer, Mannheim, Germany) in PBS) was used, and the samples were incubated for 30 min at 37°C. For immunolocalization, cells were immobilized on 1% agarose in water slabs coated object glasses as described ( Koppelman et al., 2004 ) and photographed with a Coolsnap fx (Photometrics) CCD camera mounted on an Olympus BX-60 fluorescence microscope through a 100x/N.A. 1.35 oil objective. Images were taken using the program ImageJ with MicroManager 2 . Table 1 Used strains and their genotypes.
Strain name Characteristics Genotype Source MC4100
Wild type F - , araD139, Δ (argF-lac)U169deoC1, flbB5301, ptsF25, rbsR, relA1, rpslL150, lysA1 Taschner et al. (1988) BW25113 Wild type F -, Δ (araD-araB)567, Δ lacZ4787 (::rrnB-3), λ - , rph-1, Δ (rhaD-rhaB)568, hsdR514 Baba et al. (2006) PA340-678 ΔMreBCD F - , argH1, thr-1, leuB6, ghd-1, gltB31, thi-1, lacY1, gal-6, xyl-7, ara-14, mtl-2, malA1, rpsL9, tonA2 Wachi et al. (1987) CS12-7 ΔPBP5 W1485 rpoS rpH dacA::kan 512-1 Potluri et al. (2010) LMC1084 ΔMinCDE PB114 Δ minB ::Km(R), dad R1, trpE61, trpA62, tna5, purB,L- + de Boer et al. (1989) BW25113 ΔlpoA ΔLpoA BW25113 Δ lpoA Baba et al. (2006) BW25113 ΔlpoB ΔLpoB BW25113 Δ lpoB Baba et al. (2006) JW3359 mrcA ΔPBP1A BW25113 Δ mrcA Baba et al. (2006) JW0145 mrcB ΔPBP1B BW25113 ΔmrcB Baba et al. (2006) LMC3143 ΔZapA LMC500 Δ zapA Mohammadi et al. (2009) MC1000 ΔZapB ΔZapB Δ zapB Δ ( ara-leu ) Δ lac rpsL 150 Ebersbach et al. (2008) CH5/pCH32 ZipA depletion PB103 zipA::aph / aadA + repA (Ts) ftsZ + zipA + recA::Tn10 Hale and de Boer (1999) Image Analysis Phase contrast and fluorescence images were combined into hyperstacks using ImageJ 3 and these were linked to the project file of Coli-Inspector running in combination with the plugin ObjectJ 4 . The images were scaled to 14.98 pixel per μm. The fluorescence background has been subtracted using the modal values from the fluorescence images before analysis. Major analysis steps are given in the Section “Results,” and the full Coli-Inspector documentation can be found at https://sils.fnwi.uva.nl/bcb/objectj/examples . Slight misalignment of fluorescence with respect to the cell contours as found in phase contrast was corrected using Fast-Fourier techniques. The fluorescence image was translated in x–y direction so that fluorescence measured under all cell contours reached a maximum 5 .
Data Analysis
Cells are assumed to have rotational symmetry, where the mid-line as detected from the cell contour in phase contrast represents the cell axis. Partial or entire cell volume is obtained by the integration of 1-pixel-thick disks with local diameter along the cell axis. Envelope area is obtained by contour rotation. Fluorescence values are derived from the second channel of the profile map, where each cell is represented as a vector (1-pixel wide column). Each pixel contains the entire fluorescence of a 1-pixel-thick disk including light detected slightly outside the contour due to the point-spread function. The sum of all vector elements (pixels) is displayed as FluorTotal. The concentration of the fluorescence per cell (ConcTotal) or the concentration in the envelope (ConcWall) was calculated by dividing the FluorTotal by either the cell volume (for FtsZ, ZapA, and ZapB), or by the envelope area for all other proteins that are cytoplasmic membrane bound or inserted. In order to relate fluorescent light quantities to absolute numbers of protein molecules, the conversion factor F was calculated by dividing the integrated fluorescence by the number of proteins of the average cell. The number of involved protein molecules could then be calculated for an individual cell or even a part of it. Midcell was defined as the central part of the cell comprising 0.8 μm of the axis. From either cell part, midcell and remaining cell, the volume, the integrated fluorescence, and thus the concentration of fluorophores can be calculated. The difference of the two concentrations is multiplied with the volume of midcell. It yields FCPlus (surplus of fluorescence) and, via factor F , MolsFCPlus (surplus of protein molecules at the cell center). These values are positive or negative for higher or lower concentrations in the center, respectively. For age calculation, all cell lengths are sorted in ascending order. Then the equation age=ln ( 1 − 0.5 * rank/ ( nCells-1 ) ) /ln ( 0.5 ) is used, where rank is a cell’s index in the sorted array, nCells is the total amount of cells, and age is the cell’s age expressed in the range 0.. 1. For explanation of the most important parameters used in this study see Table 2 . Table 2 Overview of the most important parameters used for the analysis of the spatio-temporal localization of the immunolabeled proteins. Parameter Description Unit Age Cell age based on cell length (0–100) % F Conversion factor proteins/FluorUnit Fluortotal Integrated fluorescence of cell FluorUnit Volume Total cell volume (sum of disk volumes) μm 3 ConcTotal Concentration of fluorescent material in cell volume FluorUnit/μm 3 CellWall Area of cell envelope μm 2 Area Area of cell projection (contour as obtained from phase contrast image) μm 2 ConcWall Concentration of fluorescent material in cell envelope FluorUnits/μm 2 MidCell Volume Cell compartment ± 0.4 μm from cell center μm 3 FCPlus Surplus of fluorescence in cell center compared to the rest of the cell FluorUnit MolsCPlus Molecules in Center surplus gives the number of molecules in the cell center that are in surplus compared to the rest of the cell (calculated from FCPlus ∗ F ) molecules
Supplementary Material The Supplementary Material for this article can be found online at: http://journal.frontiersin.org/article/10.3389/fmicb.2015.00586/abstract Click here for additional data file. Click here for additional data file.
📊 Figures
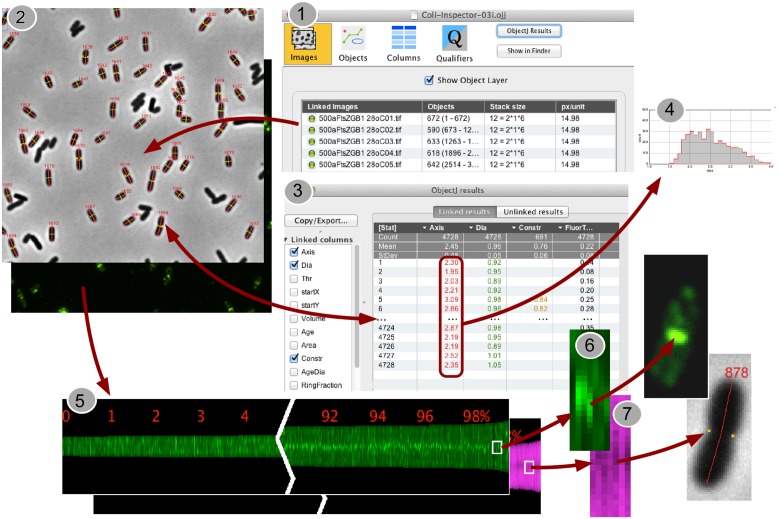
FIGURE 1
Back-and-forth navigation between individual image processing steps. (1) In the project window u201cColi-Inspector-03i.ojj,u201d the panel for u201cLinked Imagesu201d is active and shows the double-cl...
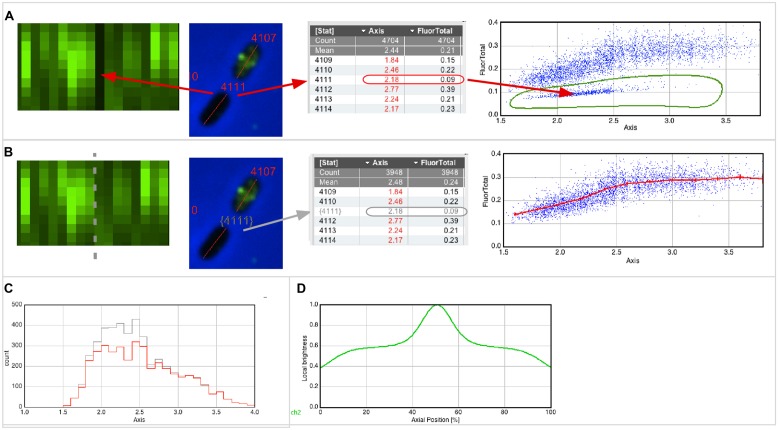
FIGURE 2
Qualifying and plotting. (A) The Map of fluorescence (left) shows a vertical black line, indicating low fluorescence (FluorTotal = 0.09) for cell #4111 that obviously did not permeabilize properly. In...
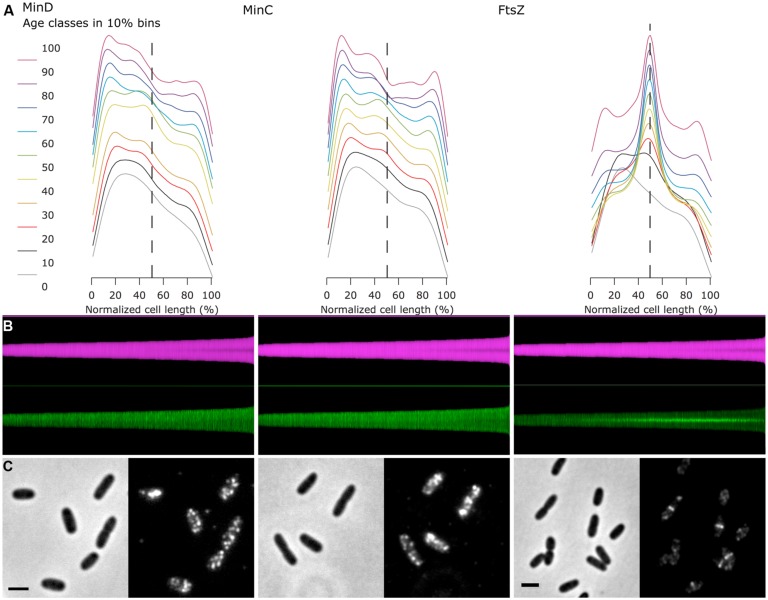
FIGURE 3
Fluorescence profiles of immunolabeled endogenous MinC, MinD, and FtsZ show cell division cycle dependent localization. (A) For each of the three proteins, the fluorescence profiles along the cell axi...
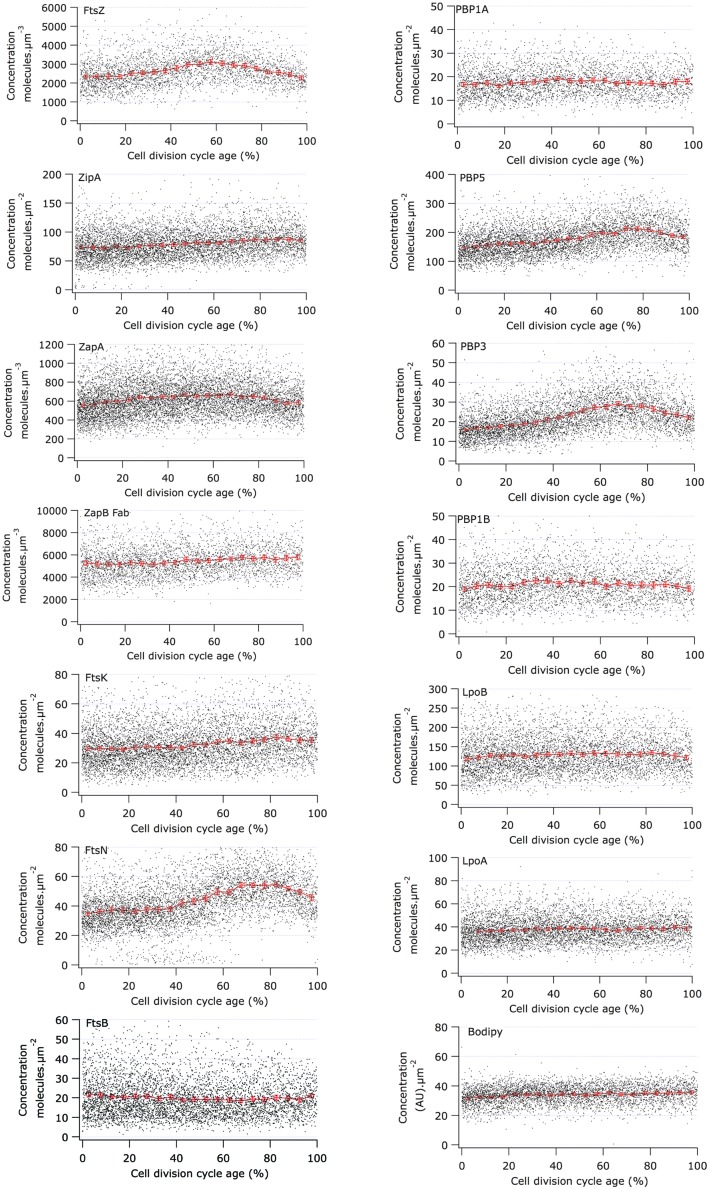
FIGURE 4
Concentration of morphogenetic proteins as function of the bacterial cell division cycle. For each graph the concentration of the indicated protein is plotted against the cell age in %. The black dots...
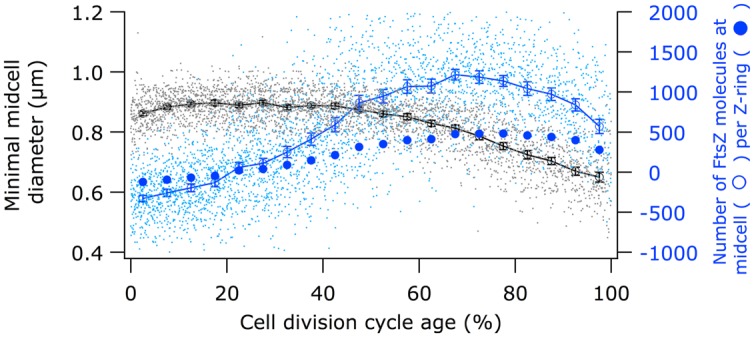
FIGURE 5
Comparison of the timing of the constriction with the timing of the FtsZ localization at midcell. Black circles (legend on the left) show minimal cell diameter (constriction) versus cell age. Open blu...
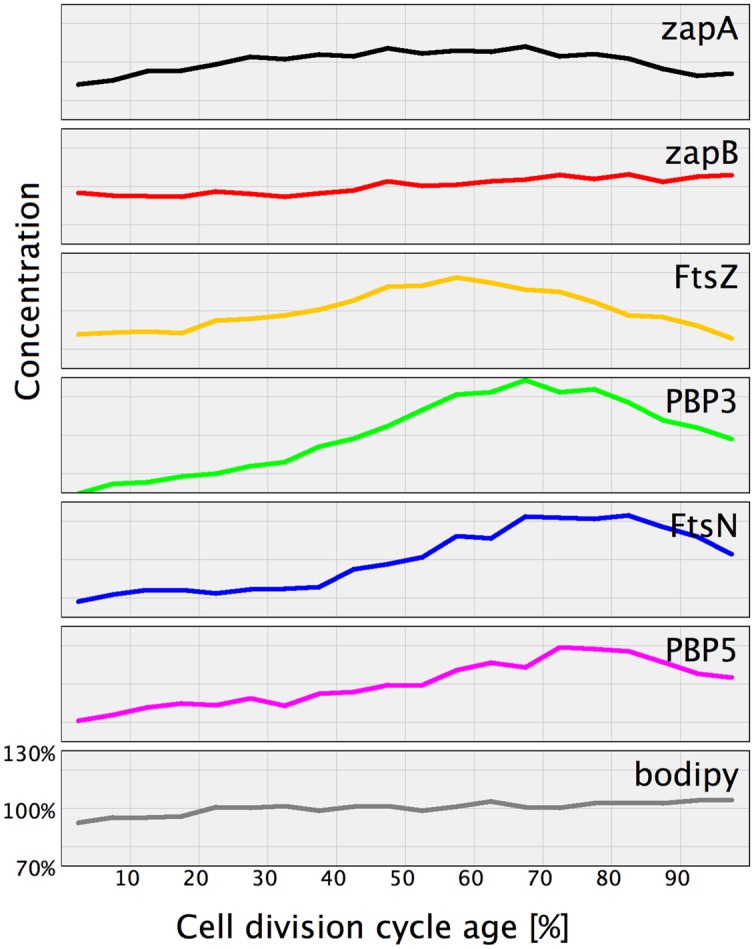
FIGURE 6
Normalized protein concentration as function of cell age. For comparison the proteins that were found to have a cell age dependent concentration variation have been plotted in one graph. The concentra...
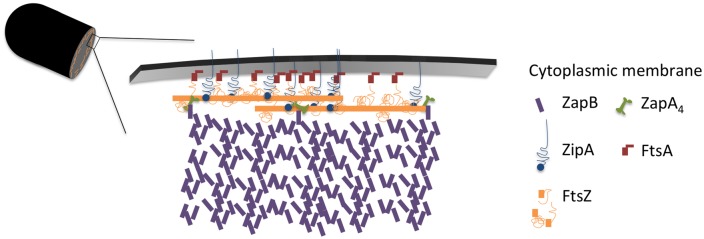
FIGURE 7
Model of the proto-ring. Two FtsZ filaments in orange, each consisting of 27 residues with a length of 120 nm are connected to the cytoplasmic membrane by 4 ZipA molecules (blue) or 2 ZipA dimers that...
Figure images are served from the NIH/NLM PubMed Central Open Access Subset or Europe PMC; copyright remains with the publishers and authors.
💬 Discussion
0 commentsNo comments yet. Be the first to start a discussion!
Leave a Comment