Abstract
Invasive cells use small invadopodia to breach basement membrane (BM), a dense matrix that encases tissues. Following the breach, a large protrusion forms to clear a path for tissue entry by poorly understood mechanisms. Using RNAi screening for defects in Caenorhabditis elegans anchor cell (AC) invasion, we found that UNC-6(netrin)/UNC-40(DCC) signaling at the BM breach site directs exocytosis of lysosomes using the exocyst and SNARE SNAP-29 to form a large protrusion that invades vulval tissue. Live-cell imaging revealed that the protrusion is enriched in the matrix metalloprotease ZMP-1 and transiently expands AC volume by more than 20%, displacing surrounding BM and vulval epithelium. Photobleaching and genetic perturbations showed that the BM receptor dystroglycan forms a membrane diffusion barrier at the neck of the protrusion, which enables protrusion growth. Together these studies define a netrin-dependent pathway that builds an invasive protrusion, an isolated lysosome-derived membrane structure specialized to breach tissue barriers.
🔬 Techniques
🔭 Microscopes
🧬 Organisms
💻 Software
✨ Fluorophores
🧪 Sample Preparation
🏭 Microscope Brands
📷 Detectors
🔎 Objectives
💻 Software Details
💾 Data Repositories
🏛️ Research Organizations (ROR)
Affiliated research institutions:
📋 Methods
CONTACT FOR REAGENT AND RESOURCE SHARING
Further information and requests for resources and reagents should be directed to and will be fulfilled by the Lead Contact, David R. Sherwood ( david.sherwood@duke.edu ).
EXPERIMENTAL MODEL AND SUBJECT DETAILS
C. elegans strains were maintained on standard NGM media and fed E. coli OP50. For RNAi experiments, wild type controls were fed E. coli HT115(DE3) containing L4440 (see RNAi experiments, STAR Methods). Unless otherwise noted, all strains were maintained at 20°C. All animals scored were hermaphrodites during the L3 stage when the anchor cell (AC) invades. AC invasion was precisely staged in reference to VPC divisions and gonad development as previously described ( Sherwood et al., 2005 ). Briefly, the AC is positioned over the central P6.p vulval precursor cell cell prior to invasion in the early L3 larval stage. During the mid L3 stage the P6.p cell divides once (P6.p 2-cell stage). At the late P6.p 2-cell stage the AC initiates BM breach (near the time with the distal tip cells of the gonad arm begin migrating dorsally). At the P6.p 2-to-4-cell transition (when the P6.p daughters divide) the AC protrusion forms and clears an opening in the basement membrane and extends around and between the P6.p vulval precursor cell descendants. At the early P6.p 4-cell stage (mid-to-late L3 stage), the protrusion retracts back into the AC ( Figure 1A ).
METHOD DETAILS Construction of genomically-edited strains
Endogenous tagging of the C-terminus of unc-6 with the mNG::3xFLAG sequence was accomplished using CRISPR/Cas9-mediated genome editing using a homologous repair template containing 500bp homology arms, the mNG::3XFLAG, and a selection markers as described previously ( Dickinson et al., 2015 ). For unc-6 we used a guide RNA (sgRNA) with a targeting sequence of 5’- TATCTGTGTGACGTAATCTCTGG-3’. GFP was similarly knocked into the dgn-1 locus by CRISPR/Cas9-triggered homologous recombination using a homologous repair template with a selectable marker, GFP, and 1.7kb homology arms at the HindIII site 7 amino acids upstream of the stop codon ( Johnson et al., 2006 ) using two sgRNA targeting sequences, 5’- GATGAAGCATGTcCGAGACGCGG-3’ (antisense) and 5’-GCCAGCAACTCTCCGCGTCTCGG-3’ (sense). Silent mutations were introduced into the homology arms using site directed mutagenesis. See Table S3 for homology arm oligonucleotide primer sequences. For construction of both genome edited strains, the sgRNA targeting sequences were cloned into the pDD162 Cas9-sgRNA expression vector for C. elegans . The homologous repair template and Cas9-sgRNA plasmids were coinjected into the gonad of young adult N2 worms. Animals that were recombinant were identified in the F3 offspring of injected animals based on the presence of selectable markers (dominant-negative sqt-1 rol phenotype and hygromycin resistance). Following strain isolation, the selectable markers were removed from the genome through Cre-Lox recombination and proper genome editing was confirmed by amplification and sequencing of the edited region.
Show full methods section
CONTACT FOR REAGENT AND RESOURCE SHARING
Further information and requests for resources and reagents should be directed to and will be fulfilled by the Lead Contact, David R. Sherwood ( david.sherwood@duke.edu ).
EXPERIMENTAL MODEL AND SUBJECT DETAILS
C. elegans strains were maintained on standard NGM media and fed E. coli OP50. For RNAi experiments, wild type controls were fed E. coli HT115(DE3) containing L4440 (see RNAi experiments, STAR Methods). Unless otherwise noted, all strains were maintained at 20°C. All animals scored were hermaphrodites during the L3 stage when the anchor cell (AC) invades. AC invasion was precisely staged in reference to VPC divisions and gonad development as previously described ( Sherwood et al., 2005 ). Briefly, the AC is positioned over the central P6.p vulval precursor cell cell prior to invasion in the early L3 larval stage. During the mid L3 stage the P6.p cell divides once (P6.p 2-cell stage). At the late P6.p 2-cell stage the AC initiates BM breach (near the time with the distal tip cells of the gonad arm begin migrating dorsally). At the P6.p 2-to-4-cell transition (when the P6.p daughters divide) the AC protrusion forms and clears an opening in the basement membrane and extends around and between the P6.p vulval precursor cell descendants. At the early P6.p 4-cell stage (mid-to-late L3 stage), the protrusion retracts back into the AC ( Figure 1A ).
METHOD DETAILS Construction of genomically-edited strains
Endogenous tagging of the C-terminus of unc-6 with the mNG::3xFLAG sequence was accomplished using CRISPR/Cas9-mediated genome editing using a homologous repair template containing 500bp homology arms, the mNG::3XFLAG, and a selection markers as described previously ( Dickinson et al., 2015 ). For unc-6 we used a guide RNA (sgRNA) with a targeting sequence of 5’- TATCTGTGTGACGTAATCTCTGG-3’. GFP was similarly knocked into the dgn-1 locus by CRISPR/Cas9-triggered homologous recombination using a homologous repair template with a selectable marker, GFP, and 1.7kb homology arms at the HindIII site 7 amino acids upstream of the stop codon ( Johnson et al., 2006 ) using two sgRNA targeting sequences, 5’- GATGAAGCATGTcCGAGACGCGG-3’ (antisense) and 5’-GCCAGCAACTCTCCGCGTCTCGG-3’ (sense). Silent mutations were introduced into the homology arms using site directed mutagenesis. See Table S3 for homology arm oligonucleotide primer sequences. For construction of both genome edited strains, the sgRNA targeting sequences were cloned into the pDD162 Cas9-sgRNA expression vector for C. elegans . The homologous repair template and Cas9-sgRNA plasmids were coinjected into the gonad of young adult N2 worms. Animals that were recombinant were identified in the F3 offspring of injected animals based on the presence of selectable markers (dominant-negative sqt-1 rol phenotype and hygromycin resistance). Following strain isolation, the selectable markers were removed from the genome through Cre-Lox recombination and proper genome editing was confirmed by amplification and sequencing of the edited region.
Construction of fusion proteins
GFP::CAAX was amplified from pSA129 and then cloned into pBlueScript containing 1.5kb AC-regulatory region of the C. elegans cdh-3 promoter at SalI and SacI sites (see Table S3 for oligonucleotide sequences) ( Sherwood et al., 2005 ). The AC-specific endoplasmic reticulum marker cdh-3>cytb-5.1::GFP was constructed by PCR fusion. A 3.0kb fragment of the full length cytb-5.1 sequence, GFP, and the let-858 3’UTR from pHD189 was fused with a 2.2kb fragment of the cdh-3 promoter region amplified from pPD107.94 (see Table S3 for oligonucleotide sequences). The AC-specific Golgi apparatus marker cdh-3>aman-2::GFP was constructed by PCR fusion. A 2.3kb fragment of aman-2 , GFP, and the let-858 3’UTR from pHD93 was fused with a 2.2kb fragment of the cdh-3 promoter region amplified from pPD107.94 (see Table S3 for oligonucleotide sequences). Fusion of the lin-29 promoter (5.4kb, see Table S3 ) to the snap-29 open reading frame starting from the ATG translation start site amplified from C. elegans genomic DNA (1.3kb) and mCherry from a modified pBlueScript (0.9kb) was accomplished by Gibson assembly using pBlueScript as a backbone (3.6kb). Exocyst components ( exoc-8, exoc-7, sec-15 , and sec-5 ) fused to GFP previously ( Zou et al., 2015 ) were amplified from their corresponding plasmids and fused to 1.7kb of the cdh-3 promoter amplified from pBlueScript by PCR fusion (see Table S3 for oligonucleotide sequences). A 0.9kb fragment of LMP-1 encompassing the complete open reading frame from the ATG translation start site was amplified using genomic DNA (see Table S3 for oligonucleotide sequences) was cloned into pBlueScript containing zmp-1 >mCherry at AgeI and PacI sites to generate zmp-1 >LMP-1::mCherry. The snap-29 >GFP transcriptional reporter was generated from 1.4kb of sequence 5’ of the snap-29 transcription start site expressed as an extrachromosomal array (see Table S3 for oligonucleotide sequences). The zmp-1 >GFP::ZMP-1-GPI construct was generated by amplifying the zmp-1 GPI membrane targeting sequence (an 84 base pair fragment encompassing the final 28 amino acids of zmp-1; see Table S3 for oligonucleotide sequences) from genomic DNA and cloning this fragment into pBlueScript containing GFP using EcoRV and NotI sites. The resulting GFP::GPI sequence was then amplified with oligonucleotides for GFP::GPI (forward) and the unc-54 3’ UTR (reverse) and joined to the 2.7kb of sequence 5’ of the zmp-1 transcription start site and the zmp-1 signal sequence (first 66 amino acids) by PCR fusion. All constructs were injected into the syncytial gonads of young adult unc-119 (ed4) hermaphrodites along with 50ng/µL unc-119 rescue DNA, 50ng/µL pBSSk(−), and 50ng/µL EcoRI-digested salmon sperm DNA. F1 animals were selected for recovery of wild type animal movement (rescue of the unc-119 phenotype), and stable lines were selected based on transmission of stable extrachromosomal transgenes into the F2 generation. Integrated lines were generated by gamma irradiation as previously described ( Sherwood et al., 2005 ). Briefly, approximately 50 young adult hermaphrodites carrying the extrachromosomal transgenes were irradiated with 3800rad of γ irradiation from Cesium-137 of and rescued to plates to produce progeny. F1 animals (5 per parent) exhibiting rescue of the unc-119 phenotype were singled to NGM plates. Plates that showed 100% rescue of the unc-119 phenotype in the F2 were considered stable integrants, evaluated for transgene expression, and then backcrossed into strain N2.
Microscopy and image acquisition
All time-lapse and polarity images were acquired using an EM-CCD or Orca-R 2 camera (Hamamatsu Photonics) and a spinning disk confocal microscope (CSU-10, Yokogawa) mounted on an upright AxioImager microscope (Carl Zeiss) with a Plan-APOCHROMAT 100×/1.4 oil differential interference contrast objective controlled by µmanager software (version 1.4) ( Edelstein et al., 2010 ). Time-lapse acquisition was performed as described previously ( Kelley et al., 2017 ). Synchronized L3 hermaphrodites were anesthetized in 0.2% tricine and 0.02% levamisole in M9 for 20 minutes and then transferred to 5% noble agar pads. The cover slip was sealed with VALAP and worms were imaged at 23°C for two hours. For protrusion analysis, confocal stacks of marked ACs with protrusions (23 optical slices, each at 0.5µm thickness) were acquired every five minutes to avoid photobleaching. Some time-lapses were acquired every minute to construct movies with better temporal resolution. For single-timepoint AC snapshots and all scoring of AC invasion, worms were anesthetized on 5% noble agar pads with 0.01M sodium azide. Fluorescence images of the AC were acquired as confocal z-stacks with 0.5µm optical slices spanning the entire cell. Images of ACs on rab-11.1 (RNAi) and wild type controls ( Figure S3A ) were acquired on a Zeiss AxioImager A1 microscope with a 100× plan-apochromat objective and Zeiss AxioCam MRm CCD camera controlled by Zeiss Axiovision software (Zeiss Microimaging). RNAi experiments RNAi was delivered by feeding worms E. coli feeding strain HT115(DE3) expressing double-stranded RNA ( Fire et al., 1998 ). Bacteria harboring an empty RNAi vector ( L4440 ) was used as a negative control for all RNAi experiments. RNAi clones targeting C. elegans genes originated from the C. elegans ORF-RNAi Collection V1.1 (Open Biosystems) and an RNAi library constructed by the Ahringer lab ( Fraser et al., 2000 ). Transcription of RNAi vector expression was induced with 1mM Isopropyl β-D-1-thiogalactopyranoside (IPTG) and cultures were plated on plates containing NGM and topical application of 5µL each of 30mg/mL carbenicillin and 1M IPTG. Synchronized L1-arrested larvae were plated on the RNAi-expressing HT115(DE3) and grown for 40–48 hours at 16°C before scoring. RNAi that produced phenotypes were sequenced to verify correct insert. For uterine-specific RNAi experiments, the strain NK1316 was utilized ( Haerty et al., 2008 ; Hagedorn et al., 2009 ). The strain harbors mutations in rrf-3 (pk1426) , an RNA-directed RNA polymerase whose loss sensitizes the worms to RNAi, as well as rde-1 (ne219) , an argonaute protein required for RNAi ( Hagedorn et al., 2009 ). Expression of rde-1 in the somatic uterine cells ( fos-1a>rde-1 ) specifically restores RNAi in the uterine cells.
Electron microscopy
Transmission electron micrographs were acquired in serial sections as described previously ( Hall et al., 2012 ; Morrissey et al., 2014 ). L3 worms were anesthetized with 1% phenyl-isopropanol in fixative buffer and then fixed in 2.5% glutaldehyde, 1.5% paraformaldehyde in 0.1M Na-cacodylate buffer. Worms were cut open in the head or tail region and incubated for 2.5 hours. Samples were then washed three times in 0.1M Na-cacodylate buffer, stained in 1% UAC in 0.1M Na-acetate buffer, and then washed once in Na-acetate buffer and twice in Na-cacodylate buffer. Worms were then embedded in 3% agarose and dehydrated in ethanol. Samples were then embedded in Embed812 resin and propylene oxide solutions followed by embedding in 100% Embed812 resin for two days. Samples were then incubated at 60°C for 2 days. Longitudinal sections were cut across the gonad to allow for evaluation of the tissue to establish precise developmental stage and to identify the anchor cell. Images were then acquired on a Philips CM12 transmission electron microscope.
QUANTIFICATION AND STATISTICAL ANALYSIS Image processing and AC protrusion volume
Acquisition of images is described above in “Microscopy and Image Acquisition”. Acquired confocal z-stack images were processed with Fiji (ImageJ 1.51f) and Photoshop (CC 2015; Adobe) ( Schindelin et al., 2012 ). Time-lapse analysis and 3D reconstructions of protrusion formation and growth were built from confocal z-stacks, analyzed, and exported using Imaris 7.6.5 (Bitplane, Inc). Importantly, in some instances out-of-focus fluorescence from intense membrane signal above the protrusion was captured in slices. This signal was clearly distinguished and excluded from the relevant slices (and thus volume analysis), but this out-of-focus fluorescence in some instances appeared to broaden and obscure the edges of the protrusion in 3D Imaris renderings. Supplementary movies were exported at 20 frames per second as .mp4 files using the 3D reconstructions of time-lapse data in the Imaris 7.6.5 Animation module with key frames designated every 20 minutes. Invasive protrusion volume and total AC volume were calculated as previously described by our laboratory ( Kelley et al., 2017 ). In time-lapses, AC protrusion volume was calculated by hand-tracing the protrusion (the region of the AC extending below the BM) in each slice to generate an isosurface for each time point in Imaris 7.6.5. All rates of invasive protrusion expansion were calculated over the first thirty minutes of time-lapse image series following BM breach (images collected every five minutes, see above), as this was the time period of maximal growth of the invasive protrusion. The difference in protrusion volume at the time of initial breach was subtracted from the size of the protrusion thirty minutes after breach; this difference was then divided by the time that transpired (30 minutes) to obtain a rate of expansion for each animal observed. For surface area and volume measurements of the entire AC, isosurfaces were generated in Imaris by manual thresholds of fluorescence intensity using 0.300µm surface detail. The volume of the invasive protrusion in these comparisons ( Figure S1C ) was then calculated by using the Imaris isosurface slicer tool to cut the AC isosurface at the AC-BM junction, thus separating the AC from the invasive protrusion. In comparisons across stages of invasion (P6.p 2-cell, P6.p 2/4-cell transition, and P6.p 4-cell stages), AC surface area or volume was normalized to average AC surface area or volume for ACs of the corresponding genotype before invasion (P6.p 2-cell stage). In dominant negative integrin ( zmp-1>HA-βtail ) animals, AC invasion is delayed, so data were collected from ACs that breached the BM at the P6.p 8-cell stage before the BM hole expanded beyond the AC. Three strains were used for invasive protrusion analysis: NK881 (AC labeled with qyIs166 ( cdh-3 >GFP::CAAX), Figure 1 ), NK361 (AC labeled with qyIs24 ( cdh-3 >mCherry::PLCδ PH , Figure 4 ), and NK1316 (uterine-specific RNAi line with the AC labeled with qyIs24 ( cdh-3 >mCherry::PLCδ PH , Figures 2 , 3 , and 6 ). We found that strains NK881 and NK361 showed slightly faster rates of protrusion formation (0.47 and 0.48um 3 /min) while the uterine specific line was a little slower (0.35um 3 /min), although the rate was not statistically different (p>0.05, Student's t -test).
Analysis of AC polarity
AC polarity measurements were generated from background-subtracted sum projections of the AC using Fiji. Polarity was measured using a 5-pixel wide line tracing the invasive membrane (P6.p 2-cell stage) or invasive protrusion membrane (P6.p 2/4-cell transition) from centermost image slices. This value was then divided by the mean intensity of a 5-pixel wide line tracing the apical membrane of the AC in its centermost slice to determine fold enrichment of fluorescently tagged proteins at the invasive cell membrane. ImageJ macros which semi-automate this method of polarity measurement is available upon request.
Colocalization analysis
Colocalization analysis was performed in Fiji as described previously by our laboratory ( Wang et al., 2014 ). The centermost slice of the AC was selected from confocal z-stacks with signal from two fluorophores. A 3-pixel wide line was drawn through the AC membrane and the absolute intensity of each fluorophore was measured every 0.15µm along this line (reported by Fiji as Integrated Density). The intensity profile for each fluorophore was then normalized to the maximum measured intensity of that fluorophore along the line. Fluorescence loss in photobleaching (FLIP) Images from fluorescence loss in photobleaching (FLIP) experiments were collected using a point scanning confocal microscope (Zeiss 780; Carl Zeiss) with a GaAsP high QE 32 channel spectral array detector with a 63×/1.4 oil Plan-Apochromat objective (Carl Zeiss) controlled by Zen software (version 2010; Carl Zeiss). Synchronized L3 hermaphrodites were anesthetized and prepared for imaging as described for time-lapse acquisition above. The FLIP region of interest (ROI) was a 25-pixel (approximately 1µm) diameter circle placed on the perimeter of the AC along either the apical membrane of invasive protrusion membrane. Four cycles of z-stack images were acquired at 18 second intervals at with 1.0µm slice thickness for 14 slices centered on the AC. Each cycle of acquisition was followed by a cycle of photobleaching of the FLIP ROI. Bleaching was performed at 100% laser power with 25 iterations. All quantifications for FLIP experiments were performed in Fiji. Relative GFP loss was calculated by subtracting the pixel values of a sum projection of the AC taken at the fourth acquisition cycle (three cycles of bleaching performed every 18 seconds, then a fourth acquisition performed 54 seconds from acquisition start) from the corresponding pixel values of a sum AC projection taken at the first acquisition cycle (before any photobleaching). The resulting difference was then divided by the initial pixel intensity from the first acquisition cycle to generate a relative rate of loss. Regions for FLIP ratios were established by drawing a 3-pixel wide line across the AC to separate the two halves (for P6.p 2-cell and 8-cell controls) or by drawing a 3-pixel wide line across the AC at the neck of the invasive protrusion. The average rate of loss of the two AC regions was calculated from the relative rates of loss of the pixels in each region. FLIP ratios display the quotient of the average of the region with the photobleaching ROI (Region X) divided by the average of the region without the photobleaching ROI (Region Y). Spectral images for display purposes were generated by adding a background value of 100 to each pixel of the first acquisition cycle to eliminate background noise before the calculation of relative loss and applying the Fire lookup table in Fiji with constrained pixel ranges from 0.00 to 0.50. The resulting image was then smoothed for display. An ImageJ macro which automates this process is available upon request.
Calculation of basement membrane hole opening rates
Rates of BM hole expansion were quantified as published previously by our laboratory ( Kelley et al., 2017 ). Time-lapse image series of AC protrusion formation acquired as described above were reconstructed in 3D using Imaris 7.6.5 (Bitplane, Inc.) The 3D-rendered BM was rotated 90° about the anterior-posterior axis of the worm to view the ventral surface of the animal. The signal from the BM fluorescence channel only was then exported as a .TIFF series. This series was opened in Fiji and BM hole size was then analyzed at five minute intervals through the time-lapse series by manually thresholding the BM hole and measuring the area of the thresholded region.
Blinding and unbiasing of data
For polarity and fluorophore intensity measurements, data sets were randomized using an ImageJ macro (courtesy of Martin Hoehne) to blind analysis. For samples in which blind analysis was not possible, randomly-selected samples were chosen for re-analysis to confirm precision of measurements.
Statistical analysis and data presentation
Statistical analyses were performed using JMP version 12.0 (SAS Institute). For all figure legends, asterisks indicate statistical significance as follows: n.s. = not significant (p>0.05); * pmCherry at AgeI and PacI sites to generate zmp-1 >LMP-1::mCherry. The snap-29 >GFP transcriptional reporter was generated from 1.4kb of sequence 5’ of the snap-29 transcription start site expressed as an extrachromosomal array (see Table S3 for oligonucleotide sequences). The zmp-1 >GFP::ZMP-1-GPI construct was generated by amplifying the zmp-1 GPI membrane targeting sequence (an 84 base pair fragment encompassing the final 28 amino acids of zmp-1; see Table S3 for oligonucleotide sequences) from genomic DNA and cloning this fragment into pBlueScript containing GFP using EcoRV and NotI sites. The resulting GFP::GPI sequence was then amplified with oligonucleotides for GFP::GPI (forward) and the unc-54 3’ UTR (reverse) and joined to the 2.7kb of sequence 5’ of the zmp-1 transcription start site and the zmp-1 signal sequence (first 66 amino acids) by PCR fusion. All constructs were injected into the syncytial gonads of young adult unc-119 (ed4) hermaphrodites along with 50ng/µL unc-119 rescue DNA, 50ng/µL pBSSk(−), and 50ng/µL EcoRI-digested salmon sperm DNA. F1 animals were selected for recovery of wild type animal movement (rescue of the unc-119 phenotype), and stable lines were selected based on transmission of stable extrachromosomal transgenes into the F2 generation. Integrated lines were generated by gamma irradiation as previously described ( Sherwood et al., 2005 ). Briefly, approximately 50 young adult hermaphrodites carrying the extrachromosomal transgenes were irradiated with 3800rad of γ irradiation from Cesium-137 of and rescued to plates to produce progeny. F1 animals (5 per parent) exhibiting rescue of the unc-119 phenotype were singled to NGM plates. Plates that showed 100% rescue of the unc-119 phenotype in the F2 were considered stable integrants, evaluated for transgene expression, and then backcrossed into strain N2.
Microscopy and image acquisition
All time-lapse and polarity images were acquired using an EM-CCD or Orca-R 2 camera (Hamamatsu Photonics) and a spinning disk confocal microscope (CSU-10, Yokogawa) mounted on an upright AxioImager microscope (Carl Zeiss) with a Plan-APOCHROMAT 100×/1.4 oil differential interference contrast objective controlled by µmanager software (version 1.4) ( Edelstein et al., 2010 ). Time-lapse acquisition was performed as described previously ( Kelley et al., 2017 ). Synchronized L3 hermaphrodites were anesthetized in 0.2% tricine and 0.02% levamisole in M9 for 20 minutes and then transferred to 5% noble agar pads. The cover slip was sealed with VALAP and worms were imaged at 23°C for two hours. For protrusion analysis, confocal stacks of marked ACs with protrusions (23 optical slices, each at 0.5µm thickness) were acquired every five minutes to avoid photobleaching. Some time-lapses were acquired every minute to construct movies with better temporal resolution. For single-timepoint AC snapshots and all scoring of AC invasion, worms were anesthetized on 5% noble agar pads with 0.01M sodium azide. Fluorescence images of the AC were acquired as confocal z-stacks with 0.5µm optical slices spanning the entire cell. Images of ACs on rab-11.1 (RNAi) and wild type controls ( Figure S3A ) were acquired on a Zeiss AxioImager A1 microscope with a 100× plan-apochromat objective and Zeiss AxioCam MRm CCD camera controlled by Zeiss Axiovision software (Zeiss Microimaging). RNAi experiments RNAi was delivered by feeding worms E. coli feeding strain HT115(DE3) expressing double-stranded RNA ( Fire et al., 1998 ). Bacteria harboring an empty RNAi vector ( L4440 ) was used as a negative control for all RNAi experiments. RNAi clones targeting C. elegans genes originated from the C. elegans ORF-RNAi Collection V1.1 (Open Biosystems) and an RNAi library constructed by the Ahringer lab ( Fraser et al., 2000 ). Transcription of RNAi vector expression was induced with 1mM Isopropyl β-D-1-thiogalactopyranoside (IPTG) and cultures were plated on plates containing NGM and topical application of 5µL each of 30mg/mL carbenicillin and 1M IPTG. Synchronized L1-arrested larvae were plated on the RNAi-expressing HT115(DE3) and grown for 40–48 hours at 16°C before scoring. RNAi that produced phenotypes were sequenced to verify correct insert. For uterine-specific RNAi experiments, the strain NK1316 was utilized ( Haerty et al., 2008 ; Hagedorn et al., 2009 ). The strain harbors mutations in rrf-3 (pk1426) , an RNA-directed RNA polymerase whose loss sensitizes the worms to RNAi, as well as rde-1 (ne219) , an argonaute protein required for RNAi ( Hagedorn et al., 2009 ). Expression of rde-1 in the somatic uterine cells ( fos-1a>rde-1 ) specifically restores RNAi in the uterine cells.
Electron microscopy
Transmission electron micrographs were acquired in serial sections as described previously ( Hall et al., 2012 ; Morrissey et al., 2014 ). L3 worms were anesthetized with 1% phenyl-isopropanol in fixative buffer and then fixed in 2.5% glutaldehyde, 1.5% paraformaldehyde in 0.1M Na-cacodylate buffer. Worms were cut open in the head or tail region and incubated for 2.5 hours. Samples were then washed three times in 0.1M Na-cacodylate buffer, stained in 1% UAC in 0.1M Na-acetate buffer, and then washed once in Na-acetate buffer and twice in Na-cacodylate buffer. Worms were then embedded in 3% agarose and dehydrated in ethanol. Samples were then embedded in Embed812 resin and propylene oxide solutions followed by embedding in 100% Embed812 resin for two days. Samples were then incubated at 60°C for 2 days. Longitudinal sections were cut across the gonad to allow for evaluation of the tissue to establish precise developmental stage and to identify the anchor cell. Images were then acquired on a Philips CM12 transmission electron microscope.
Supplementary Material 1 2 Movie S1. Formation of the AC invasive protrusion is UNC-40 (DCC) dependent, Related to Figure 1 Time-lapses show protrusion extension through the BM (laminin::mCherry, purple, shown in first and last frames) in a wild type (left, membrane marker cdh-3 >GFP::CAAX) and a unc-40 mutant animal (right), in which the AC breaches the BM but does not extend a protrusion. Images were acquired using a spinning disc confocal microscope (CSU-10 scan head; Yokogawa, mounted on a Zeiss AxioImager compound microscope). Movies are 90 min. and were constructed from projections of 0.5µm z-sections. Time points in the wild type (left) were acquired in 1-min. intervals and in the unc-40 mutant (right) in 2-min. intervals. The video corresponds to the animals shown in Figure 1B . 3 Movie S2. The kinase PPK-3 promotes protrusion formation, Related to Figure 2 Time-lapses show protrusion extension through the BM (laminin::mCherry, purple, shown in first and last frames) in a wild type (left, membrane marker cdh-3 >mCherry::PLCδ P H ) and ppk-3 (RNAi) (right) treated animal, in which the AC breaches the BM, but fails to form a large protrusion. Images were acquired using a spinning disc confocal microscope (CSU-10 scan head; Yokogawa, mounted on a Zeiss AxioImager compound microscope). Movies were constructed from projections of 0.5µm z-sections. Movies are 90 min., with time points acquired at 2-min. intervals. The video corresponds to the animals shown in Figure 2C . 4 Movie S3. The t-SNARE SNAP-29 facilitates rapid protrusion formation, Related to Figure 3 Time-lapses show protrusion extension through the BM (laminin::mCherry, purple, shown in first and last frames) in a wild type (left, membrane marker cdh-3 >mCherry::PLCδ P H ) and snap-29 (RNAi) (right) treated animal, in which the AC breaches the BM, but the protrusion forms at a reduced rate. Images were acquired using a spinning disc confocal microscope (CSU-10 scan head; Yokogawa, mounted on a Zeiss AxioImager compound microscope). Movies were constructed from projections of 0.5µm z-sections. Movies are 120 min. The wild type (left) time-lapse was acquired in 5-min. intervals and the snap-29 (RNAi) in 2-min. intervals. The video corresponds to the animals shown in Figure 3D . 5 Movie S4. The exocyst complex promotes protrusion formation, Related to Figure 4 Time-lapses show protrusion extension through the BM (laminin::mCherry, purple, shown in first and last frames) in a wild type (left, membrane marker cdh-3 >mCherry::PLCδ P H ) and exoc-8 (ok2523) mutant (right), in which the AC breaches the BM, but the AC fails to form a large protrusion. Images were acquired using a spinning disc confocal microscope (CSU-10 scan head; Yokogawa, mounted on a Zeiss AxioImager compound microscope). Movies were constructed from projections of 0.5µm z-sections. Movies are 90 min. The wild type (left) time-lapse was acquired in 2-min. intervals and the exoc-8 mutant in 1-min. intervals. The video corresponds with the animals shown in Figure 4A . 6 Movie S5. The BM receptor dystroglycan is required for protrusion formation, Related to Figure 6 Time-lapses show protrusion extension through the BM (laminin::mCherry, purple, shown in first and last frames) in a wild type (left, membrane marker cdh-3 >mCherry::PLCδ P H ) and a dgn-1 (RNAi) (right) treated animal, in which the AC breaches the BM, but the AC does not form a large invasive protrusion. Images were acquired using a spinning disc confocal microscope (CSU-10 scan head; Yokogawa, mounted on a Zeiss AxioImager compound microscope). Movies were constructed from projections of 0.5µm z-sections. Movies are 90 min. and were acquired in 5-min. intervals. The video corresponds to the animals shown in Figure 6D . 7
📊 Figures
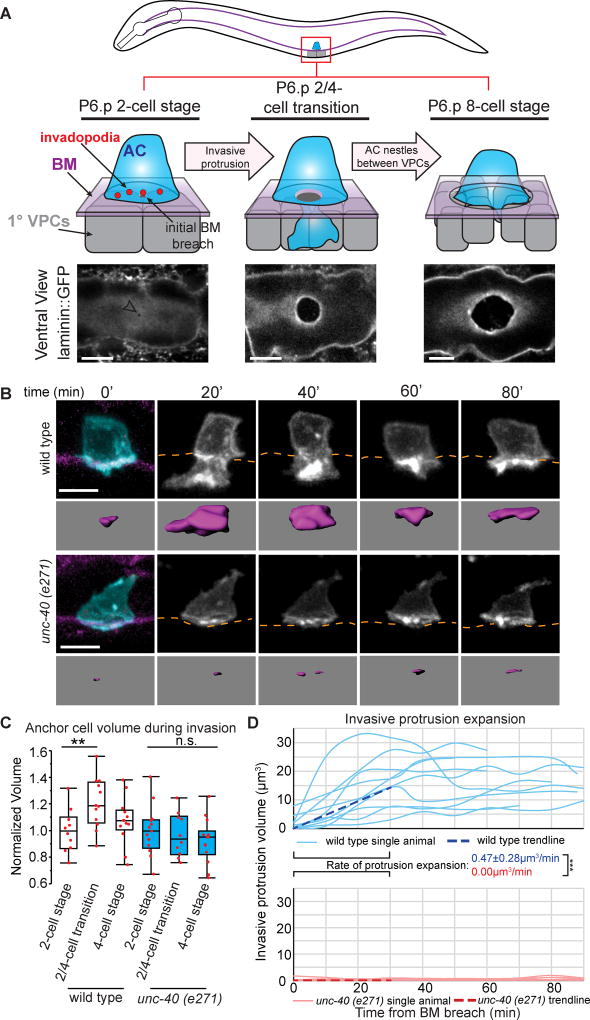
Figure 1
The invasive protrusion locally increases AC area and volume
(A) AC invasion in C. elegans (top, lateral view schematic; bottom, ventral view of laminin::GFP-labeled BM). Left: During the early L3 larval stage, the AC (blue) sits atop the BM (purple) and the tw...
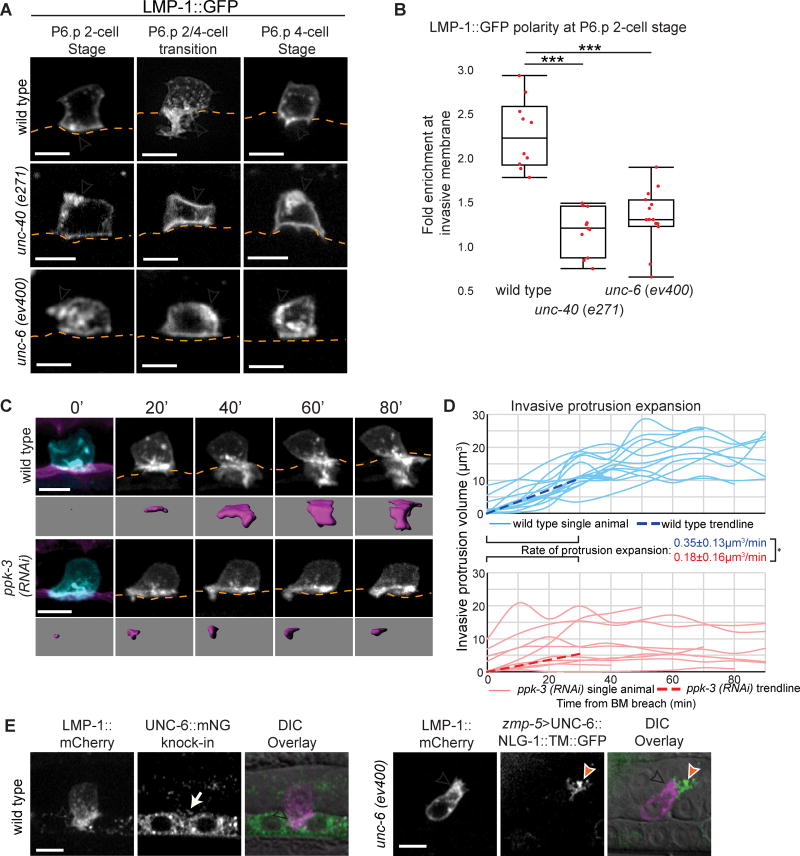
Figure 2
UNC-6 (netrin) polarizes lysosomes to build the invasive protrusion
(A) Lysosomes (LMP-1::GFP) in the ACs of wild type (top), unc-40 (e271) (middle), and unc-6 (ev400) (bottom) animals before protrusion formation (P6.p 2-cell stage), during protrusion expansion (P6.p ...
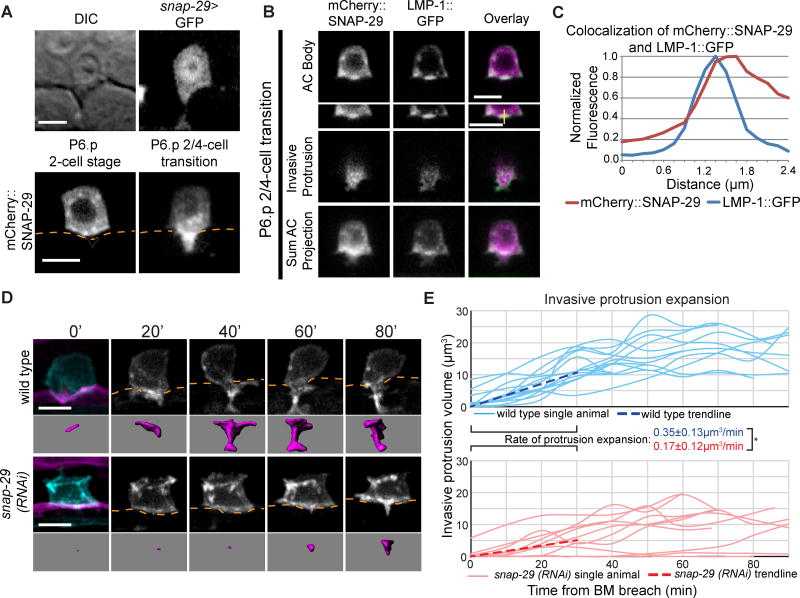
Figure 3
The t-SNARE SNAP-29 facilitates invasive protrusion expansion
(A) A snap-29 transcriptional reporter ( snap-29 >GFP; top right) expressed in the AC. An AC expressed translational reporter ( cdh-3 >mCherry::SNAP-29; bottom) is polarized (arrowheads) to the invasi...
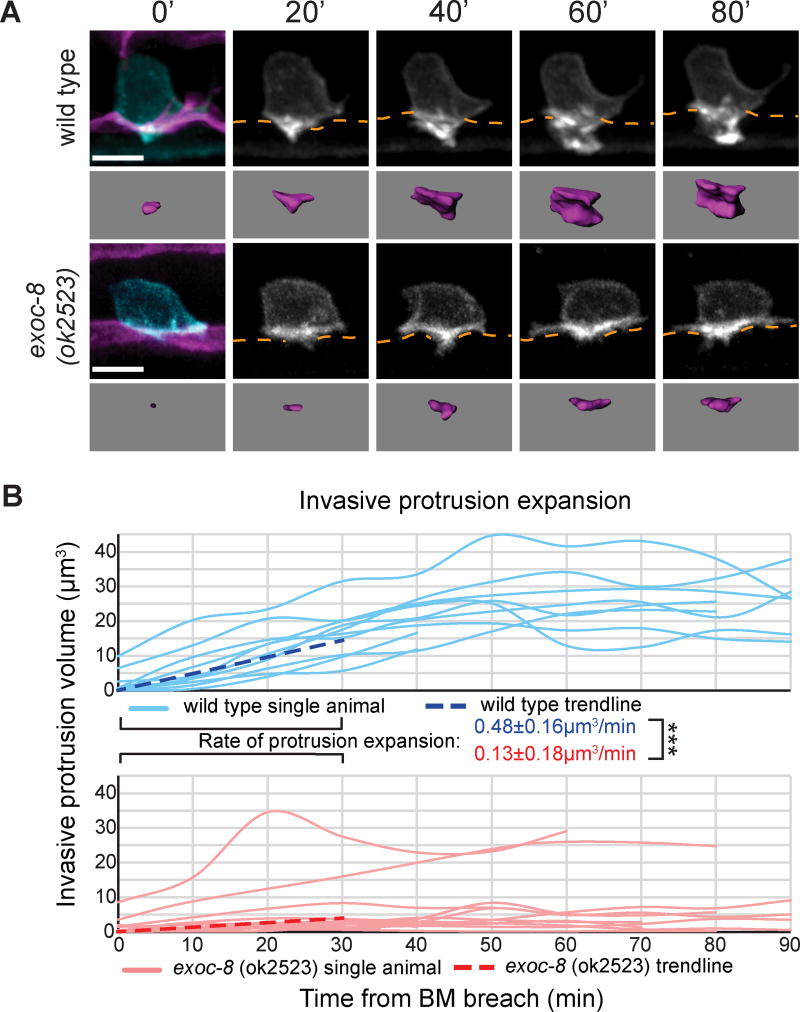
Figure 4
The exocyst complex promotes invasive protrusion formation
(A) Time-lapse of AC protrusion formation. AC membrane labeled by cdh-3 >mCherry::PLCu03b4 P H , blue and greyscale, purple isosurface below; BM (laminin::GFP, magenta) position shown by orange dotted...
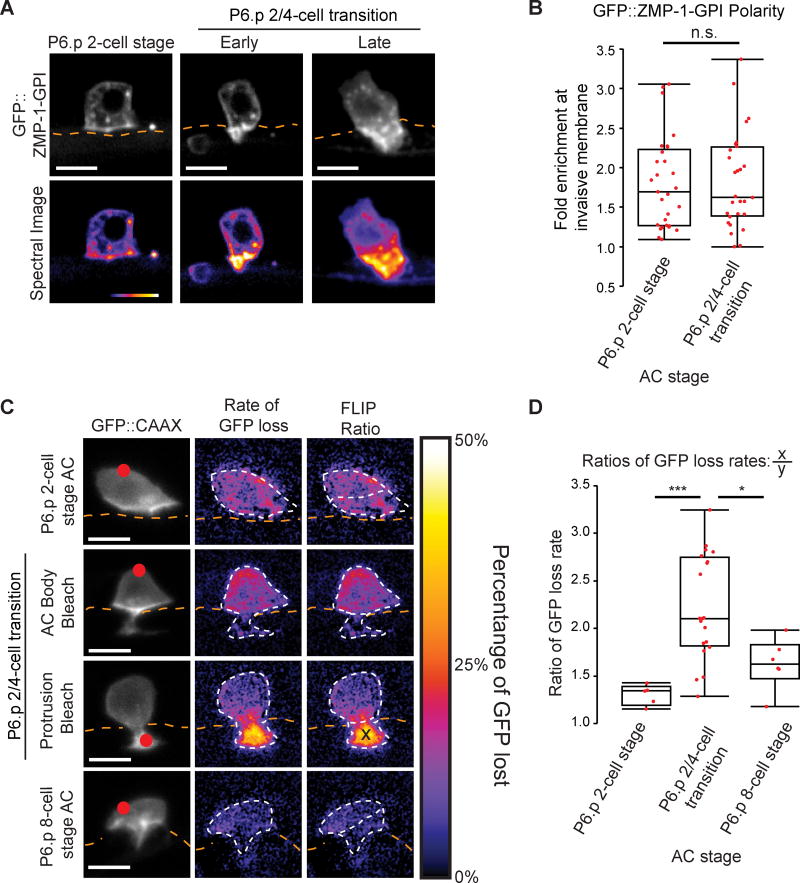
Figure 5
The invasive protrusion is a segregated membrane domain
(A) A reporter of ZMP-1 localization ( zmp-1 >GFP::ZMP-1-GPI) (top) and corresponding spectral representation of fluorescence intensity (bottom) shows that ZMP-1 becomes highly concentrated in the inv...
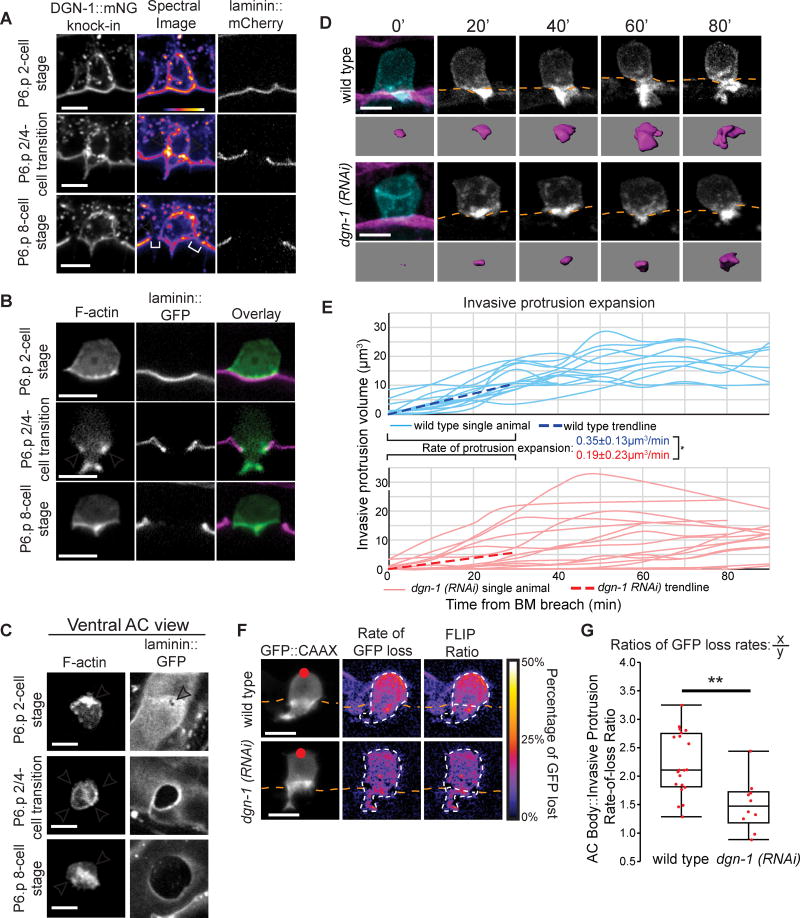
Figure 6
The BM receptor dystroglycan (DGN-1) forms a membrane diffusion barrier that promotes protrusion formation
(A) ACs expressing dgn-1::mNG (dgn-1 qy18) (left) and spectral representations of fluorescence intensity (center), with BM (laminin::GFP, right). DGN-1::mNG protein localizes to the invasive membrane ...
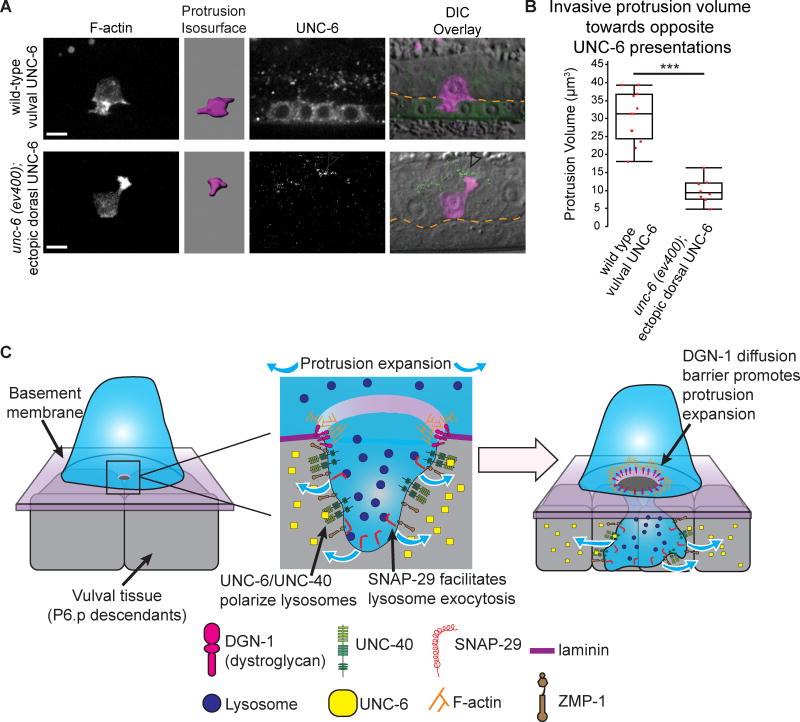
Figure 7
The BM is a scaffold for protrusion growth
(A) F-actin ( cdh-3 >mCherry::moesinABD; left) marks the invasive protrusion (purple isosurface), UNC-6 (center), and overlay on DIC (right, BM position, orange). Endogenous UNC-6 (top) and dorsal ute...
Figure images are served from the NIH/NLM PubMed Central Open Access Subset or Europe PMC; copyright remains with the publishers and authors.
💬 Discussion
0 commentsNo comments yet. Be the first to start a discussion!
Leave a Comment