Abstract
Genetically-encoded calcium indicators (GECIs) hold the promise of monitoring [Ca(2+)] in selected populations of neurons and in specific cellular compartments. Relating GECI fluorescence to neuronal activity requires quantitative characterization. We have characterized a promising new genetically-encoded calcium indicator-GCaMP2-in mammalian pyramidal neurons. Fluorescence changes in response to single action potentials (17+/-10% DeltaF/F [mean+/-SD]) could be detected in some, but not all, neurons. Trains of high-frequency action potentials yielded robust responses (302+/-50% for trains of 40 action potentials at 83 Hz). Responses were similar in acute brain slices from in utero electroporated mice, indicating that long-term expression did not interfere with GCaMP2 function. Membrane-targeted versions of GCaMP2 did not yield larger signals than their non-targeted counterparts. We further targeted GCaMP2 to dendritic spines to monitor Ca(2+) accumulations evoked by activation of synaptic NMDA receptors. We observed robust DeltaF/F responses (range: 37%-264%) to single spine uncaging stimuli that were correlated with NMDA receptor currents measured through a somatic patch pipette. One major drawback of GCaMP2 was its low baseline fluorescence. Our results show that GCaMP2 is improved from the previous versions of GCaMP and may be suited to detect bursts of high-frequency action potentials and synaptic currents in vivo.
🔬 Techniques
💻 Software
✨ Fluorophores
🧪 Sample Preparation
🔬 Cell Lines
🏭 Microscope Brands
🧪 Reagent Suppliers
🔴 Lasers
📷 Detectors
🎨 Filters
💻 Software Details
🏛️ Research Organizations (ROR)
Affiliated research institutions:
📋 Methods
Molecular biology The original GCaMP2 expression construct was obtained from M. Kotlikoff, and generated by J. Nakai [24] ; TN-XL from O. Griesbeck (MPI, Germany) [21] ; Yellow Cameleon Y3.60 from A. Miyawaki (RIKEN, Japan) [25] . All of the above constructs were driven by the CMV promoter in mammalian expression vectors. GCaMP2 was subcloned into the pCAGGS vector with the CAG promoter (CMV-enhancer, β-actin promoter, and regulatory element from the woodchuck hepatitis virus (WPRE) [48] ). Subcellularly targeted constructs were driven by the CAG promoter. Three membrane-targeted versions of GCaMP2 were generated: (1) the first 41 amino acids of human MARCKS domain mutant (Met1-Val41) [49] , which is myristoylated at Gly2 and double palmitoylated at Cys3Cys4, fused to the N-terminus of GCaMP2 (linker sequence AAAT); (2) a short MARCKS domain (Met1-Lys7) fused to the N-terminus of GCaMP2 (linker sequence AAAT); (3) the human hCD4 transmembrane protein (Met1-Arg421) fused to the N-terminus of GCaMP2 (linker sequence AAAT). To target GCaMP2 postsynaptically, chick actin was fused to the C-terminus of GCaMP2 [50] (linker sequence GGR). MCherry [34] , which we used to co-transfect with GECIs, is in a pRK5 vector and a pCAGGS vector, for cultured hippocampal slices and in utero electroporation, respectively.
Gene transfection and slice preparation
Hippocampal cultured slices were prepared from P7 rats as described [31] . Slices were transfected using gold particle-mediated biolistic gene transfer (Helios Gene Gun, BioRad) at 4–8 days in vitro. The amount of DNA used in each bullet preparation was between 1–20 µg per full length of tubing. All GECIs except FRET-based GECIs were co-transfected with mCherry to aid identification of GECI-expressing cells. Imaging experiments were performed 36–48 hours after the transfection. For the acute slice experiments shown in Figure 3B , GCaMP2 and mCherry DNA was introduced into mice by in utero electroporation as described [48] . Acute slices were prepared from positively transfected mice at P14-21. After isofluorane anesthesia and decapitation, acute coronal slices were cut in chilled solution containing (in mM) 110 choline chloride, 25 NaHCO 3 , 25 d -glucose, 11.6 sodium ascorbate, 3.1 sodium pyruvate, 2.5 KCl, 1.25 NaH 2 PO 4 , 0.5 CaCl 2 , and 7 MgCl 2 , saturated with 95% O 2 /5% CO 2 . Slices were then transferred to artificial cerebrospinal fluid (ACSF) containing (in mM) 127 NaCl, 2.5 KCl, 1.25 NaH 2 PO 4 , 25 d -glucose, 25 NaHCO 3 , 2 CaCl 2 , and 1 MgCl 2 saturated with 95% O 2 /5% CO 2 , and were incubated at 34 degrees for ∼15 min before being cooled to room temperature. All experiments were conducted according to protocols approved by the Institutional Animal Care and Use Committee of Cold Spring Harbor Laboratory.
Show full methods section
Molecular biology The original GCaMP2 expression construct was obtained from M. Kotlikoff, and generated by J. Nakai [24] ; TN-XL from O. Griesbeck (MPI, Germany) [21] ; Yellow Cameleon Y3.60 from A. Miyawaki (RIKEN, Japan) [25] . All of the above constructs were driven by the CMV promoter in mammalian expression vectors. GCaMP2 was subcloned into the pCAGGS vector with the CAG promoter (CMV-enhancer, β-actin promoter, and regulatory element from the woodchuck hepatitis virus (WPRE) [48] ). Subcellularly targeted constructs were driven by the CAG promoter. Three membrane-targeted versions of GCaMP2 were generated: (1) the first 41 amino acids of human MARCKS domain mutant (Met1-Val41) [49] , which is myristoylated at Gly2 and double palmitoylated at Cys3Cys4, fused to the N-terminus of GCaMP2 (linker sequence AAAT); (2) a short MARCKS domain (Met1-Lys7) fused to the N-terminus of GCaMP2 (linker sequence AAAT); (3) the human hCD4 transmembrane protein (Met1-Arg421) fused to the N-terminus of GCaMP2 (linker sequence AAAT). To target GCaMP2 postsynaptically, chick actin was fused to the C-terminus of GCaMP2 [50] (linker sequence GGR). MCherry [34] , which we used to co-transfect with GECIs, is in a pRK5 vector and a pCAGGS vector, for cultured hippocampal slices and in utero electroporation, respectively.
Gene transfection and slice preparation
Hippocampal cultured slices were prepared from P7 rats as described [31] . Slices were transfected using gold particle-mediated biolistic gene transfer (Helios Gene Gun, BioRad) at 4–8 days in vitro. The amount of DNA used in each bullet preparation was between 1–20 µg per full length of tubing. All GECIs except FRET-based GECIs were co-transfected with mCherry to aid identification of GECI-expressing cells. Imaging experiments were performed 36–48 hours after the transfection. For the acute slice experiments shown in Figure 3B , GCaMP2 and mCherry DNA was introduced into mice by in utero electroporation as described [48] . Acute slices were prepared from positively transfected mice at P14-21. After isofluorane anesthesia and decapitation, acute coronal slices were cut in chilled solution containing (in mM) 110 choline chloride, 25 NaHCO 3 , 25 d -glucose, 11.6 sodium ascorbate, 3.1 sodium pyruvate, 2.5 KCl, 1.25 NaH 2 PO 4 , 0.5 CaCl 2 , and 7 MgCl 2 , saturated with 95% O 2 /5% CO 2 . Slices were then transferred to artificial cerebrospinal fluid (ACSF) containing (in mM) 127 NaCl, 2.5 KCl, 1.25 NaH 2 PO 4 , 25 d -glucose, 25 NaHCO 3 , 2 CaCl 2 , and 1 MgCl 2 saturated with 95% O 2 /5% CO 2 , and were incubated at 34 degrees for ∼15 min before being cooled to room temperature. All experiments were conducted according to protocols approved by the Institutional Animal Care and Use Committee of Cold Spring Harbor Laboratory.
Electrophysiology
We made recordings from both CA1 and CA3 cells in hippocampal slice culture, and cortical layer 2/3 pyramidal cells in acute brain slices. For measuring action-potential evoked GECI responses, we recorded from 62 CA1 pyramidal cells, 12 CA3 pyramidal cells, and 8 layer 2/3 cortical pyramidal cells ( in utero electroporated, for GCaMP2 only) The brightness measurements reported in Figure 7 included another 45 CA1 pyramidal cells and 3 CA3 pyramidal cells. Patch pipettes were pulled from borosilicate glass (standard wall with filament) and were 3–6 MΩ when filled with (in mM) 128 K-methylsulfate, 10 HEPES, 10 Na-phosphocreatine, 4 MgCl 2 , 4 Na 2 ATP, 0.4 Na 2 GTP, 3 ascorbic acid (pH 7.2, 293 mOsm). In experiments reported in Figure 4D–F , 500 µM X-Rhod-5F was added to the pipette solution. In some experiments reported in Figure 6 , 30 µM Alexa-594 was added to the pipette solution for spine visualization. In perforated-patch experiments reported in Figure 3A , pipettes were tip-filled with patch solution containing ≤0.5 mg/mL amphotericin B (1% DMSO; Sigma). Liquid junction potentials were not corrected. Cells were accepted if they had resting potentials ≤−50 mV and input resistances of at least 100 MΩ for CA1 and layer 2/3 cells. CA3 cells had input resistances of 117±57 MΩ (mean±SD). For recordings slices were transferred to an immersion-type recording chamber (after ≥1 hr incubation for acute slices) and perfused with ACSF comprising (in mM) 127 NaCl, 2.5 KCl, 1.25 NaH 2 PO 4 , 25 d -glucose, 25 NaHCO 3 , 4 CaCl 2 , and 4 MgCl 2 saturated with 95% O 2 /5% CO 2 . For experiments with action-potential stimuli, the ACSF included 10 µM (R)-CPP (Tocris) and 10 µM NBQX (Sigma) to block glutamate receptors. For the uncaging experiments shown in Figure 6 , the ACSF calcium and magnesium concentrations were changed to 2 mM and 0.1 mM, respectively, (R)-CPP was omitted, and tetrodotoxin (1 µM, Calbiochem), d -serine (10 µM, Sigma), and MNI-glutamate (2.5 mM, Tocris) were added to the bath. For experiments without X-Rhod-5F, data collection began typically within 2–3 minutes of break-in. To prevent wash-out of GECI fluorescence, most experiments were terminated within 20–25 minutes of break-in. In experiments measuring both GECI and X-Rhod-5F responses, data collection began after a dye-loading period of 20–23 minutes and continued until ≤43 min after break-in. Action potentials were triggered by current injections (3–5.5 nA, 2 ms) through the patch pipette. Trials were repeated at 0.1 Hz. Unless indicated otherwise, experiments were performed at room temperature (21–24°).
Imaging and uncaging
We imaged on a custom-built two-photon microscope using ScanImage software [51] and an Olympus 60×, 0.9 NA LUMPlanFI/IR objective. For imaging and glutamate uncaging we used two Ti:sapphire lasers (Mira, Coherent, Santa Clara, CA; and MaiTai, Spectra Physics, Mountain View, CA). For imaging we tuned one laser to 910 nm, 960 nm or 810 nm (as indicated). For glutamate uncaging we used a wavelength of 720 nm. Fluorescence was collected in two channels in both epi- and transfluorescence mode [52] using four photomultiplier tubes (Hamamatsu, Hamamatsu City, Japan). For GCaMP2-based GECIs and EGFP, we separated fluorescence into “green” and “red” channels with 565 nm dichroics and BG22 (green channel) and HQ620/90 (red channel) emission filters. For the FRET-based GECIs ( Figure 7 ) we separated fluorescence with 505 nm dichroics and HQ480/80 (“cyan” channel) and HQ535/50 (“yellow” channel) emission filters. For most experiments, images were acquired by scanning in linescan mode (500 Hz) across a location at the base of the apical dendrite ( Figure 2A ). Fluorescence time series were then obtained by averaging across the spatial extent of the dendrite along the line ( Figure 2B ). For glutamate uncaging experiments shown in Figure 6 , images were acquired in framescan mode (256×256, 2 ms/line). The uncaging stimulus was 720 nm illumination for 0.2 ms at 100–135 mW. We report time series as ΔF/F = [(F-F D )-(F 0 -F D )]/(F 0 -F D ), where F is the raw fluorescence signal, F D is the mean PMT “dark signal” recorded with the laser shutter closed, and F 0 is the mean fluorescence signal in a baseline period prior to the action potential stimuli. The response amplitude on a given trial was measured as the mean of a 30 ms window of the ΔF/F time series, which was centered on the peak of the smoothed (50-ms moving average) mean response for that cell and stimulus condition. Rise T 1/2 was measured as the time between the onset of current injection and the half-maximal response. Decay T 1/2 was measured as the time between the peak response and the decay back to half-maximum response. For display, example traces were filtered with a Savitzky-Golay filter of order 2 and span 30 ms. All analysis was performed with MATLAB (Mathworks, Natick, MA). For the brightness measurements reported in Figure 7 , each cell was first patched to confirm that it met our resting potential and input resistance criteria. The pipette was pulled off from the cell in
📊 Figures
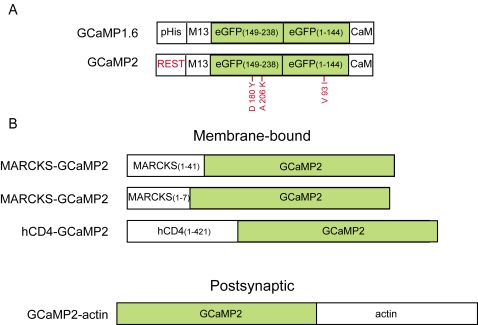
Figure 1
Domain structures of the GCaMP-family of genetically encoded calcium indicators (GECIs) and fusion constructs.
A, Domain comparisons of GCaMP2 and GCaMP1.6; red labels indicate the differences. B, Constructs for subcellular targeting of the GECIs.
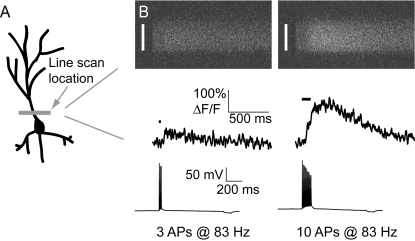
Figure 2
Recording backpropagating action potential responses from GECIs in hippocampal pyramidal cells.
A, Schematic showing the linescan location at the base of the apical dendrite. B, Raw linescan images (top row) showing a dark period prior to shutter opening, followed by a shutter-open fluorescence ...
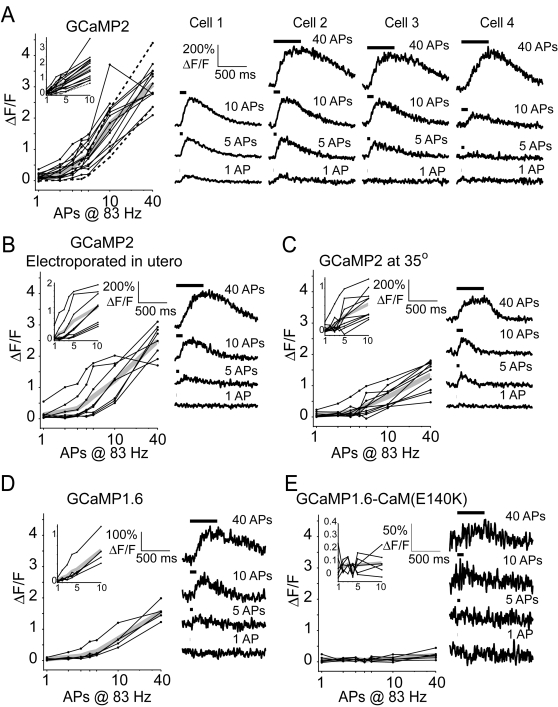
Figure 3
Action-potential evoked responses in GCaMP-based GECIs.
A, Amplitudes of GCaMP2 responses for individual hippocampal pyramidal cells (thin lines, left) in response to trains of action potentials given at 83 Hz, and the mean across cells (thick gray line). ...
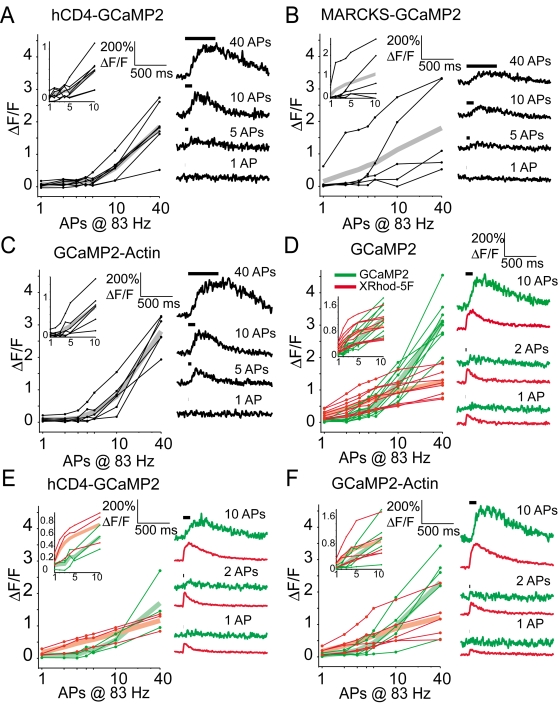
Figure 4
Action-potential evoked responses in GECIs targeted to subcellular locations.
A, Amplitudes of the response to action potential trains at 83 Hz for the membrane-targeted GECI hCD4-GCaMP2 (left), for individual cells (thin black lines) and for the group mean (thick gray line). I...
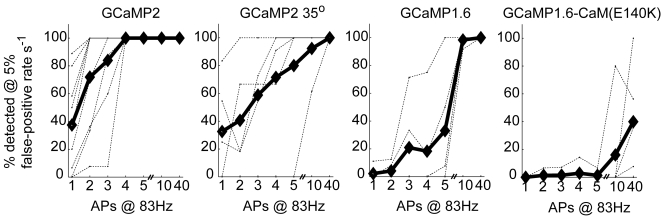
Figure 5
Accuracy of action potential detection.
Results of simulations (see Materials and Methods ) giving percentage of action potential trains (for the indicated numbers of action potentials at 83 Hz) that can be detected at a 5% false positive r...
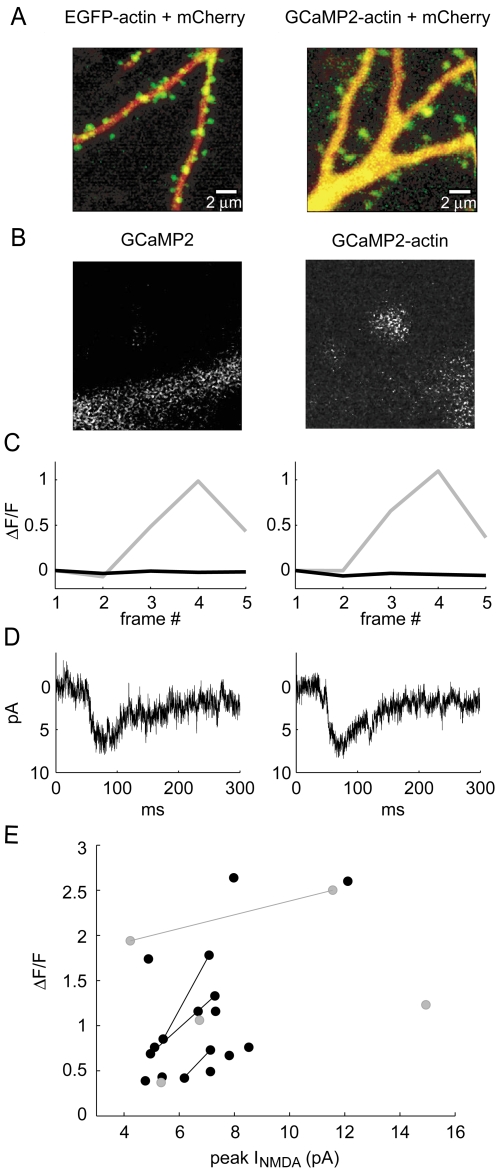
Figure 6
GCaMP2 and GCaMP2-actin uncaging responses in spines.
A, Apical dendrite of a CA1 pyramidal cell (left) expressing EGFP-actin (green) and mCherry (red), showing an enrichment of EGFP-actin at spines (predominantly green) compared to dendrite (predominant...
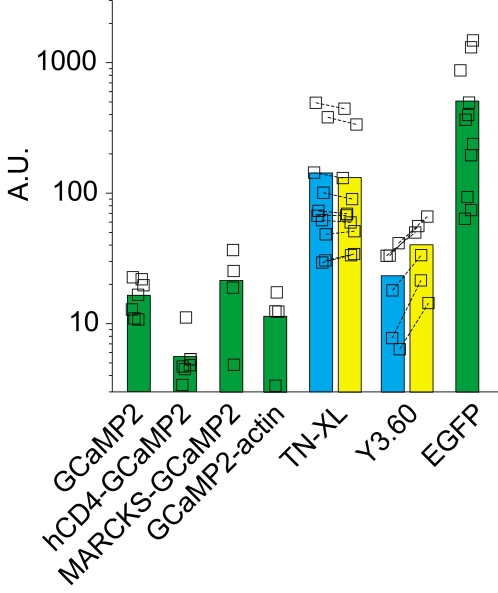
Figure 7
Brightness of the GECIs compared.
GECIs were expressed (34u201348 hours) in pyramidal cells and brightness was measured as the mean fluorescence intensity collected in linescan mode across the base of the apical dendrite. Each plot sy...
Figure images are served from the NIH/NLM PubMed Central Open Access Subset or Europe PMC; copyright remains with the publishers and authors.
💬 Discussion
0 commentsNo comments yet. Be the first to start a discussion!
Leave a Comment