Abstract
Brain perturbation studies allow detailed causal inferences of behavioral and neural processes. Because the combination of brain perturbation methods and neural measurement techniques is inherently challenging, research in humans has predominantly focused on non-invasive, indirect brain perturbations, or neurological lesion studies. Non-human primates have been indispensable as a neurobiological system that is highly similar to humans while simultaneously being more experimentally tractable, allowing visualization of the functional and structural impact of systematic brain perturbation. This review considers the state of the art in non-human primate brain perturbation with a focus on approaches that can be combined with neuroimaging. We consider both non-reversible (lesions) and reversible or temporary perturbations such as electrical, pharmacological, optical, optogenetic, chemogenetic, pathway-selective, and ultrasound based interference methods. Method-specific considerations from the research and development community are offered to facilitate research in this field and support further innovations. We conclude by identifying novel avenues for further research and innovation and by highlighting the clinical translational potential of the methods.
🔬 Techniques
🧪 Sample Preparation
🏭 Microscope Brands
🏛️ Research Organizations (ROR)
Affiliated research institutions:
📋 Methods
3.2. Methodological considerations 3.2.1. Drug delivery options There are two main ways to deliver a drug to the target brain region. One approach is to use an implanted MRI-compatible (PEEK or fused silica) cannula through which another thinner injection cannula is acutely inserted to the target ( Schmid et al., 2010 ; Wilke et al., 2012 ). Injections can also be done outside of the scanner using a metal cannula or an injectrode (a recording electrode paired with the injection channel). This is typically done with a recording chamber and positioning grid, using a micro-drive for gradual insertion. The mode of drug delivery could be relevant for the experimental design. For instance, using a fully MRI-compatible setup with an implanted cannula, pre-injection baseline runs can be collected while the animal is already in the scanner, before and after the injection in the same session, allowing for easier paired statistical analysis. Most experimental designs rely on separate baseline and injection sessions, for which the injection approach described below might be as efficient. 3.2.2. Avoiding imaging artifacts In order to avoid imaging artifacts that might be introduced by the presence of the injection cannula and other experimental equipment, it is possible to inject the pharmacological agent while the subject is outside the fMRI facility, and then remove the hardware before the imaging session. This requires careful timing, and the ability to perform the injection at a location a short distance from the magnet. For example, for injections into the SC, small volumes of muscimol (about 0.5 μl) can be injected over a period of about 20 minutes, then some additional time (~20 minutes) is necessary for the muscimol to diffuse before the removal of the cannula. The delayed removal of the cannula is important to prevent the muscimol from ascending along the penetration track as the cannula is retracted. Once the cannula and mounting hardware are removed, the chamber can be filled with a gel that minimizes the distortion at the surface of the brain, and imaging can be done while the muscimol continues to suppress neuronal activity. 3.2.3.
Show full methods section
3.2. Methodological considerations 3.2.1. Drug delivery options There are two main ways to deliver a drug to the target brain region. One approach is to use an implanted MRI-compatible (PEEK or fused silica) cannula through which another thinner injection cannula is acutely inserted to the target ( Schmid et al., 2010 ; Wilke et al., 2012 ). Injections can also be done outside of the scanner using a metal cannula or an injectrode (a recording electrode paired with the injection channel). This is typically done with a recording chamber and positioning grid, using a micro-drive for gradual insertion. The mode of drug delivery could be relevant for the experimental design. For instance, using a fully MRI-compatible setup with an implanted cannula, pre-injection baseline runs can be collected while the animal is already in the scanner, before and after the injection in the same session, allowing for easier paired statistical analysis. Most experimental designs rely on separate baseline and injection sessions, for which the injection approach described below might be as efficient. 3.2.2. Avoiding imaging artifacts In order to avoid imaging artifacts that might be introduced by the presence of the injection cannula and other experimental equipment, it is possible to inject the pharmacological agent while the subject is outside the fMRI facility, and then remove the hardware before the imaging session. This requires careful timing, and the ability to perform the injection at a location a short distance from the magnet. For example, for injections into the SC, small volumes of muscimol (about 0.5 μl) can be injected over a period of about 20 minutes, then some additional time (~20 minutes) is necessary for the muscimol to diffuse before the removal of the cannula. The delayed removal of the cannula is important to prevent the muscimol from ascending along the penetration track as the cannula is retracted. Once the cannula and mounting hardware are removed, the chamber can be filled with a gel that minimizes the distortion at the surface of the brain, and imaging can be done while the muscimol continues to suppress neuronal activity. 3.2.3.
Control condition design
Muscimol injections into the SC typically involve concentrations of 5 mg/ml and injection volumes of less than 1 μl (usually closer to 0.5 μl). The small volumes are appropriate given the small size of the SC (a few mm across) and avoid problems that can arise if muscimol spreads outside the SC into adjacent structures. Inactivation of the SC produces well-established changes in the metrics of saccadic eye movements ( Lee et al., 1988 ) that provide a very useful positive control for the effectiveness of the injection. For example, when testing the effects of SC inactivation on attention-related BOLD modulation, the subject can perform a short block of saccadic eye movements, in between each of the blocks of the main task, to determine whether or not the drug injection is still effective ( Bogadhi et al., 2019 ). Given that the effects of a single injection will peak and then decline over time, it is extremely helpful to have this type of positive control to test whether or not the pharmacological manipulation was successful during each imaging block. Alternatively, in some experiments the main task can serve as a behavioral readout for the inactivation time course, e.g. the contralesional/ipsilesional choice proportion in free-choice trials is a sensitive measure of the inactivation in LIP and dPul. Typically, inactivation effects are observable from 30–60 min after injection, peak at 1.5–2 hours and last a few hours. Some studies however report a much later peak at 18 hours after the injection ( Liu and Pack, 2017 ). The exact time course might depend on the concentration (typically 3 – 10 mg/ml), the injection volume (typically 0.5 – 5 μl), the drug (muscimol or THIP), and the physiological properties of the target structure. For these reasons, brain physiology might not necessarily have returned to baseline the day after the injection, which is something to keep in mind when recording control data without inactivation injections. While saline sham injections are an accepted control for the specificity of the pharmacological drug effect, every penetration and injection can potentially cause some tissue damage along the track and inside the target structure. Therefore, it might be advisable to compare a few saline injection sessions with the sessions without any injection. If there are no observable differences in behavior or neural activation patterns between the saline and no-injection sessions, no-injection sessions can be used as baseline controls. 3.2.4. Risks and solutions There are three main risks associated with reversible inactivation experiments. As with any intracranial procedure, the penetration and drug injection can introduce infections. To minimize this risk, the procedure should be as sterile as possible, and the injection solution should be based on a sterile PBS buffer or be sterile-filtered. The insertion of the injection cannula can cause bleeding if vessels are damaged, although MRI can both help to avoid large vessels and monitor the status of (recovery from) any bleeding that might still occur ( Balezeau et al., 2021 ). Lastly, for certain deep structures, e.g. LGN, SC, pulvinar, and caudate, the nearby ventricles present a special risk because the injection of a potent GABA-A agonist such as muscimol into a ventricle can cause drowsiness and potentially suppress respiration. Fortunately, the latter two risks can be mitigated with a careful pre-penetration targeting and vessel avoidance plan (see Box 1 ), and with concurrent visualization of the penetration track and injection site with an MR contrast agent prior to injection. 3.2.5. Assessing the spatial extent of inactivation with co-injection of gadolinium In several of the fMRI studies described above, the extent of inactivation was confirmed by co-injection of the MRI contrast agent gadolinium or manganese chloride (see Box 1 ). In prior work, MRI-visualized spread of the gadolinium contrast agent closely matched the muscimol distribution volume ( Allen et al., 2008 ; Heiss et al., 2010 ). Although such labeling proved extremely valuable for guiding the analysis of inactivation effects, several issues need to be taken into account when evaluating drug spread with gadolinium. First, gadolinium passes through the extracellular space until it is absorbed by the blood stream via CSF. In contrast, GABA-A agonists such as muscimol/THIP pass through the extracellular space until they either bind to the GABA-A receptor on the surface of a neuron or are enzymatically degraded or absorbed into the bloodstream or CSF ( Heiss et al., 2005 ). Second, while gadolinium travels along the axon, the myelinated fiber tracts represent a diffusion barrier for muscimol and the drug does not bind there ( Allen et al., 2008 ; Heiss et al., 2010 ). Third, whereas muscimol spread has been validated, to our knowledge, there is no study systematically comparing THIP with gadolinium or THIP/muscimol binding over a time course of 2–3 hours, which is the typical session duration of task-related inactivation/fMRI studies. Thus, although the co-injection of gadoliunium or MnCl2 is exceedingly helpful to identify the center-of-mass of the pharmacological injections, it may over- or underestimate the total tissue volume that is affected.
5.3. Methodological Considerations 5.3.1. Practical considerations Given the complex technical nature of es-fMRI, labs that are starting to use this approach might consider testing their complete set-up and procedures in sedated or anesthetized animals before studying awake animals. Most practical considerations outlined below apply to both anesthetized and awake subject experiments. Electrical stimulation is delivered through a non-ferrous metal electrode, the active contact of which is placed in the desired brain location. The choice of stimulation electrode material matters as not all materials behave similarly when passing current. Most researchers use platinum or platinum-iridium electrodes due to their low corrosive properties and high charge transfer capacity ( Brummer et al., 1983 ; Cogan, 2008 ; Tolias et al., 2005 ), but others have also used titanium electrodes due to their superior electrophysiological recording characteristics and stiffer material properties. Stiffness is important to allow straight penetration with minimal electrode diameter so that deep brain regions can be accurately targeted with minimal tissue damage ( Bao et al., 2020 ; Moeller et al., 2008 ). The electrode can be chronically implanted, acutely positioned with an MRI-compatible microdrive, or lowered into place with a conventional microdrive that is then removed before entering the scanner environment. Guide-tubes to aid electrode positioning can be made from an MR-compatible material such as fused silica or PEEK. They can be used to facilitate dura penetration and get the electrode to the target area in a straight trajectory. A second metal contact is typically placed in saline solution within the implanted chamber, or it is chronically implanted elsewhere to form a complete circuit. Connectors near the head of the animal should be void of nickel which is ferromagnetic and strongly affects the quality of the functional images 2 . The two wires attached to the contacts should be twisted together to prevent the formation of induction loops within the alternating magnetic field of the scanner that might induce currents. The wires are then typically fed into a shielded BNC cable and connected to a current isolator, which is controlled by a stimulator. The cable capacitance of this circuit should be minimized by choice of cable, with the cable being no longer than needed. Cable capacitance will impact the rise time of the stimulation current and might prevent the current delivered to the brain from ever reaching the specified level within the pulse (phase) duration. The output of the complete stimulation circuit should thus be measured, which can be done with an electrically isolated (e.g., battery-powered) oscilloscope. The resulting voltage waveform across a small series resistor can help assess the actually delivered vs. requested current. A filter to shield the circuit from the Larmor frequency of the scanner should be added between the stimulus isolator and the electrode lead into the brain to minimize imaging artifacts and protect both the brain and the isolator from scanner-induced high frequency currents. The filter (e.g. a low-pass filter with a 50 MHz cutoff) should ideally be made of non-ferrous components designed to operate in a strong magnetic field and be placed in the scanner near the electrode. This will keep the effective length of the electrode “antenna” far from the wavelength of the inducing radiofrequency magnetic oscillations. The stimulation circuit must be isolated from ground and the receive coil circuits. To prevent malfunction, the current isolator and stimulator need to be in the control room, or alternatively well shielded and secured to a surface inside the scanner room. The strength of the applied current should be increased gradually to a desired amplitude in a new experimental animal or a stimulation site to ensure that the animal does not experience any observable adverse effects, and that no (unintended) eye or limb/body movements are evoked, as these will distort the functional imaging. 5.3.2.
Stimulation parameters
Most stimulators allow the experimenter to choose between constant voltage and constant current stimulation. The fact that the electrode impedance in the brain can vary over space and time makes voltage controlled stimulation imprecise in terms of reliable charge delivery, thus constant current stimulation with charge-balanced biphasic waveform is often preferred. Typically, the nominal current levels used in es-fMRI (100–250 μA and well above) are higher than in many behavioral studies, but this is not always the case. With stimulation of the pulvinar, for instance, reliable behavioral effects have been obtained with 150–250 μA ( Dominguez-Vargas et al., 2017 ), whereas stimulation of the FEF with 30 μA already evoked saccades and reliable es-fMRI effects ( Ekstrom et al., 2009 , 2008 ). Stimulation parameters vary substantially across studies, but researchers typically use charge-balanced pulses and allow a brief pause even at higher-frequency stimulation for the required neuronal hyperpolarization in order for further action potentials to be generated. Most es-fMRI studies in NHPs stimulate the brain with several high-frequency (100 Hz and above) pulse trains to reliably elicit fMRI activity, either in blocked or in slow event-related designs. Single stimulation trains can however also have a clear impact ( Arsenault and Vanduffel, 2019 ; Murris et al., 2021 ), offering exciting opportunities for identifying time-resolved dynamics and stimulus- or behavior-related contingencies during a specific task epoch. Elucidating frequency-specific stimulation effects is another research direction that will enhance the power of es-fMRI approach ( Murris et al., 2020 ). 5.3.3. Safety risks and solutions During es-fMRI scanning, radio-frequency (RF) exciting pulses (MHz range) and magnetic gradient field switching (kHz range) can induce current in the intracranial contacts. The RF pulse can cause heating of the electrode contacts, which should be kept within the safety limit of less than 1 deg Celsius increase ( Carmichael et al., 2012 ). Gradient-Echo EPI sequences that are commonly used for es-fMRI are low-SAR (specific absorption rate) sequences and do not usually cause heating above this limit. Gradient field switching may also cause induced current in the electrode contacts but at a much lower frequency, causing mainly peripheral nerve stimulation at charge densities that are well below the safety limit. The orientations of electrodes and leads in the scanner can have a large impact on the degree of heating. While the exact relationship between orientation and degree of heating can be complex, in general the electrode and lead orientations should be along the scanner’s Z-axis as much as possible and cable loops should be avoided. The choice of excitation coil also matters. For instance, standard human MRI’s body excitation coils tend to evoke larger SAR than (custom) local transmit coils, which can lead to stronger heating. Careful assessment of induced heating with computer simulations and actual measurements with electrodes taken in solution, artificial cerebrospinal fluid, egg albumin, or a phantom are highly recommended ( Hawsawi et al., 2020 ). Electrode displacement due to the time-varying stimulation current within the static magnetic field is also a concern that needs to be tested as part of the safety assessment approach before involving experimental animals. 5.3.4. Imaging artifacts Even with careful consideration of the MRI-compatibility of used materials, there may still be distortions in the MRI signal induced by headposts, head caps, chambers or intracranial implants. Scanning sequences with short TE (< 30 ms) have less signal dropout. Spin-Echo EPI’s are less affected by artifacts than Gradient-Echo EPI’s but come with higher heating risk and lower BOLD sensitivity. RF artifacts and signal noise introduced by the presence of stimulation connections or active current delivery can be assessed with special quality assessment sequences. Alternatively, an adjusted standard functional EPI sequence with the transmit RF coil power set to zero can be used for artifact assessment. The latter option affords a convenient possibility to visualize any RF noise artifacts against the background level of noise in real-time, while connecting and adjusting the parts of the stimulation circuit and associated devices ideally one by one, with the exact same EPI sequence that will be used for actual functional data acquisition. For example, while the stimulation cable should be as short as possible, the exact placement and the path of the cable relative to the scanner bore can affect RF noise. Such RF noise debugging can first be done with a jelly or saline bath phantom approximating the head, and then on the experimental animal in each scanning session. Remaining scanning artifacts can be addressed during processing stages using fieldmap and other types of reference scans and analytical solutions ( Tasserie et al., 2020 ).
10.1.
Anesthesia as a perturbation method
The implications of performing brain perturbation and neuroimaging studies in either anesthetized or awake animals were briefly mentioned here and more extensively detailed for NHP studies elsewhere ( Basso et al., 2021 ). However, anesthesia has non-uniform effects on the brain, and different anesthetic agents impact different systems in the brain (e.g., pain neuraxis, consciousness). For instance, anesthesia suppresses the feedback of neural processing ( Suzuki and Larkum, 2020 ), and some brain regions, such as the precuneus, posterior cingulate gyrus, prefrontal dorsolateral cortex and thalamus, are more strongly deactivated by various forms of anesthesia than other regions ( Franks, 2008 ). The non-uniform effects of anesthesia have been exploited in studies on the neural mechanisms of auditory sequence violations ( Bekinschtein et al., 2009 ). For instance, neural responses to oddball sounds (local violations) primarily engage earlier auditory processing stages, while relationships that require between sequences integration of information (global violations) engage broader brain circuits, including the prefrontal, parietal and cingulate cortices ( Uhrig et al., 2014 ). The local violation effect in the auditory cortex disappears under propofol anesthesia (a GABA-ergic agonist) and, interestingly, shifts spatially under ketamine anesthesia (an NMDA antagonist) ( Uhrig et al., 2016 ). A progressive disorganization of the global effect in the prefrontal, parietal and cingulate cortex was observed with increasing levels of propofol anesthesia, while ketamine completely suppressed these same areas. Anesthesia has also been shown to massively reconfigure dynamic resting-state networks ( Barttfeld et al., 2015 ; Uhrig et al., 2018 ) despite a preservation of stationary resting-state networks ( Vincent et al., 2007 ). Although anesthesia is not usually thought of as a brain perturbation approach, using neuroimaging to understand anesthetic agent mechanisms and visualize the impact on the brain is important scientifically as well as for clinical and other translational reasons.
Supplementary Material FigureB1 Figure B1. Targeting a part of the brain for perturbation. A) Targeting software (Planner) that allows the alignment of a stereotaxic manipulator with a target identified using MRI (pink dot). Reproduced from ( Ohayon and Tsao, 2012 ). B) Pt-Ir electrodes can be localized using a T2-weighted scan and coregistered to a T1-weighted scan for more anatomical detail. Adapted from ( Dominguez-Vargas et al., 2017 ).
📊 Figures
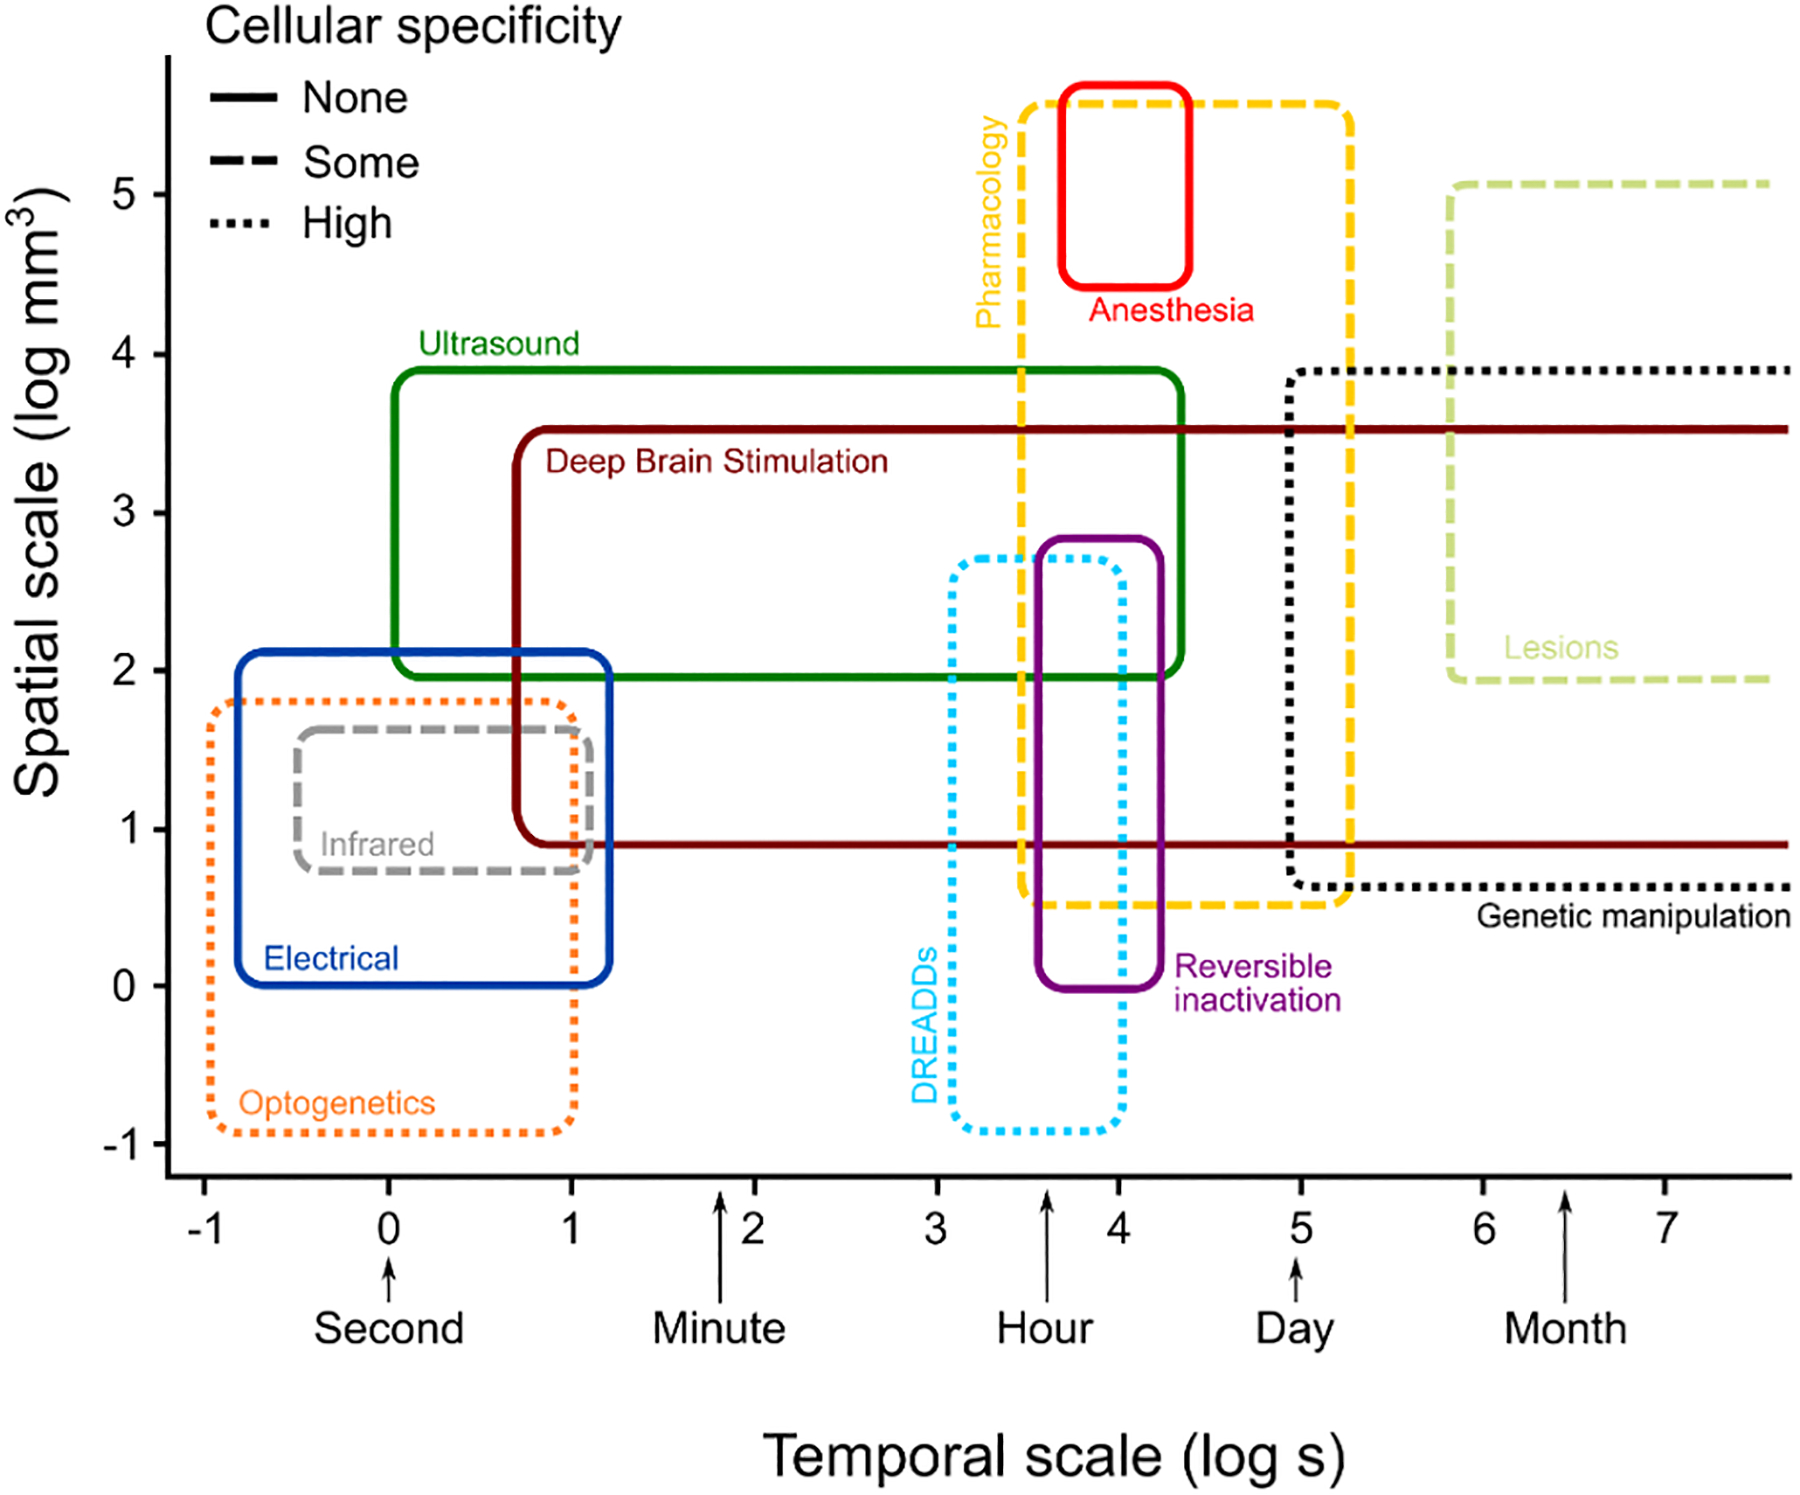
Figure 1.
Schematic overview of the specificity of brain perturbation techniques used with neuroimaging in non-human primates.
Different brain perturbation techniques operate on different spatial and temporal scales. Temporal scale is depicted on the horizontal axis (logarithmic; open ended). The range of temporal scales vari...
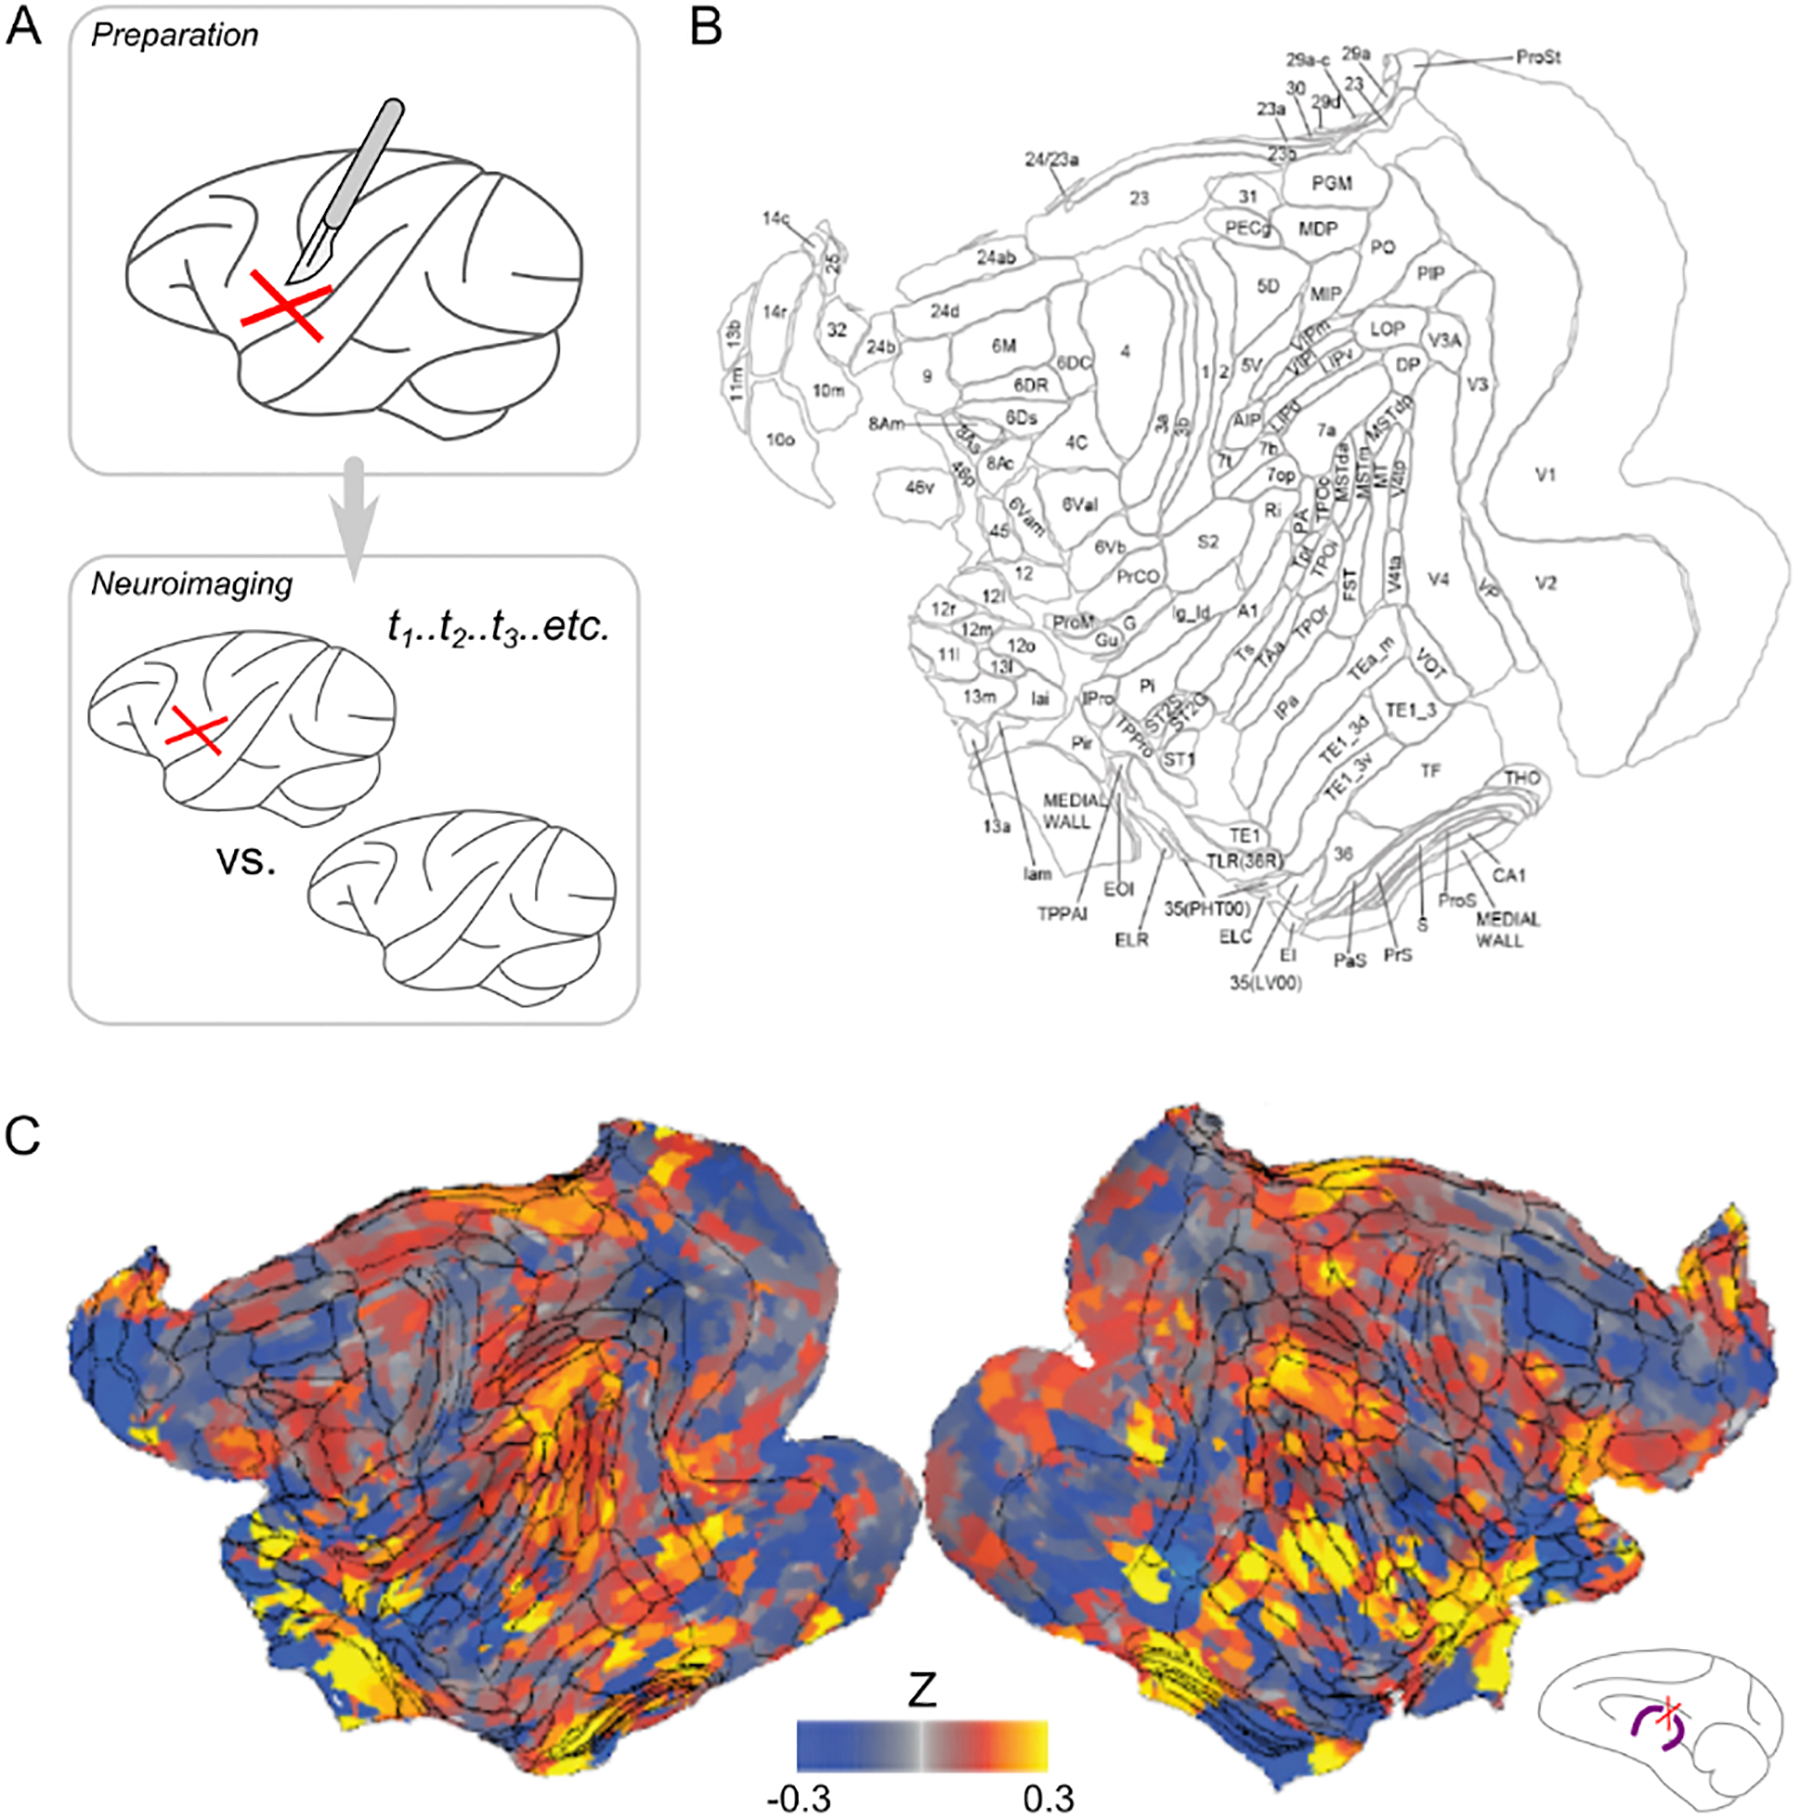
Figure 2.
Permanent lesions and fMRI.
A) In the preparation phase of an experiment, a pre-lesion scan (e.g. structural MRI, functional MRI, PET) is acquired. A lesion is then made in a specific area of the brain, e.g. by cutting a fiber b...
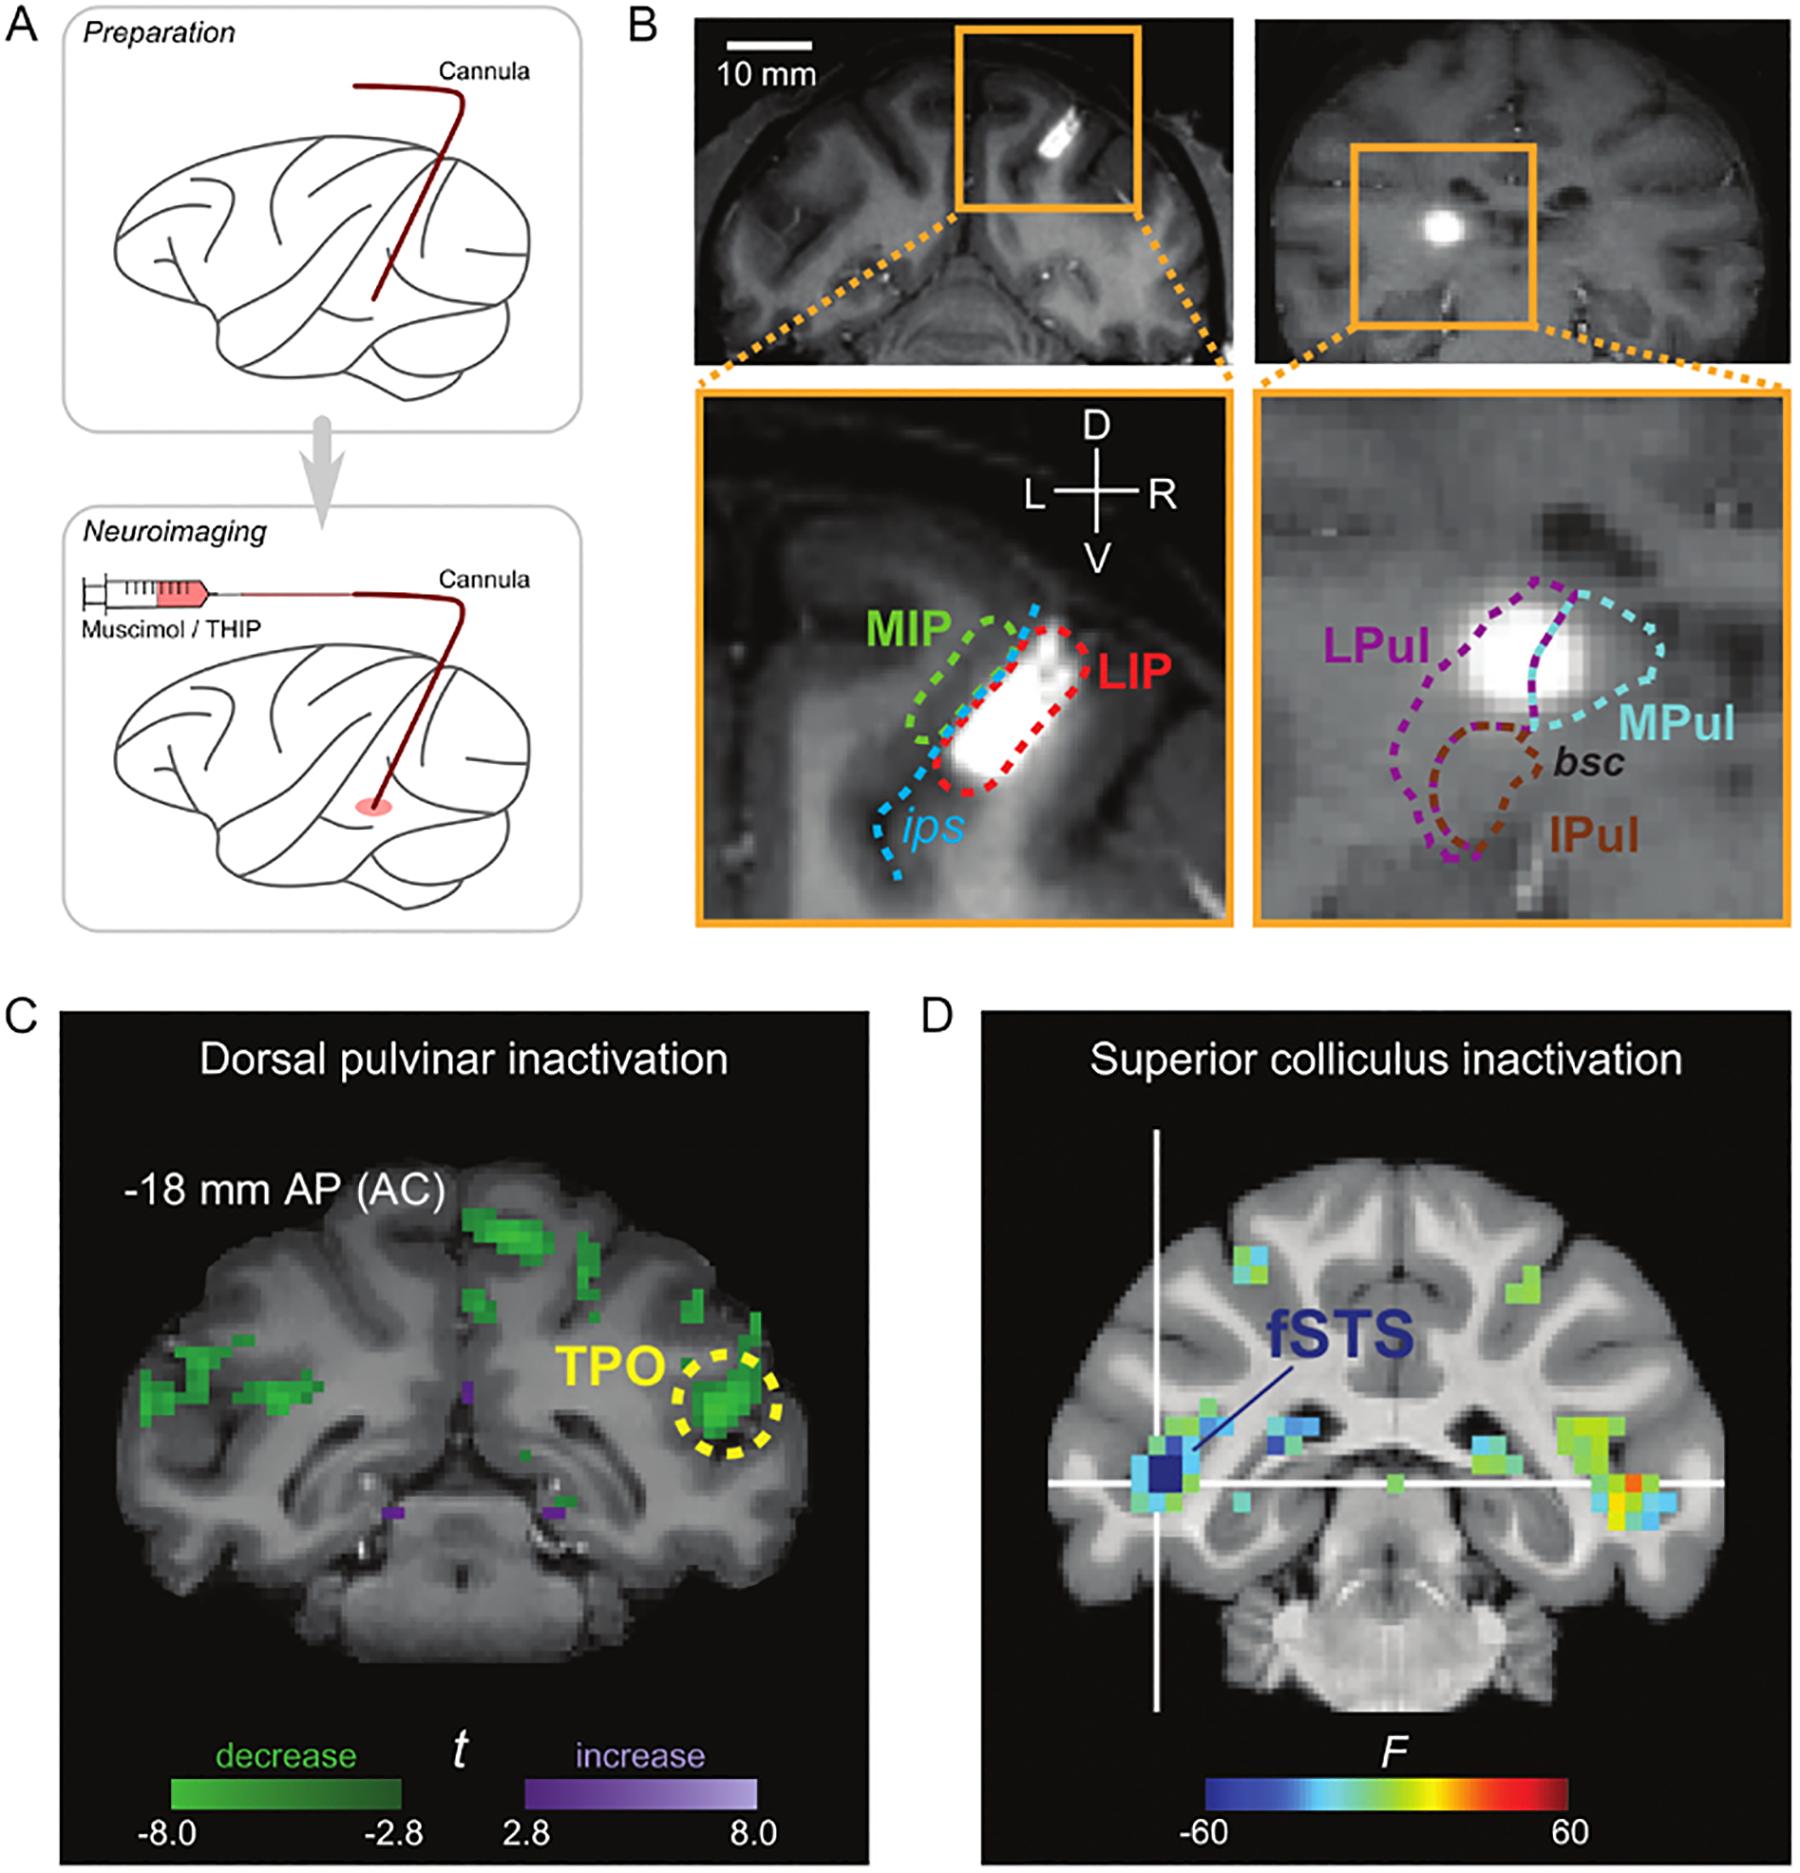
Figure 3.
Reversible pharmacological lesions and neuroimaging.
A) Schematic of the technique. A cannula is implanted before the neuroimaging stage of the experiment so that pharmacological agents such as muscimol or THIP can be administered while the animal is in...
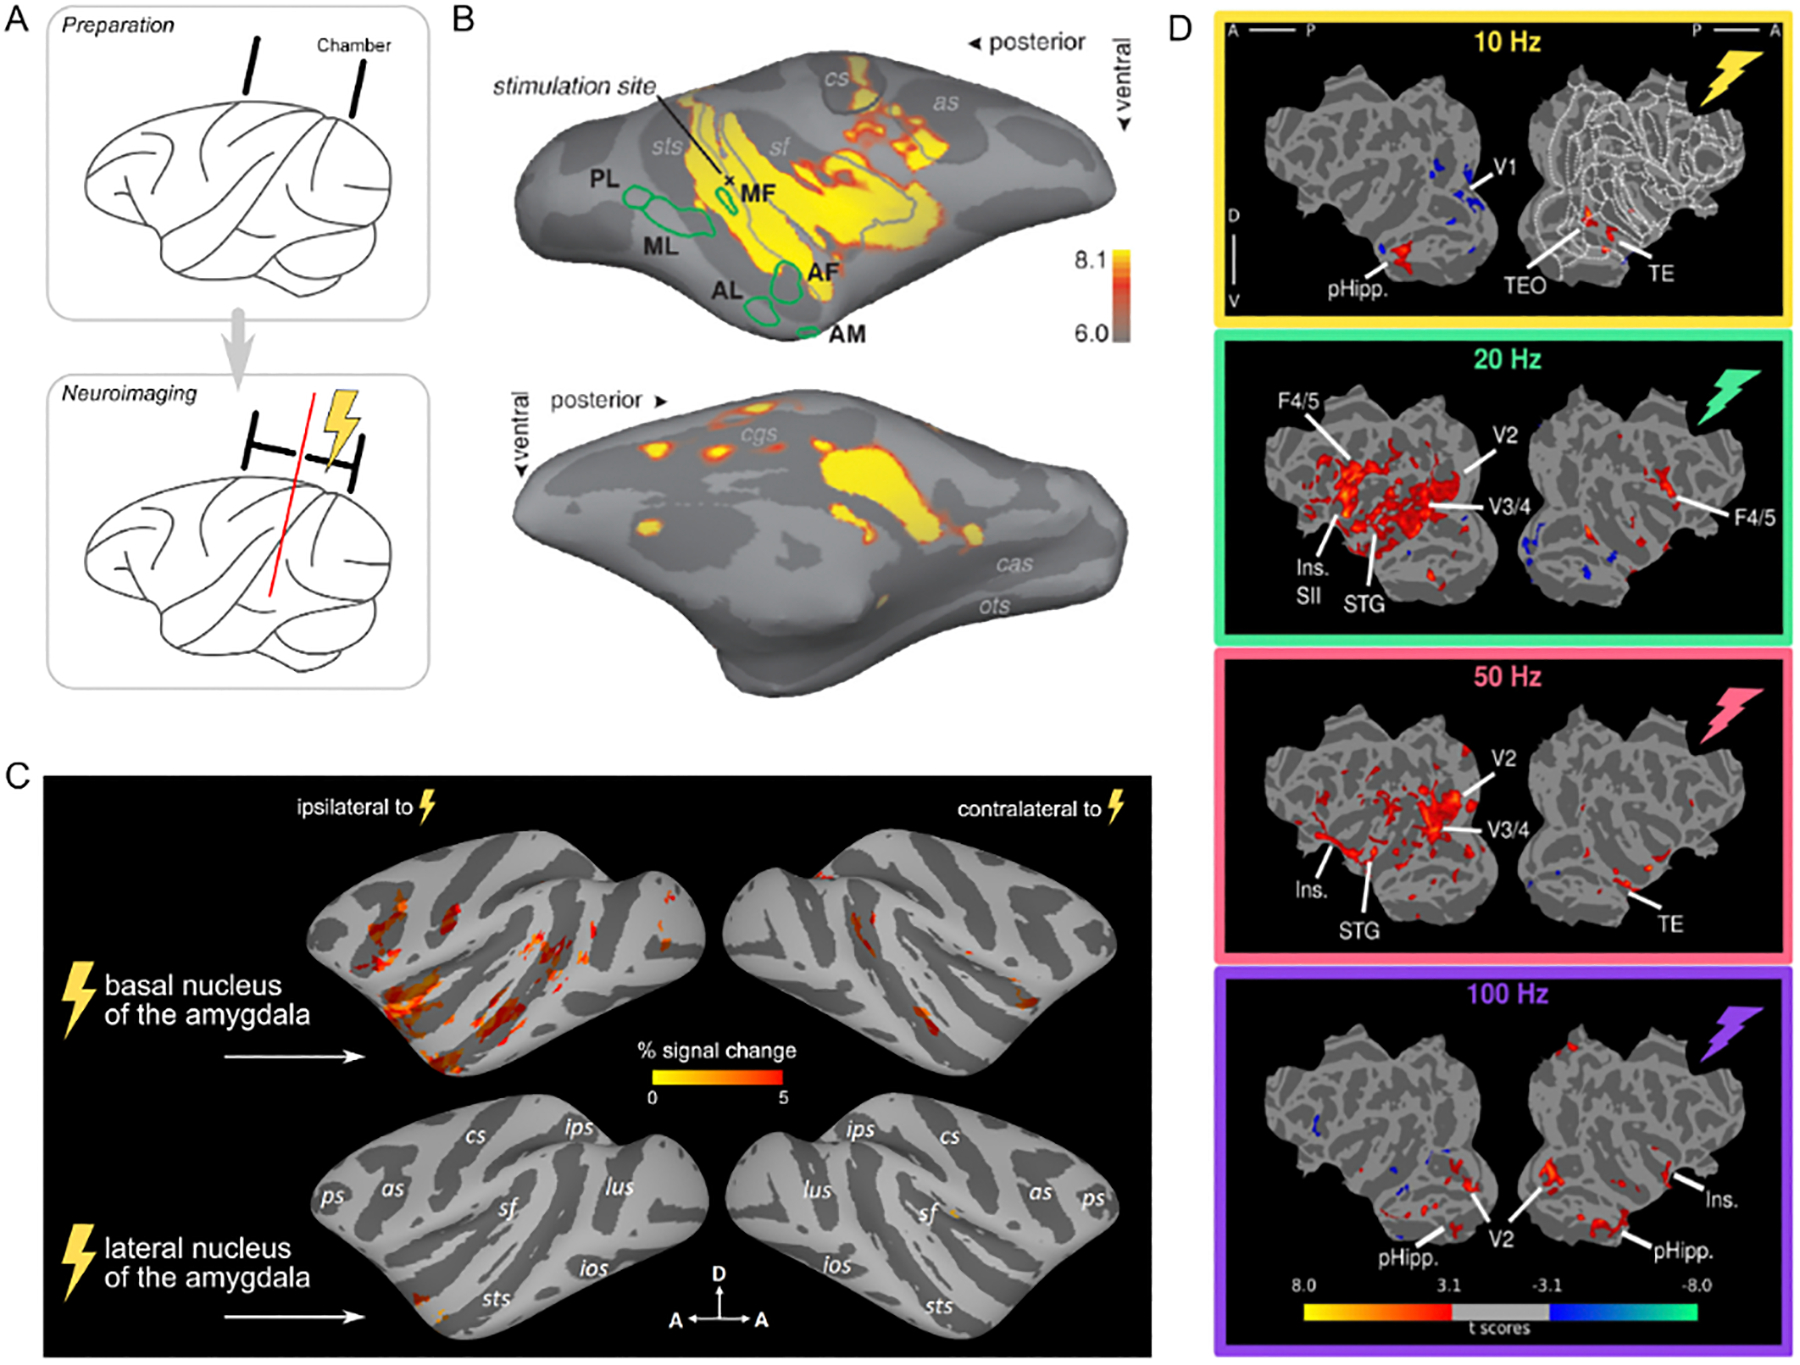
Figure 4.
Electrical stimulation and neuroimaging.
A) Schematic of the technique. To prepare for neuroimaging experiments, the animal is implanted with a chronic electrode or (as depicted) a recording/stimulation chamber for acute electrode penetratio...
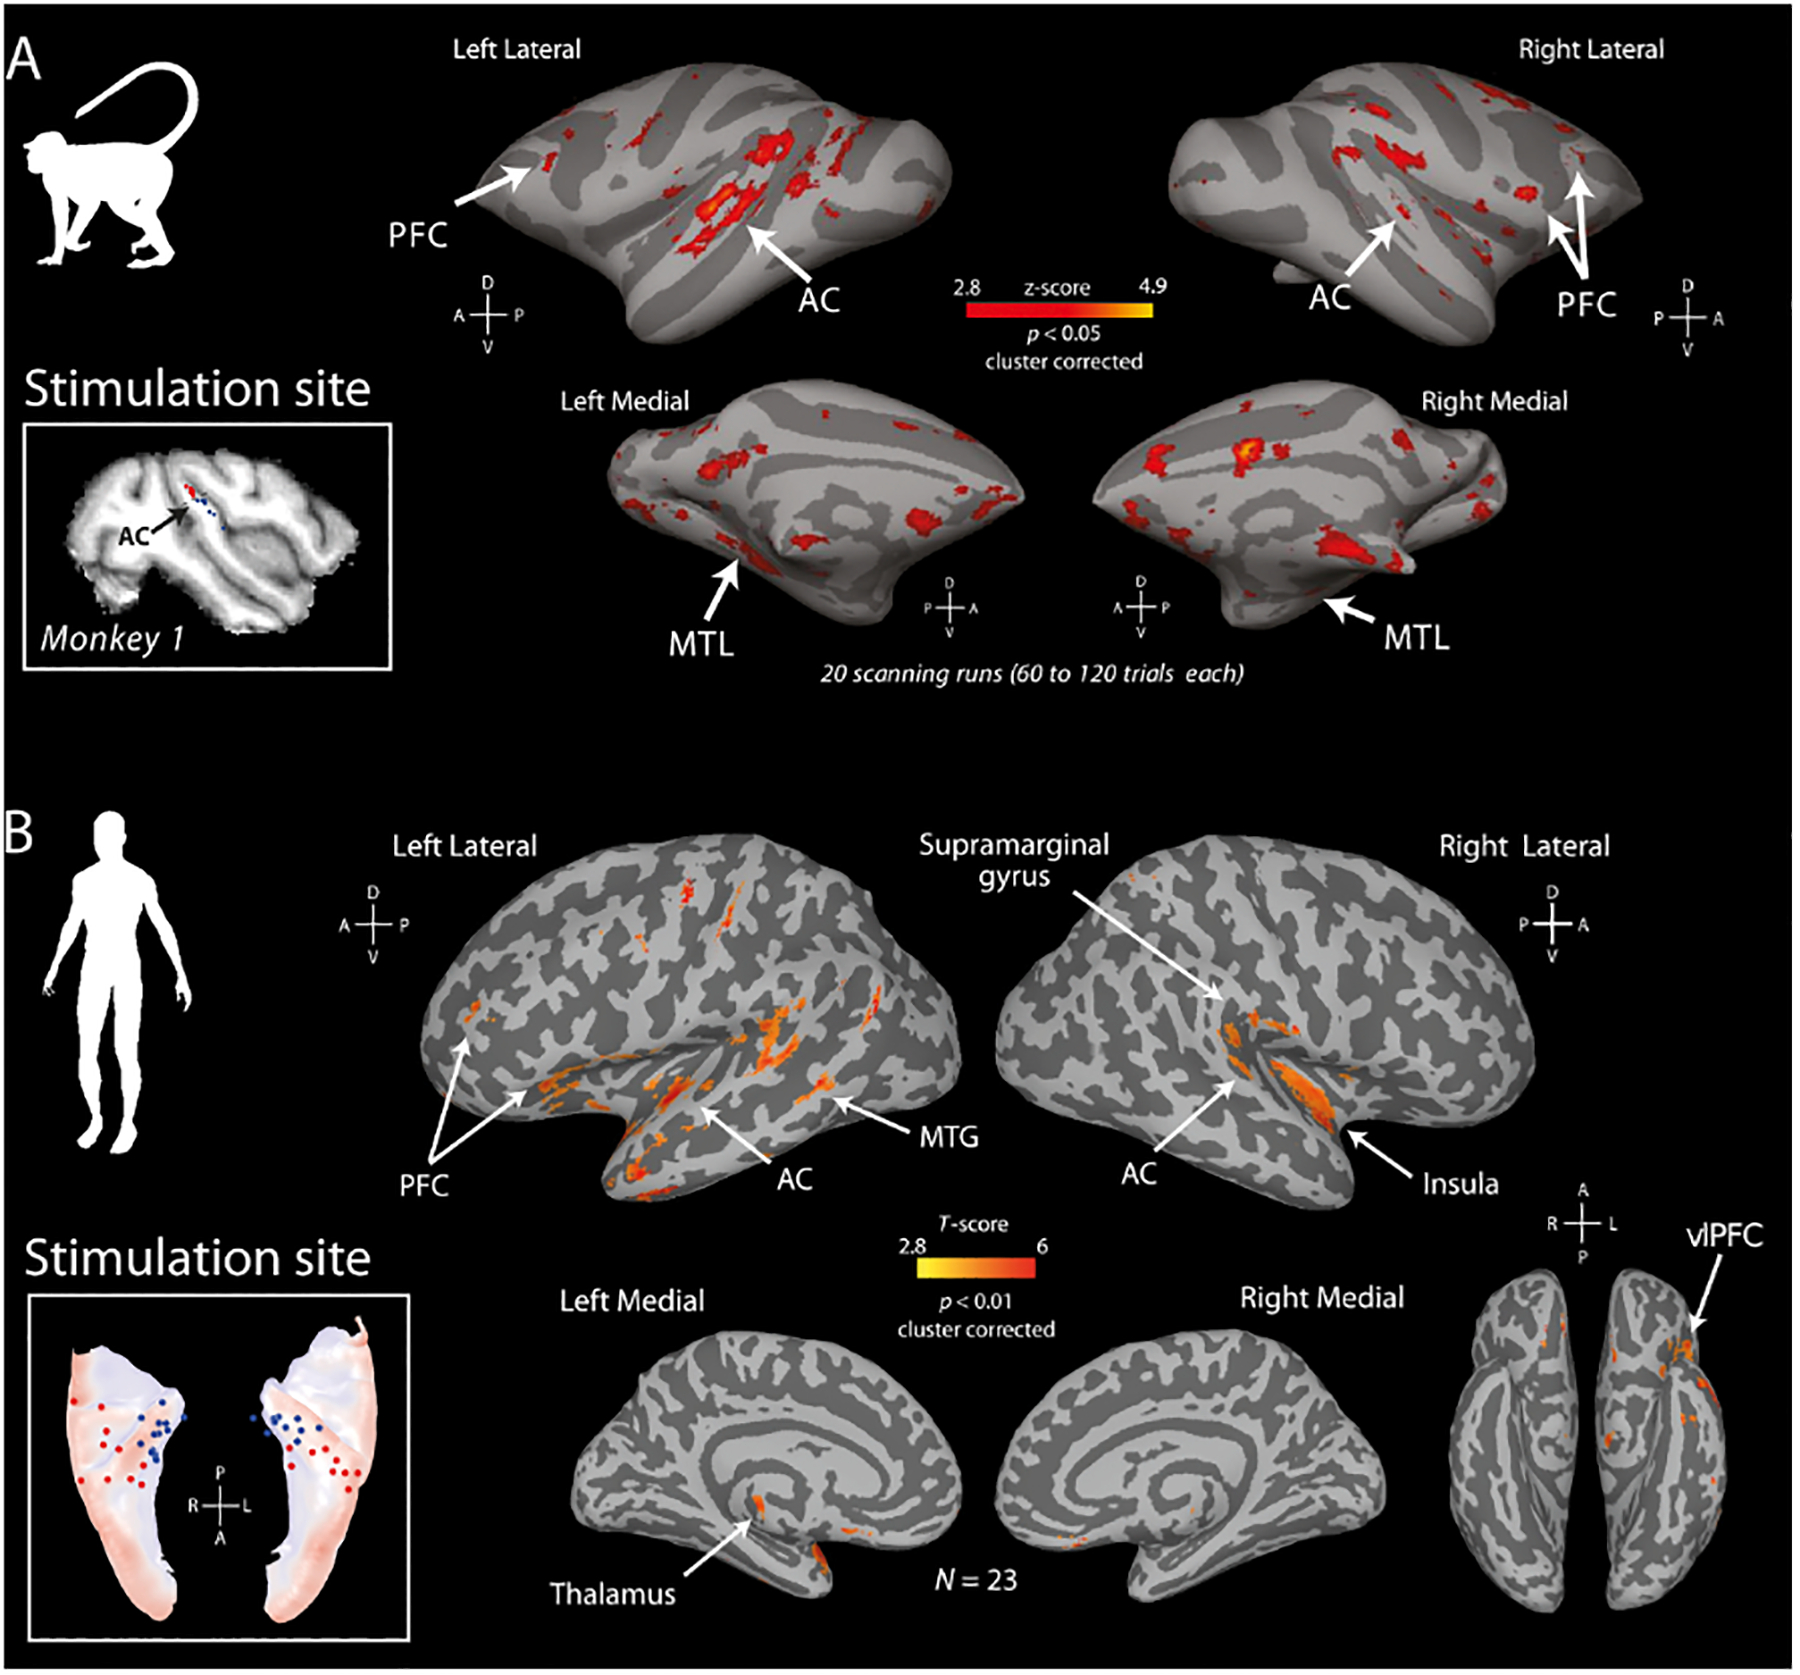
Figure 5.
Comparison of es-fMRI in macaques and humans.
A) Auditory cortex (AC) stimulation sites in one of the monkeys (inset). Es-fMRI group results from two animals show significantly activated voxels projected to the surface of a standard macaque templ...
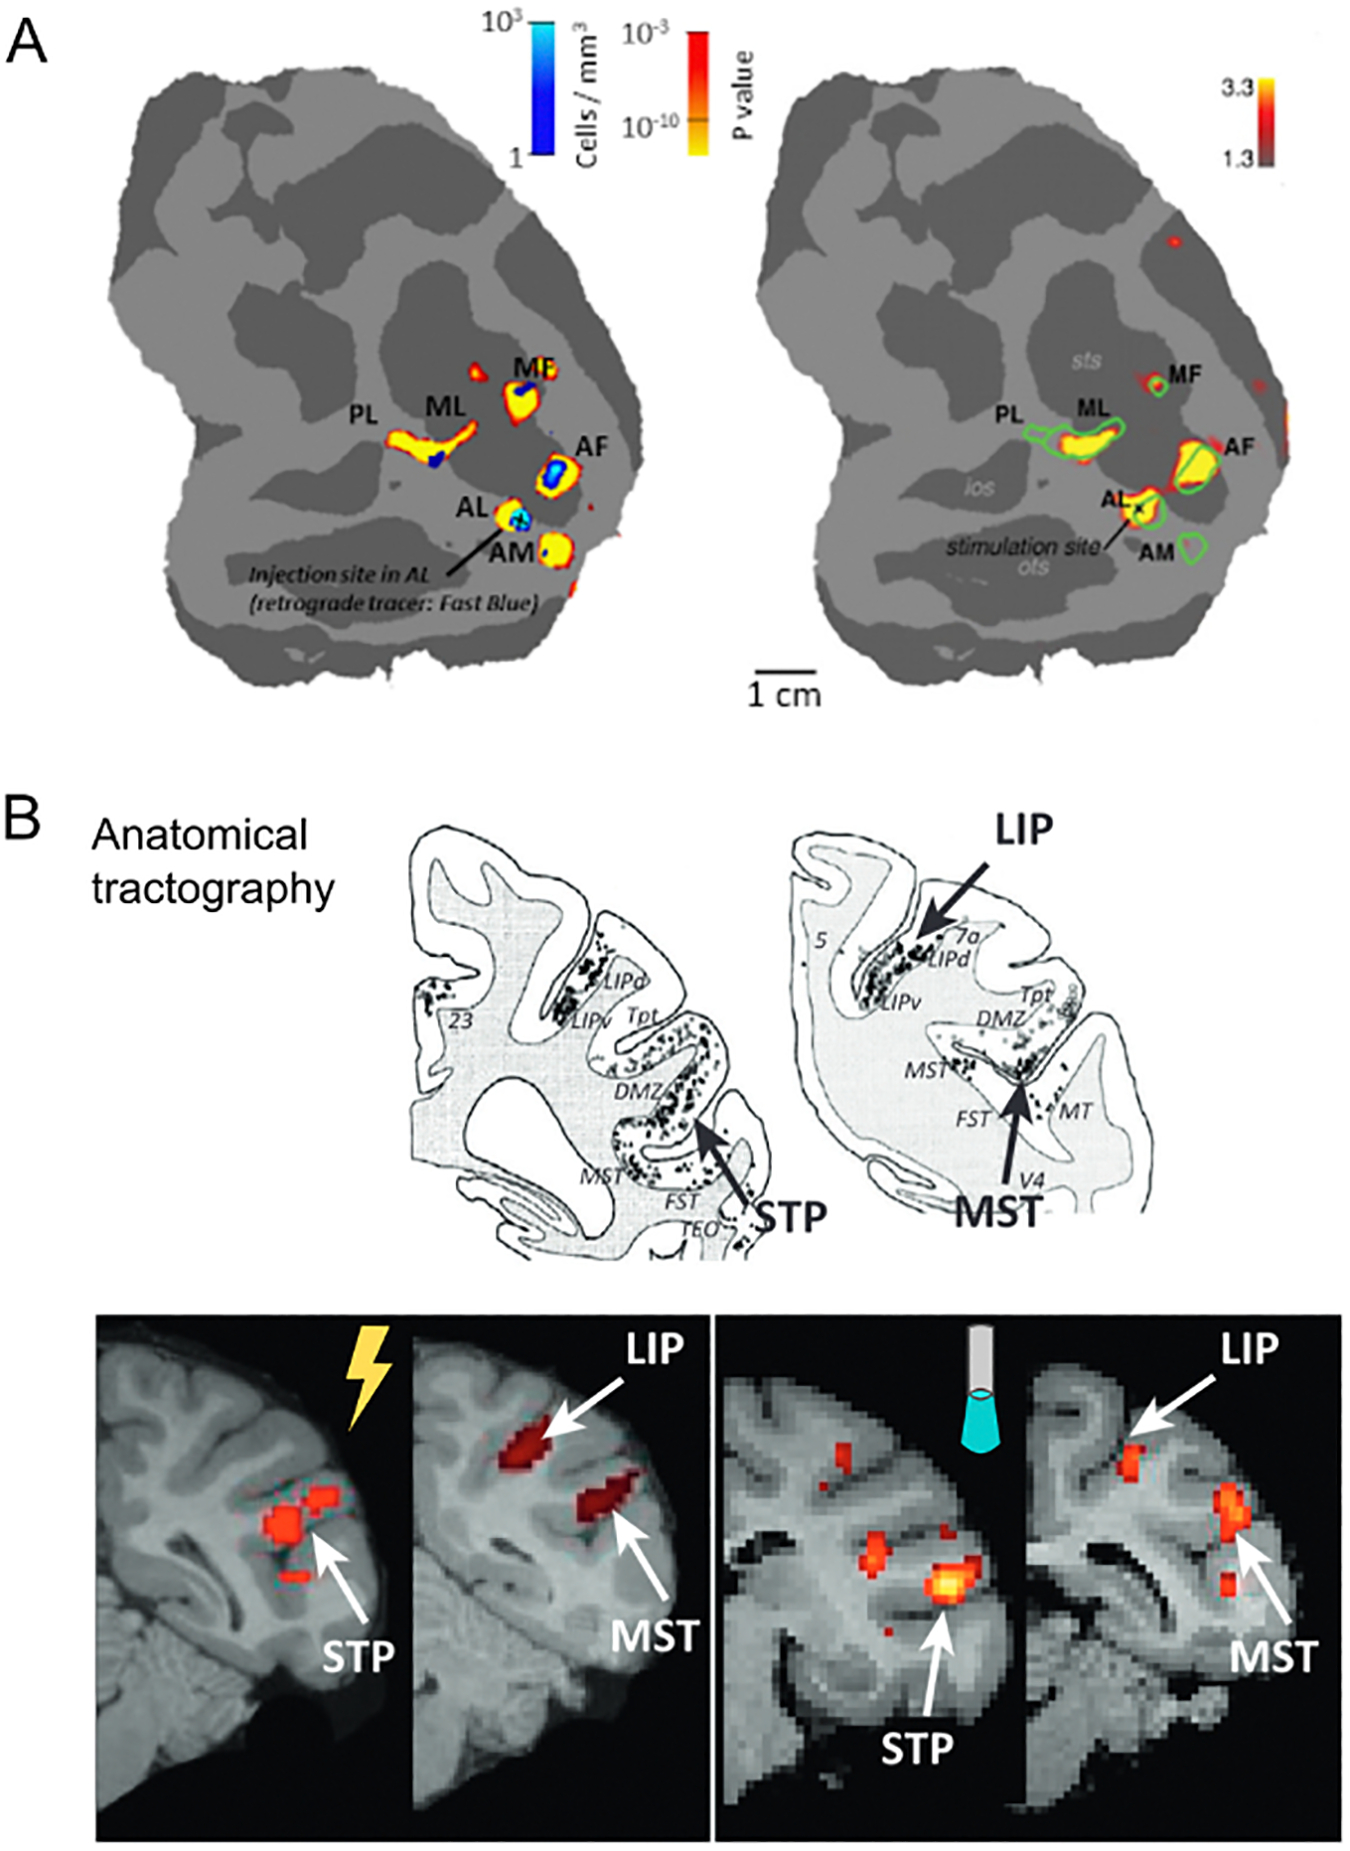
Figure 6.
A comparison of brain-perturbation based connectivity and anatomical tractography.
A) Es-fMRI effects and retrograde tracer injections in a macaque face patch within the same animal displayed on flat-maps of the right hemisphere. The left panel shows face patches (yellow) and densit...
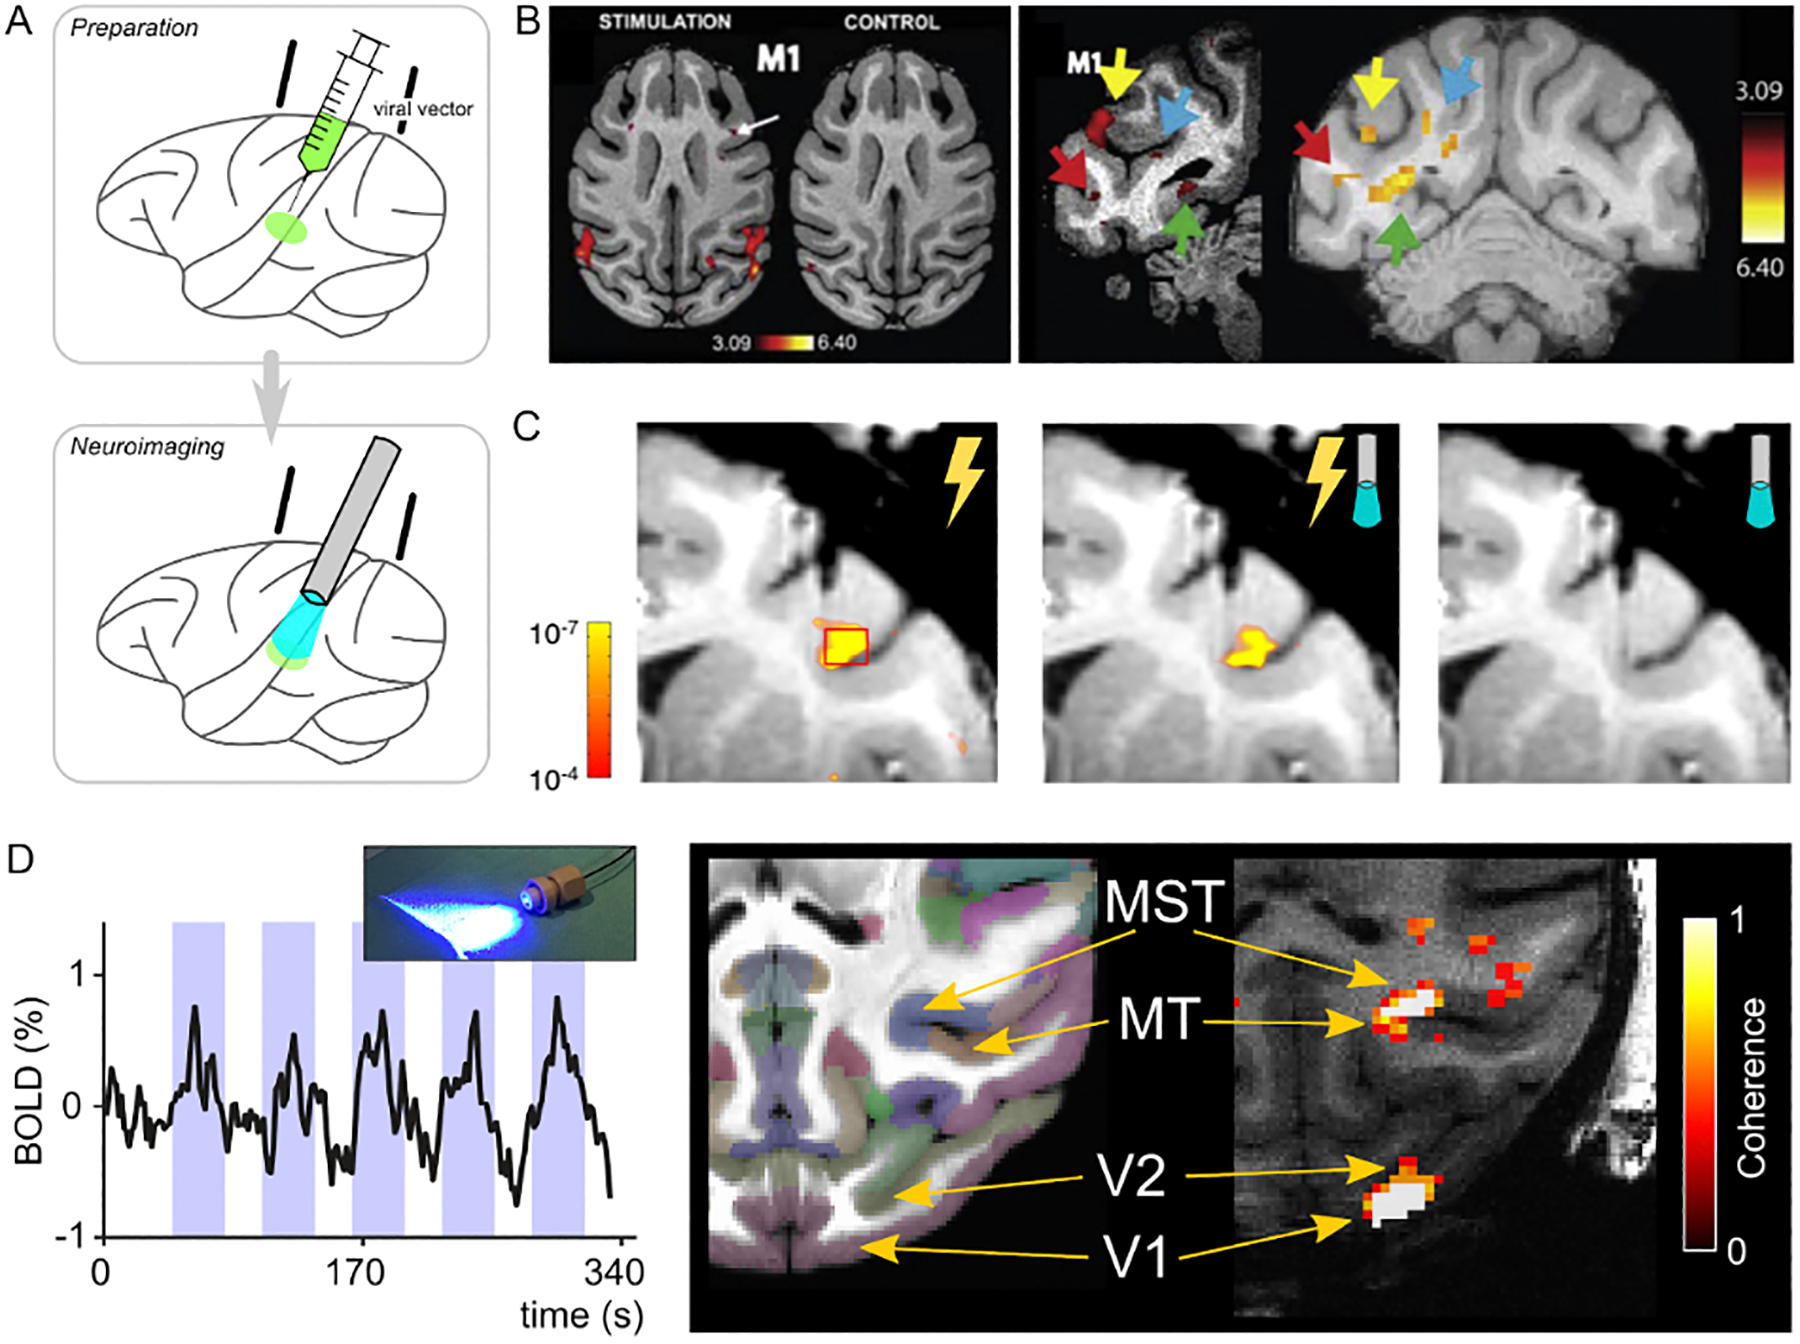
Figure 7.
Optogenetic stimulation and neuroimaging.
A) Schematic of the technique. Animals are typically implanted with a recording allowing the injection of a viral vector construct in a restricted part of the brain. In the neuroimaging experiment, ar...
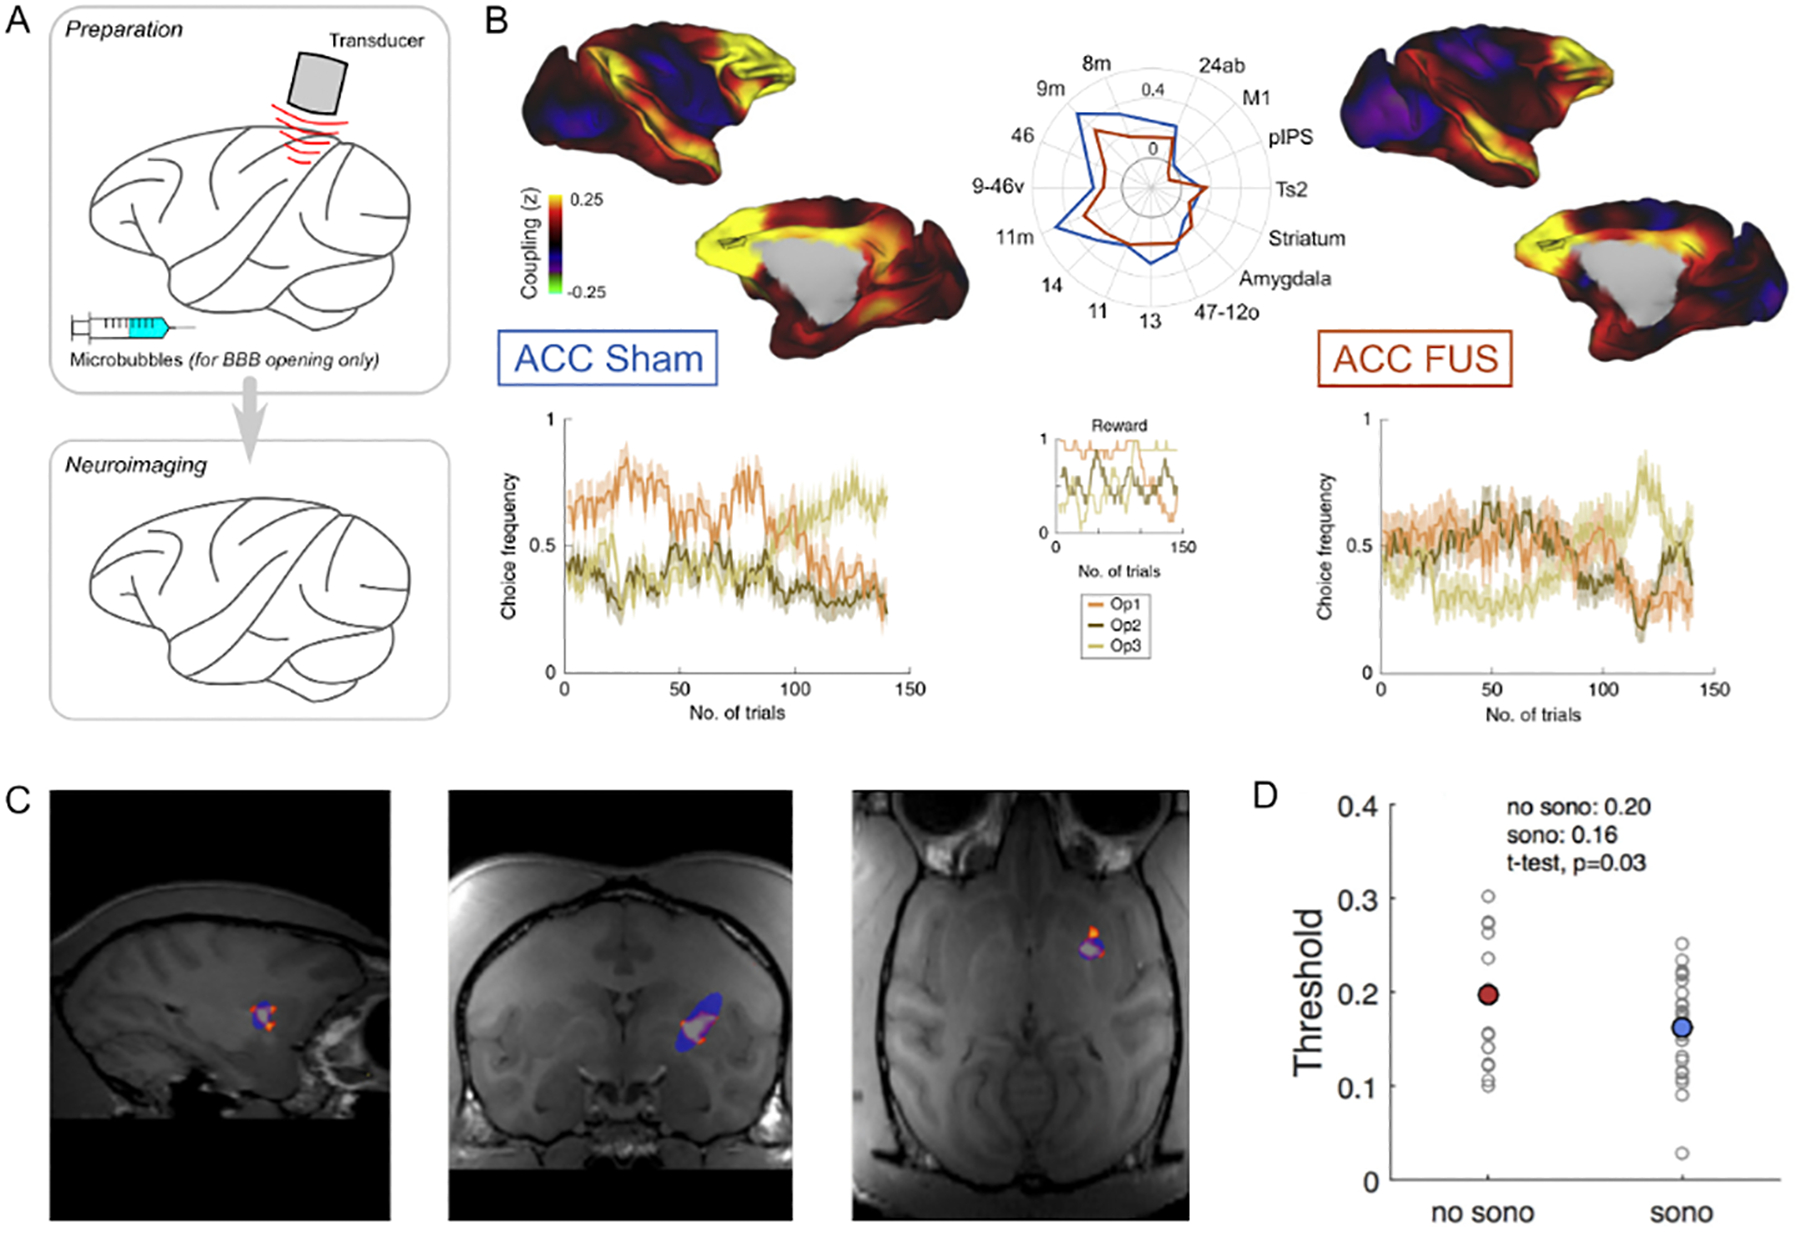
Figure 8.
Ultrasound stimulation and neuroimaging.
A) Schematic of the technique. Prior to neuroimaging, ultrasound stimulation is applied with an external transducer either with the systemic injection of microbubbles (for blood-brain-barrier opening)...
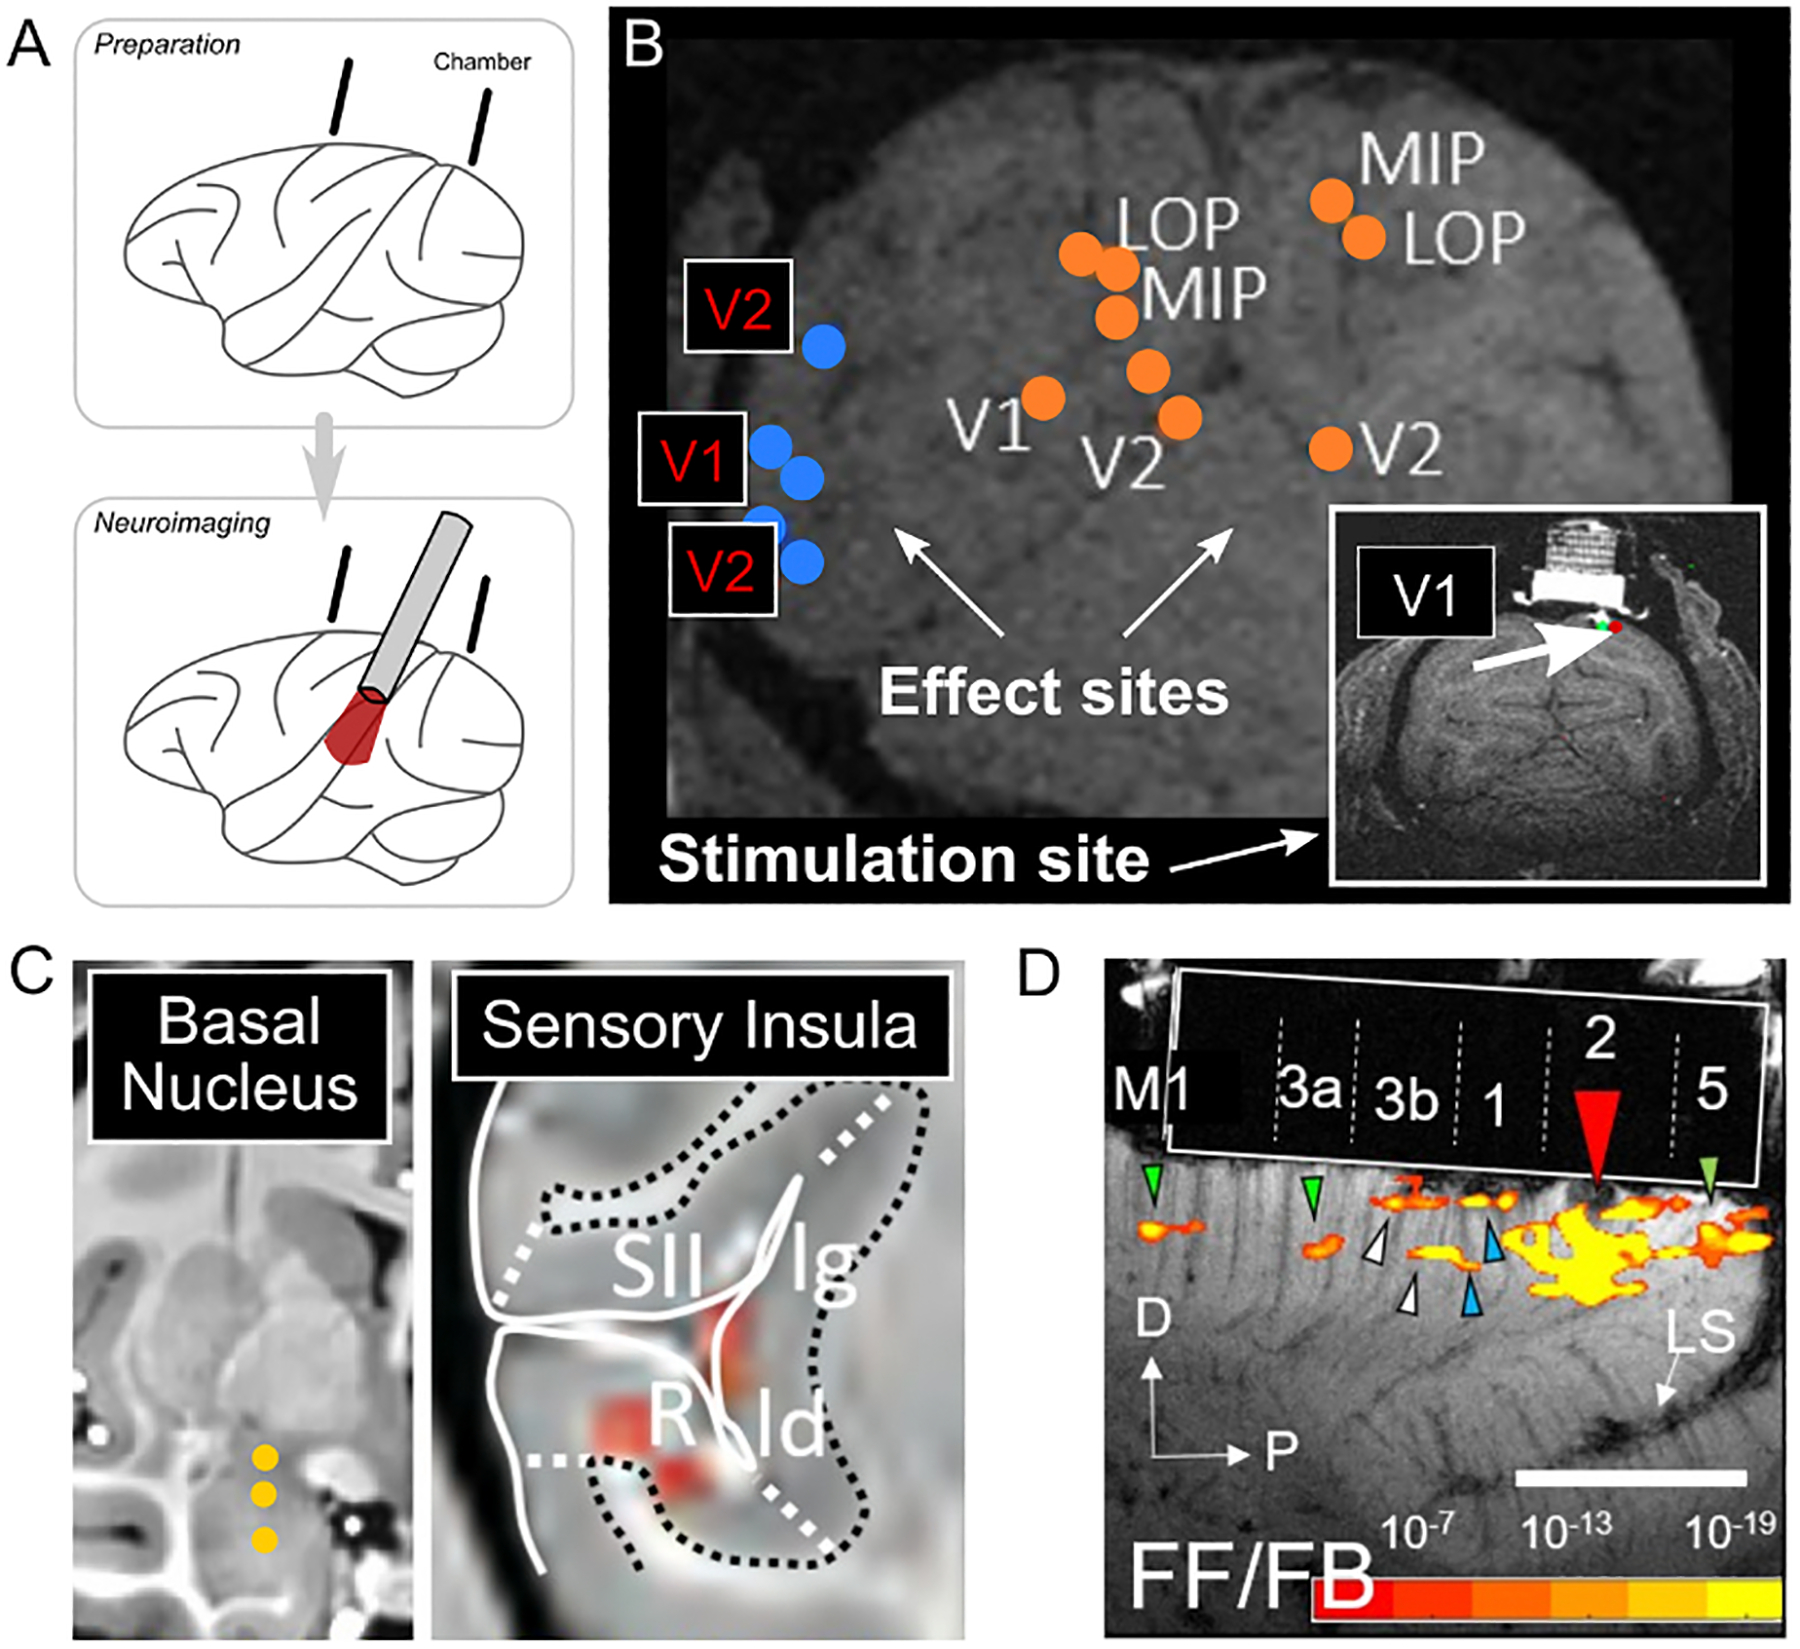
Figure 9.
Infrared Neural Stimulation (INS) and neuroimaging.
A) Schematic of the technique. After implantation of a recording chamber, optic fibers are used to focally stimulate the brain with pulsed infrared light. B) Cortical stimulation in V1 via an optic fi...
Figure images are served from the NIH/NLM PubMed Central Open Access Subset or Europe PMC; copyright remains with the publishers and authors.
💬 Discussion
0 commentsNo comments yet. Be the first to start a discussion!
Leave a Comment