Abstract
We present a portable ultrafast Semiconductor Disk Laser (SDL) (or vertical extended cavity surface emitting laser-VECSELs), to be used for nonlinear microscopy. The SDL is modelocked using a quantum-dot semiconductor saturable absorber mirror (SESAM), delivering an average output power of 287 mW, with 1.5 ps pulses at 500 MHz and a central wavelength of 965 nm. Specifically, despite the fact of having long pulses and high repetition rates, we demonstrate the potential of this laser for Two-Photon Excited Fluorescence (TPEF) imaging of in vivo Caenorhabditis elegans (C. elegans) expressing Green Fluorescent Protein (GFP) in a set of neuronal processes and cell bodies. Efficient TPEF imaging is achieved due to the fact that this wavelength matches the peak of the two-photon action cross section of this widely used fluorescent marker. The SDL extended versatility is shown by presenting Second Harmonic Generation images of pharynx, uterus, body wall muscles and its potential to be used to excite other different commercial dyes. Importantly this non-expensive, turn-key, compact laser system could be used as a platform to develop portable nonlinear bio-imaging devices.
🔬 Techniques
🧬 Organisms
✨ Fluorophores
🧪 Sample Preparation
🔬 Cell Lines
🏭 Microscope Brands
🧪 Reagent Suppliers
📷 Detectors
🎨 Filters
💻 Software Details
🏛️ Research Organizations (ROR)
Affiliated research institutions:
📋 Methods
2.1.
Experimental setup
The experimental setup shown in Fig. 1 Fig. 1 Schematic experimental setup used for nonlinear imaging. The red path corresponds to the fundamental excitation beam centered at 965nm, the blue path to the SHG emission and the green path to the TPEF emission. L# are lenses; GM are the galvanometric mirrors; OL is the objective lens (40x, NA = 1.3), CO is the condenser optics (NA = 1.4); F 1 ad F 2 are the band pass filters (F 1 transmittance = 330 – 670 nm and F 2 transmittance = 475 – 485 nm); and PMT are the photo multiplier tubes. was based on an inverted microscope (Nikon, Eclipse TE 2000U) modified to work as a laser scanning nonlinear microscope. A modelocked VECSEL (M Squared Lasers) operating at a central wavelength of 965 nm and having pulse duration of 1.5 ps and a repetition rate of 500 MHz was employed. The laser source geometry is the typical V-shaped cavity centered on the VECSEL chip mounted on a heat sink. The pump beam of this laser is focused at an angle of 45 degrees towards the VECSEL. A quantum-dot SESAM and a curved output coupling mirror form the end-mirrors of the laser cavity. To operate this laser, a simple web-based interface accessed through a PC was used to switch on the laser emission. The delivered output average power is of 287 mW corresponding to 0.4 KW peak power. The microscope is equipped with a pair of x-y galvanometric mirrors (GM) (Cambridge technology, 6215H) used to scan the excitation beam over the sample. A telescope was used to adjust the fundamental beam diameter to fill the back aperture of the microscope objective. A filter cube, containing a hot mirror (Semrock, Inc., FF670-SDi01 transmittance = 360 nm – 650 nm reflectance = 680 nm – 1080 nm) and a BG39 band pass filter were used to separate the excitation beam from the generated TPEF signal. A 40x oil immersion microscope objective with NA = 1.3, (Nikon, Plan Fluor) was used during the experiments. The SHG signal was collected by an oil immersion condenser NA = 1.4, (Nikon). A custom made forward detection mount with an attached photomultiplier tube (PMT) (Hamamatsu, H9305-04), and a band pass filter (transmittance = 475 - 485 nm) was employed to detect the SHG signal. To detect the TPEF emission a PMT (Hamamatsu, H9305-04), was mounted on one of the microscope ports. A custom made LabView interface was used to control both scanning units and the data acquisition card. The acquired in vivo images were volume rendered to allow for the 3D reconstruction employing Image J software. This procedure was repeated for the different samples for further analysis. 2.2.
Show full methods section
2.1.
Experimental setup
The experimental setup shown in Fig. 1 Fig. 1 Schematic experimental setup used for nonlinear imaging. The red path corresponds to the fundamental excitation beam centered at 965nm, the blue path to the SHG emission and the green path to the TPEF emission. L# are lenses; GM are the galvanometric mirrors; OL is the objective lens (40x, NA = 1.3), CO is the condenser optics (NA = 1.4); F 1 ad F 2 are the band pass filters (F 1 transmittance = 330 – 670 nm and F 2 transmittance = 475 – 485 nm); and PMT are the photo multiplier tubes. was based on an inverted microscope (Nikon, Eclipse TE 2000U) modified to work as a laser scanning nonlinear microscope. A modelocked VECSEL (M Squared Lasers) operating at a central wavelength of 965 nm and having pulse duration of 1.5 ps and a repetition rate of 500 MHz was employed. The laser source geometry is the typical V-shaped cavity centered on the VECSEL chip mounted on a heat sink. The pump beam of this laser is focused at an angle of 45 degrees towards the VECSEL. A quantum-dot SESAM and a curved output coupling mirror form the end-mirrors of the laser cavity. To operate this laser, a simple web-based interface accessed through a PC was used to switch on the laser emission. The delivered output average power is of 287 mW corresponding to 0.4 KW peak power. The microscope is equipped with a pair of x-y galvanometric mirrors (GM) (Cambridge technology, 6215H) used to scan the excitation beam over the sample. A telescope was used to adjust the fundamental beam diameter to fill the back aperture of the microscope objective. A filter cube, containing a hot mirror (Semrock, Inc., FF670-SDi01 transmittance = 360 nm – 650 nm reflectance = 680 nm – 1080 nm) and a BG39 band pass filter were used to separate the excitation beam from the generated TPEF signal. A 40x oil immersion microscope objective with NA = 1.3, (Nikon, Plan Fluor) was used during the experiments. The SHG signal was collected by an oil immersion condenser NA = 1.4, (Nikon). A custom made forward detection mount with an attached photomultiplier tube (PMT) (Hamamatsu, H9305-04), and a band pass filter (transmittance = 475 - 485 nm) was employed to detect the SHG signal. To detect the TPEF emission a PMT (Hamamatsu, H9305-04), was mounted on one of the microscope ports. A custom made LabView interface was used to control both scanning units and the data acquisition card. The acquired in vivo images were volume rendered to allow for the 3D reconstruction employing Image J software. This procedure was repeated for the different samples for further analysis. 2.2.
Biological sample and fluorescent dyes
A set of fixed samples were employed for testing the imaging capabilities of the laser system. These were 1μm fluorescent beads (Duke Scientific G0100) containing green fluorescing firefly dye and a fixed sample containing a mouse intestine section (Invitrogen fluo cells slide #4 F-24631). This slide contained a combination of 3 dyes: Alexa Fluor 350 to mark the mucus of goblet cells, Alexa Fluor 568 phalloidin to label the filamentous actin prevalent in the brush border and SYTOX Green nucleic acid stain to label the nuclei of goblet cells. The dyes employed for TPEF excitation/emission measurements were prepared in a solution. These were JC-1 (Invitrogen T-3168), Fluorescein (FD70 Sigma-Aldrich) and DiO (Invitrogen D3898) having a concentration of 1 mg/ml in Milli-Q water. In addition to these Calcium green (Invitrogen C-3732) and Fluo-4 (Invitrogen F-14217) were also used as supplied. Finally, a fluorescent sample, consisting of conventional red water paint (slightly diluted in water) was applied onto a zero thickness cover glass. The dried sample was placed directly at the sample plane of the microscope. The emitted fluorescent spectrum had a bandwidth of 40 nm (measured at the full width half maximum) and was centered at 600nm. For in vivo studies C. elegans nematodes expressing GFP in D-Type motoneurons (juIs76 [unc-25::gfp]) were used to perform the imaging experiments. Its transparency and easiness of lab maintenance make this model organism highly attractive for microscopy studies [ 28 ]. The strain was grown in nematode growth media and feed with OP50 ( Escherichia coli ). Adult worms were anesthetized using 0.8 μl of 25-mM sodium azide (NaN 3 ) and mounted on a 2% agar pad sandwiched between two cover glasses (No. 1 - 0.13 to 0.16 mm). The preparations were sealed using melted paraffin and were imaged at room temperature.
2.1.
Experimental setup
The experimental setup shown in Fig. 1 Fig. 1 Schematic experimental setup used for nonlinear imaging. The red path corresponds to the fundamental excitation beam centered at 965nm, the blue path to the SHG emission and the green path to the TPEF emission. L# are lenses; GM are the galvanometric mirrors; OL is the objective lens (40x, NA = 1.3), CO is the condenser optics (NA = 1.4); F 1 ad F 2 are the band pass filters (F 1 transmittance = 330 – 670 nm and F 2 transmittance = 475 – 485 nm); and PMT are the photo multiplier tubes. was based on an inverted microscope (Nikon, Eclipse TE 2000U) modified to work as a laser scanning nonlinear microscope. A modelocked VECSEL (M Squared Lasers) operating at a central wavelength of 965 nm and having pulse duration of 1.5 ps and a repetition rate of 500 MHz was employed. The laser source geometry is the typical V-shaped cavity centered on the VECSEL chip mounted on a heat sink. The pump beam of this laser is focused at an angle of 45 degrees towards the VECSEL. A quantum-dot SESAM and a curved output coupling mirror form the end-mirrors of the laser cavity. To operate this laser, a simple web-based interface accessed through a PC was used to switch on the laser emission. The delivered output average power is of 287 mW corresponding to 0.4 KW peak power. The microscope is equipped with a pair of x-y galvanometric mirrors (GM) (Cambridge technology, 6215H) used to scan the excitation beam over the sample. A telescope was used to adjust the fundamental beam diameter to fill the back aperture of the microscope objective. A filter cube, containing a hot mirror (Semrock, Inc., FF670-SDi01 transmittance = 360 nm – 650 nm reflectance = 680 nm – 1080 nm) and a BG39 band pass filter were used to separate the excitation beam from the generated TPEF signal. A 40x oil immersion microscope objective with NA = 1.3, (Nikon, Plan Fluor) was used during the experiments. The SHG signal was collected by an oil immersion condenser NA = 1.4, (Nikon). A custom made forward detection mount with an attached photomultiplier tube (PMT) (Hamamatsu, H9305-04), and a band pass filter (transmittance = 475 - 485 nm) was employed to detect the SHG signal. To detect the TPEF emission a PMT (Hamamatsu, H9305-04), was mounted on one of the microscope ports. A custom made LabView interface was used to control both scanning units and the data acquisition card. The acquired in vivo images were volume rendered to allow for the 3D reconstruction employing Image J software. This procedure was repeated for the different samples for further analysis.
📊 Figures
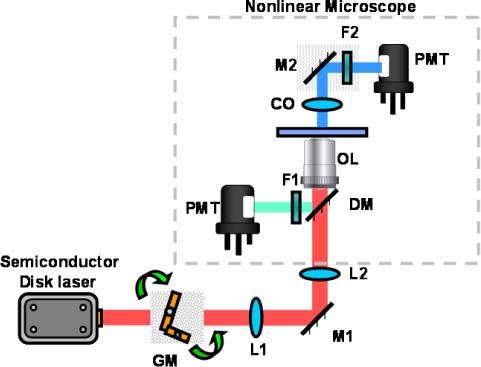
Fig. 1
Schematic experimental setup used for nonlinear imaging. The red path corresponds to the fundamental excitation beam centered at 965nm, the blue path to the SHG emission and the green path to the TPEF...
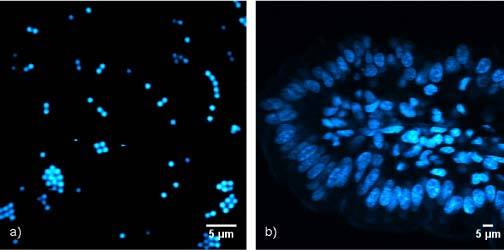
Fig. 2
TPEF images from a) green fluorescent beads and b) mouse intestine section labeled with Alexa Fluor 350 WGA (mucus of goblet cells), Alexa Fluor 568 phalloidin (filamentous actin prevalent in the brus...
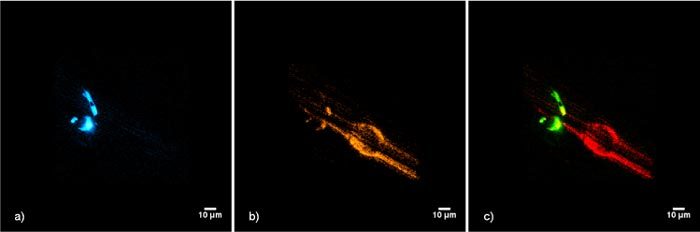
Fig. 3
3D projections of a) TPEF signal from neurons forming the nerve ring expressing GFP (blue) and b) SHG signal from the pharyngeal region (orange) of the C. elegans nematode. c) Merged TPEF (Green) and ...
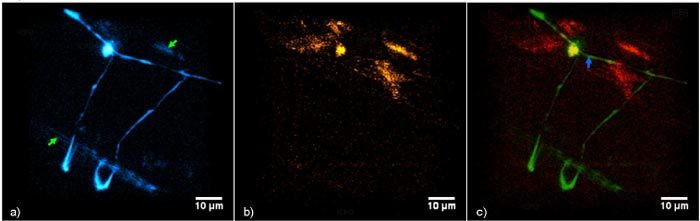
Fig. 4
3D projections of a) TPEF (blue) of a set of motoneurons expressing GFP and b) SHG (orange) signal of the muscles in the vulval region in a C. elegans mid body region. c) Merged TPEF (Green) and SHG (...
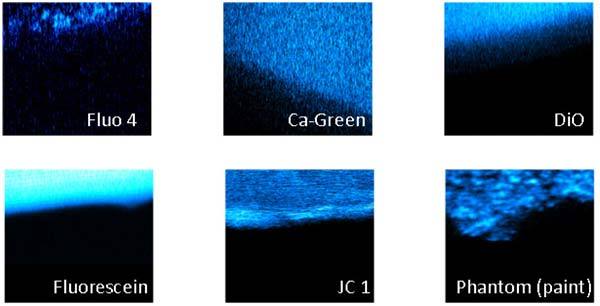
Fig. 5
TPEF images from different dyes in solution. All the images are 500x500 pixels. PMT voltages are Fluo 4: 819 V, Ca-Green: 757 V, DiO: 711 V, Fluorescein: 510 V, JC1: 478 V and Phantom (paint): 572 V. ...
Figure images are served from the NIH/NLM PubMed Central Open Access Subset or Europe PMC; copyright remains with the publishers and authors.
💬 Discussion
0 commentsNo comments yet. Be the first to start a discussion!
Leave a Comment