Abstract
Herein we developed a new "smart" Gd-based MR contrast agent (i.e., 1) which is susceptive to furin, a protease overexpressed in tumor. Under the action of furin, 1 condenses to form dimers (1-Ds) and the latter self-assemble into gadolinium nanparticles (Gd-NPs). Relaxivity of 1-D is more than 2 folds of those of 1 and magnevist at 1.5 T, and 1.4 folds of that of 1 at 3 T. Intracellular condensation of 1 in furin-overexpressed MDA-MB-468 cells was proven with direct two-photon laser microscopy (TPLM) fluorescence imaging of the cells incubated with the europium analog of 1 (i.e., 2). Intracellular Gd-NPs of 1 were uncovered and characterized for the first time. MRI of MDA-MB-468 tumors showed that 1 has enhanced MR contrast within the tumors than that of its scrambled control 1-Scr.
🔬 Techniques
🔭 Microscopes
✨ Fluorophores
🧪 Sample Preparation
🔬 Cell Lines
🏭 Microscope Brands
🧪 Reagent Suppliers
🏛️ Research Organizations (ROR)
Affiliated research institutions:
📋 Methods
General methods
All the starting materials were obtained from Adamas or Sangon Biotech. Commercially available reagents were used without further purification, unless noted otherwise. All other chemicals were reagent grade or better. Furin was purchased from Biolabs (2,000 UmL −1 ); one unit (U) is defined as the amount of furin that releases 1 pmol of methylcoumarinamide (MCA) from the fluorogenic peptide BOC-RVRR-AMC (Bachem) in one minute at 30°C. 1 H NMR spectra were obtained on a 300 MHz Bruker AV 300. MALDI-TOF/TOF mass spectra were obtained on a time-of-flight Ultrflex II mass spectrometer (Bruker Daltonics), HPLC analyses were performed on an Agilent 1200 HPLC system equipped with a G1322A pump and in-line diode array UV detector using a YMC-Pack ODS-AM column with CH 3 OH (0.1% of TFA) and water (0.1% of TFA) as the eluent. SEM images were obtained on JEOL-JSM-6700F electron microscope at an accelerating voltage of 5.0 KV. TEM images were obtained on a JEOL 2010 electron microscope, operating at 100 KV. The cryo-dried samples were prepared as following: a copper grid coated with carbon was dipped into the suspension solvent and placed into a vial, which was plunged into liquid nitrogen until no bubbles were apparent. Then water was removed from the frozen specimen by a freeze-drier. ICP-AES measurements were conducted on an ICP-96B machine equipped with a PGS-2 atomic emission spectrometer (Zeiss). ICP-MS measurements were conducted on an X Series 2 machine (Thermo Fisher Scientific).
Show full methods section
General methods
All the starting materials were obtained from Adamas or Sangon Biotech. Commercially available reagents were used without further purification, unless noted otherwise. All other chemicals were reagent grade or better. Furin was purchased from Biolabs (2,000 UmL −1 ); one unit (U) is defined as the amount of furin that releases 1 pmol of methylcoumarinamide (MCA) from the fluorogenic peptide BOC-RVRR-AMC (Bachem) in one minute at 30°C. 1 H NMR spectra were obtained on a 300 MHz Bruker AV 300. MALDI-TOF/TOF mass spectra were obtained on a time-of-flight Ultrflex II mass spectrometer (Bruker Daltonics), HPLC analyses were performed on an Agilent 1200 HPLC system equipped with a G1322A pump and in-line diode array UV detector using a YMC-Pack ODS-AM column with CH 3 OH (0.1% of TFA) and water (0.1% of TFA) as the eluent. SEM images were obtained on JEOL-JSM-6700F electron microscope at an accelerating voltage of 5.0 KV. TEM images were obtained on a JEOL 2010 electron microscope, operating at 100 KV. The cryo-dried samples were prepared as following: a copper grid coated with carbon was dipped into the suspension solvent and placed into a vial, which was plunged into liquid nitrogen until no bubbles were apparent. Then water was removed from the frozen specimen by a freeze-drier. ICP-AES measurements were conducted on an ICP-96B machine equipped with a PGS-2 atomic emission spectrometer (Zeiss). ICP-MS measurements were conducted on an X Series 2 machine (Thermo Fisher Scientific).
Cell culture
MDA-MB-468 human breast adenocarcinoma epithelial cells and Human colon carcinoma LoVo cells were cultured in Dulbecco’s modified eagle medium (GIBCO) supplemented with 10% fetal bovine serum (FBS, GIBCO). Two photon laser microscopy MDA-MB-468 or LoVo cells were cultured on the glass slide, incubated with 2 or 2-scr at 100 μM for 8 h, washed with phosphate buffered saline (PBS) for three times, fixed with 4% paraformaldehyde at RT for 30 min, washed with PBS a further three times and once with distilled water. Then the cells were mounted with 50% glycerol and imaged under a Zeiss 710 confocal laser-scanning microscope equipped with a Coherent Mrux1 titanium: sapphire mode-locked laser. The excitation wavelength for TPLM was 725 nm (2 × 362.5 nm = 725 nm). A 565–636 nm band pass filter was used for cell imaging.
Electron microscopic imaging
MDA-MB-468 cells were incubated with 1 or 1-scr at 100 μM for 8 h, washed for three times with phosphate-buffered saline (PBS), fixed with 2.5% glutaraldehyde at RT for 30 min. The cells were then detached from culture dishes, centrifuged (300 rpm, 15 min) and washed with PBS for a further three times, and then stained with 1% OsO 4 in double-distilled water for 1.5 h. Then the cells were dehydrated in ethanol and embedded in Epon. Thin sections (80 nm) were cut and mounted on copper grids, stained with saturated solution of uranyl acetate and lead citrate for electron microscope observation. In vitro and in vivo MRI The in vitro phantom MR experiments were performed on a 1.5 T (Simens, Magnetom-essenza) and 3 T (Simens, Trio-Tim) scanners, using a head RF coil. The scanning procedure began with a localizer and then consisted of a series of inversion-prepared fast spin echo images, identical in all aspects (TR 1740 ms, TE 13, BW 140 kHz, percent phase field of view 50, slice thickness 3 mm, matrix 136 × 136, NEX 1) except for the inversion time (TI) which was varied as follows: 1500, 1200, 1000, 800, 500, 400, 200, 150, 100, and 75 ms. Signal intensity (SI) versus TI relationships were fit to the following exponential T 1 decay model by non-linear least squares regression: SI(TI) = A1*exp(−TI/ T 1 ) + SI(0). Relaxation rates ( R 1 ) were determined as 1/ T 1 . Longitudinal molar relaxivities ( r 1 , units of s −1 mM −1 ) were calculated as the slope of R 1 vs [CA] after the determination of true Gd concentration of each sample by the ICP-AES or ICP-MS measurement. The in vivo MR imaging of MDA-MB-468 tumor xenografted nude mice was performed on 3 T scanner (Simens, Trio Tim), using head RF coil. Female mice of 3–4 weeks old were provided by Sun Yat-sen University Laboratory Animal Center (Guangzhou, China). MDA-MB-468 tumor lesions were established by subcutaneous dorsal flank injection of 4×10 7 tumor cells in 100 μL PBS for each mouse. Visible tumors were normally observed 2–4 weeks after injection. The tumor-xenografted mice were then subjected randomly into two groups for tail vein injections of 1 or 1-scr (1 st injection: 0.15 mmol/kg at 0 min; 2 nd injection: 0.15 mmol/kg at 50 min). The images were taken at a time sequence from 0 min to 240 min using T 1 -weighted MR acquisition sequence with the following parameters: TR 2000 ms, TE 70, BW 289 kHz, percent phase field of view 60, slice thickness 2 mm, matrix 144 × 144, NEX 1. The intensity of MR signal in tumor for each test was determined by standard region-of-interest measurement with Image J.
Western blot
MDA-MB-468 cells were incubated with 1 or 1-Scr at 100 μM for 8 h, then washed with ice-cold PBS for three times and harvested in 1.5 mL eppendorf tubes respectively, followed by centrifugation at 2,000 g and 4°C for 10 min. The supernatants were removed and the cell samples were treated with radioimmunoprecipitation assay (RIPA) lysis buffer containing 4% protease inhibitor (Roche). Cells in the mixture were broken by sonifier cell disruptor (200 W, 6 s) and lysed for 3 min on ice. Cell extracts were clarified by centrifugation at 12,000 g and 4°C for 15 min, and then mixed with SDS sample buffer for denaturation at 100°C for 10 min. Proteins were separated by sodium dodecyl sulfate polyacrylamide gel electrophoresis (SDS–PAGE) and transferred to Immun-Blot polyvinylidene fluoride (PVDF) membrane (Bio-Rad). Western blotting was carried out using anti-furin (1:1200, Sigma Aldrich) or GAPDH (1:2000, Cell Signaling Technology) at 4°C overnight and horse radish peroxidase (HRP)-conjugated secondary antibodies at room temperature for 1 h. All antibodies were used in 5% skim milk (BD Bioscience). All experiments were carried out at least in triplicate. For in vivo assay, mice were sacrificed after MR scanning and the tumors were removed and treated with RIPA lysis buffer containing 4% protease inhibitor (Roche). The tissue mixtures were broken by sonifier cell disruptor (400 W, 10 s) and lysed for 3 min on ice. Extracts were clarified by centrifugation at 12,000 g and 4°C for 15 min, and then mixed with SDS sample buffer for denaturation at 100°C for 10 min. The protocol of western blot analysis was described above. ICP-AES measurement After MR scanning, phantom samples were diluted with water until the calculated concentrations of Gd 3+ were within the range of 1–20 ppm. The exact concentration of Gd 3+ in each phantom sample was determined with a standard calibration curve using standard Gd 3+ samples at concentrations of 1, 5, 10, and 20 ppm. ICP-MS measurement After 240 min of T 1 -weighted MRI, tumor-bearing nude mice were sacrificed. Tissues and organs including lungs, brains, livers, spleens, kidneys, and tumors of these mice were collected and weighted. After that, each of the tissues was soaked in 5.0 mL of nitric acid (70%), heated for at least 6 h until the liquid was totally evaporated and the tissue was completely digested. The residue was dissolved in 2% nitric acid until the concentration of Gd 3+ was within 1–100 ppb. Exact concentration of Gd 3+ in each tissue sample was determined by comparing with the standard Gd 3+ samples at 50 ppb.
General methods
All the starting materials were obtained from Adamas or Sangon Biotech. Commercially available reagents were used without further purification, unless noted otherwise. All other chemicals were reagent grade or better. Furin was purchased from Biolabs (2,000 UmL −1 ); one unit (U) is defined as the amount of furin that releases 1 pmol of methylcoumarinamide (MCA) from the fluorogenic peptide BOC-RVRR-AMC (Bachem) in one minute at 30°C. 1 H NMR spectra were obtained on a 300 MHz Bruker AV 300. MALDI-TOF/TOF mass spectra were obtained on a time-of-flight Ultrflex II mass spectrometer (Bruker Daltonics), HPLC analyses were performed on an Agilent 1200 HPLC system equipped with a G1322A pump and in-line diode array UV detector using a YMC-Pack ODS-AM column with CH 3 OH (0.1% of TFA) and water (0.1% of TFA) as the eluent. SEM images were obtained on JEOL-JSM-6700F electron microscope at an accelerating voltage of 5.0 KV. TEM images were obtained on a JEOL 2010 electron microscope, operating at 100 KV. The cryo-dried samples were prepared as following: a copper grid coated with carbon was dipped into the suspension solvent and placed into a vial, which was plunged into liquid nitrogen until no bubbles were apparent. Then water was removed from the frozen specimen by a freeze-drier. ICP-AES measurements were conducted on an ICP-96B machine equipped with a PGS-2 atomic emission spectrometer (Zeiss). ICP-MS measurements were conducted on an X Series 2 machine (Thermo Fisher Scientific).
Supplementary Material Supplementary Information Supplementary Information Supplementary Information Supplementary Movie S1
📊 Figures
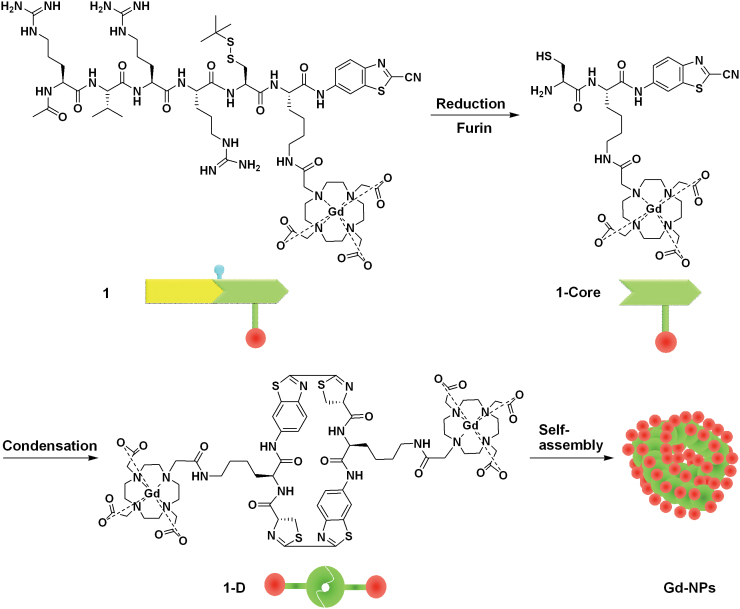
Figure 1
Shematic illustration of a furin-controlled condensation and self-assembly of Gd-NPs in cancer cells.
After entering cancer cells, the disulfide bond of probe 1 is reduced by GSH and the RVRR peptide sequence is cleaved by furin to yield the active intermediate 1-Core . Two 1-Core s condense to yield ...
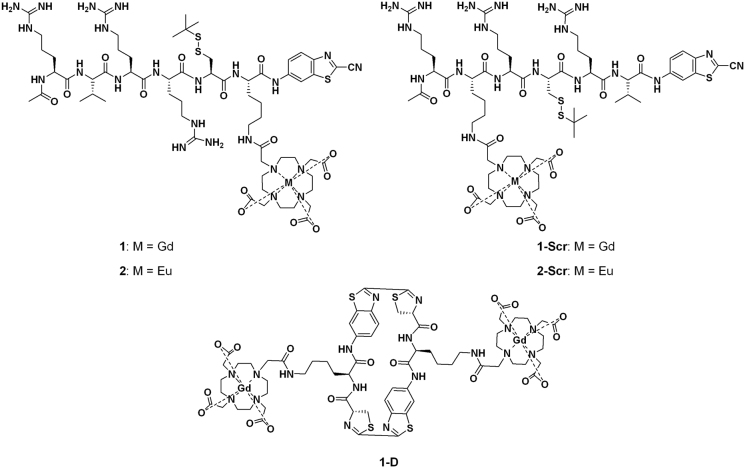
Figure 2
Chemical structures of the five designed probes.
1 , 1-Scr , and 1-D are Gd-based T 1 MR CAs. 1 is susceptive to furin, while 1-D is the condensation product of 1 after furin cleavage. 1-Scr is the scrambled control probe of 1 . 2 is the Eu analog o...

Figure 3
Characterizations of furin-controlled condensation and self-assembly of Gd-NPs of 1 in vitro .
(a) Upper, HPLC trace of 1 in water; lower, HPLC trace of the incubation mixture of 1 at 100u2005u03bcM after incubation with 1 nmol/U of furin at 30u00b0C for 17u2005h. (b) SEM and (c) TEM images of ...
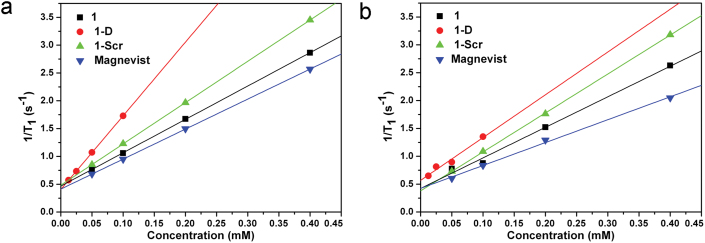
Figure 4
T 1 relaxivity measurements of 1, 1-Scr and 1-D.
Spin-lattice 1/ T 1 relaxation rates of 1 , 1-Scr , and 1-D at different concentrations in phosphate buffer (pH 7.4, 0.2u2005M) at 1.5u2005T (a) and 3u2005T (b), compared to the commercially available...
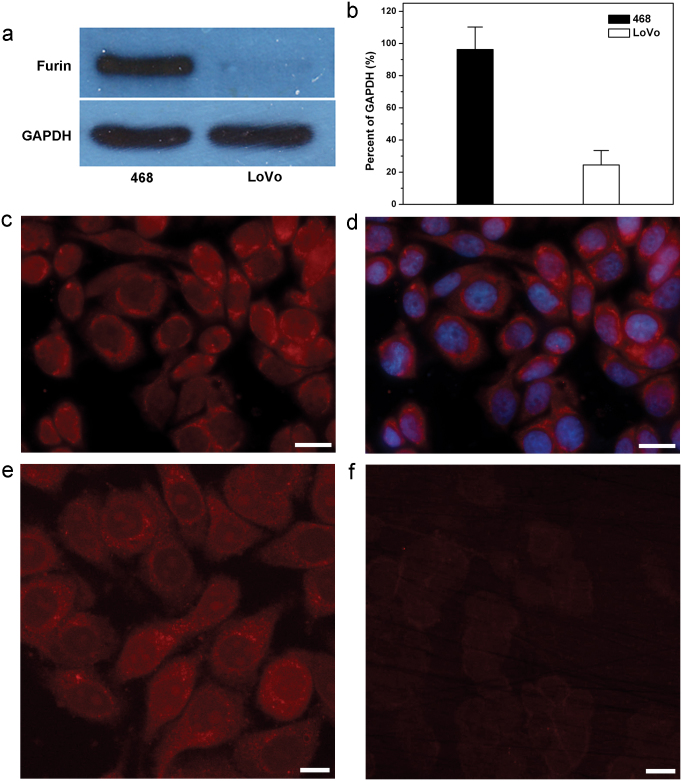
Figure 5
Expression of furin in MDA-MB-468 cells and two-photon laser microscopy images of MDA-MB-468 cells incubated with 2 or 2-Scr.
Western blot analysis (a) and quantification (b) of furin in MDA-MB-468 cells and LoVo cells. Furin was highly expressed in MDA-MB-468 cells (96.2% of GAPDH) while in LoVo cells it was less expressed ...
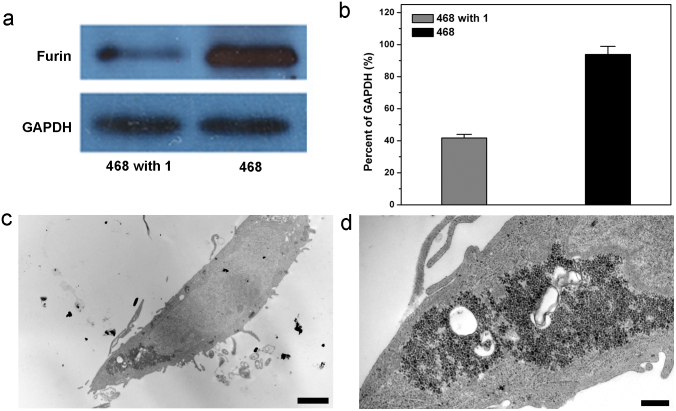
Figure 6
Expression of furin in MDA-MB-468 cells before and after incubation with 1, and electron microscopy images of the cells after 8u2005h incubation with 1.
Western blot analysis (a) and quantification (b) of furin expression levels in MDA-MB-468 cells before and after incubation with 1 at 100u2005u03bcM for 8u2005h. Expression of furin in cells treated w...
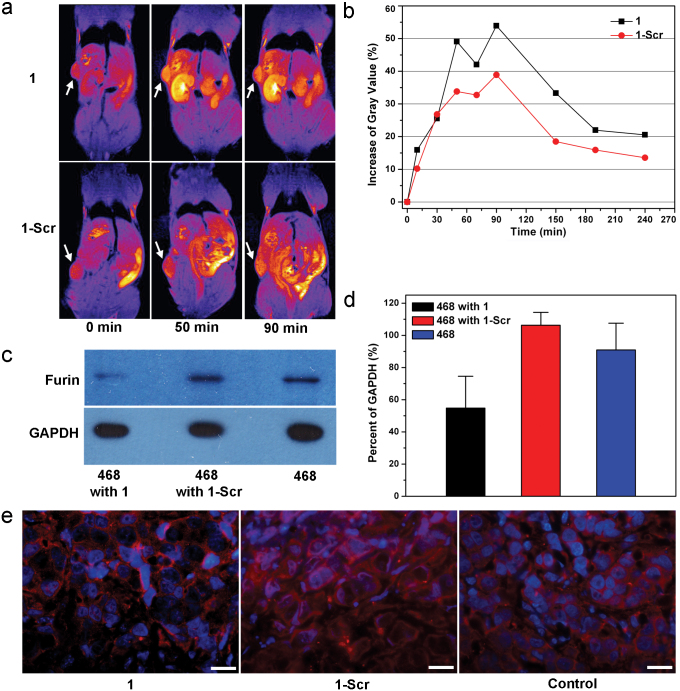
Figure 7
In vivo imaging MDA-MB-468 tumors with 1.
(a) Representative coronal MR images of mice with subcutaneously xenografted MDA-MB-468 tumors at 0u2005min, 50u2005min, and 90u2005min after two intravenous injections of 1 (upper) or 1-Scr (lower) v...
Figure images are served from the NIH/NLM PubMed Central Open Access Subset or Europe PMC; copyright remains with the publishers and authors.
💬 Discussion
0 commentsNo comments yet. Be the first to start a discussion!
Leave a Comment