Abstract
The capping of mRNA and the proofreading play essential roles in SARS-CoV-2 replication and transcription. Here, we present the cryo-EM structure of the SARS-CoV-2 replication-transcription complex (RTC) in a form identified as Cap(0)-RTC, which couples a co-transcriptional capping complex (CCC) composed of nsp12 NiRAN, nsp9, the bifunctional nsp14 possessing an N-terminal exoribonuclease (ExoN) and a C-terminal N7-methyltransferase (N7-MTase), and nsp10 as a cofactor of nsp14. Nsp9 and nsp12 NiRAN recruit nsp10/nsp14 into the Cap(0)-RTC, forming the N7-CCC to yield cap(0) (7MeGpppA) at 5' end of pre-mRNA. A dimeric form of Cap(0)-RTC observed by cryo-EM suggests an in trans backtracking mechanism for nsp14 ExoN to facilitate proofreading of the RNA in concert with polymerase nsp12. These results not only provide a structural basis for understanding co-transcriptional modification of SARS-CoV-2 mRNA but also shed light on how replication fidelity in SARS-CoV-2 is maintained.
🔬 Techniques
🔭 Microscopes
🧬 Organisms
💻 Software
✨ Fluorophores
🏭 Microscope Brands
🧪 Reagent Suppliers
📷 Detectors
💻 Software Details
💾 Data Repositories
🏛️ Research Organizations (ROR)
Affiliated research institutions:
📋 Methods
Key resources table REAGENT or RESOURCE SOURCE IDENTIFIER
Bacterial and virus strains
E. coli BL21 (DE3) TIANGEN Cat# CB105 Chemicals, peptides, and recombinant proteins n-Dodecyl β-D-maltoside (DDM) INALCO Cat# 17581350 GDP SIGMA Cat# G7127 NaF SIGMA Cat# 201154 Be 2 SO 4 ALADDIN Cat# B106711 Deposited data mCap(0)-RTC EM map This paper EMD: 31146 mCap(0)-RTC coordinate This paper PDB: 7EIZ dCap(0)-RTC EM map This paper EMD: 31138 dCap(0)-RTC coordinate This paper PDB: 7EGQ Oligonucleotides Template RNA: 5′-CAUGCCAUGGCCUC UAAAAUGUCAGCUGCUCCCUAGCAU GCUACUACCGCGUAGCAUG-3′ Takara N/A Primer RNA: 5′-GCGGUAGUAGCAUGC UAGGGAGCAG-3′ Takara N/A Recombinant DNA pET22b-nsp12 This paper N/A pET22b-nsp7 This paper N/A pET28b-SUMO-nsp8 This paper N/A pET28a-nsp13 This paper N/A pET28a-nsp9 This paper N/A pGEX6p-nsp10 This paper N/A pGEX6p-nsp9-nsp10 This paper N/A pRSF-duet-nsp14 This paper N/A Software and algorithms SerialEM Mastronarde, 2005 https://bio3d.colorado.edu/SerialEM MotionCor2 Zheng et al., 2017 https://emcore.ucsf.edu/ucsf-software RELION 3.0 Scheres, 2012 https://www3.mrc-lmb.cam.ac.uk/relion/ cryoSPARC Punjani et al., 2017 https://cryosparc.com/ UCSF Chimera Pettersen et al., 2004 https://www.cgl.ucsf.edu/chimera COOT Emsley et al., 2010 https://www.cgl.ucsf.edu/chimera PHENIX Afonine et al., 2018 https://phenix-online.org/ PyMOL Schrodinger, LLC Schrodinger Other Superdex-200 10/300 Increase GE Healthcare Cat# 28990944 Hitrap-Q HP GE Healthcare Cat# 17115401 Hitrap-SP HP GE Healthcare Cat# 17115201 Mono-Q 5/50 GL GE Healthcare Cat# 17516601 10 kDa cutoff concentrators Millipore Cat# UFC901096 100 kDa cutoff concentrators Millipore Cat# UFC910096 R0.6/1.0 200 mesh Cu holey carbon grids Quantifoil Cat# Q250CR-06 Resource availability Lead contact Further information and requests for resources and reagents should be directed to and will be fulfilled by the Lead Contact, Zihe Rao ( raozh@tsinghua.edu.cn ).
Show full methods section
Key resources table REAGENT or RESOURCE SOURCE IDENTIFIER
Bacterial and virus strains
E. coli BL21 (DE3) TIANGEN Cat# CB105 Chemicals, peptides, and recombinant proteins n-Dodecyl β-D-maltoside (DDM) INALCO Cat# 17581350 GDP SIGMA Cat# G7127 NaF SIGMA Cat# 201154 Be 2 SO 4 ALADDIN Cat# B106711 Deposited data mCap(0)-RTC EM map This paper EMD: 31146 mCap(0)-RTC coordinate This paper PDB: 7EIZ dCap(0)-RTC EM map This paper EMD: 31138 dCap(0)-RTC coordinate This paper PDB: 7EGQ Oligonucleotides Template RNA: 5′-CAUGCCAUGGCCUC UAAAAUGUCAGCUGCUCCCUAGCAU GCUACUACCGCGUAGCAUG-3′ Takara N/A Primer RNA: 5′-GCGGUAGUAGCAUGC UAGGGAGCAG-3′ Takara N/A Recombinant DNA pET22b-nsp12 This paper N/A pET22b-nsp7 This paper N/A pET28b-SUMO-nsp8 This paper N/A pET28a-nsp13 This paper N/A pET28a-nsp9 This paper N/A pGEX6p-nsp10 This paper N/A pGEX6p-nsp9-nsp10 This paper N/A pRSF-duet-nsp14 This paper N/A Software and algorithms SerialEM Mastronarde, 2005 https://bio3d.colorado.edu/SerialEM MotionCor2 Zheng et al., 2017 https://emcore.ucsf.edu/ucsf-software RELION 3.0 Scheres, 2012 https://www3.mrc-lmb.cam.ac.uk/relion/ cryoSPARC Punjani et al., 2017 https://cryosparc.com/ UCSF Chimera Pettersen et al., 2004 https://www.cgl.ucsf.edu/chimera COOT Emsley et al., 2010 https://www.cgl.ucsf.edu/chimera PHENIX Afonine et al., 2018 https://phenix-online.org/ PyMOL Schrodinger, LLC Schrodinger Other Superdex-200 10/300 Increase GE Healthcare Cat# 28990944 Hitrap-Q HP GE Healthcare Cat# 17115401 Hitrap-SP HP GE Healthcare Cat# 17115201 Mono-Q 5/50 GL GE Healthcare Cat# 17516601 10 kDa cutoff concentrators Millipore Cat# UFC901096 100 kDa cutoff concentrators Millipore Cat# UFC910096 R0.6/1.0 200 mesh Cu holey carbon grids Quantifoil Cat# Q250CR-06 Resource availability Lead contact Further information and requests for resources and reagents should be directed to and will be fulfilled by the Lead Contact, Zihe Rao ( raozh@tsinghua.edu.cn ).
Materials availability
This study did not generate new unique reagents.
Data and code availability
The cryo-EM density maps and the structures were deposited into the Electron Microscopy Data Bank (EMDB) and Protein Data Bank (PDB) with the accession numbers 31138 and 7EGQ for dCap(0)-RTC, and 31146 and 7EIZ for mCap(0)-RTC.
Experimental model and subject details
Proteins were obtained through recombinant expression in E. coli BL21 (DE3). Method details Protein production and purification The SARS-CoV-2 nsp12 (GenBank: MN908947 ) gene was cloned into a modified pET-22b vector, with the C terminus possessing a 10 × His-tag. Protein was expressed in E. coli BL21 (DE3) as described( Yan et al., 2021 ). The cells were harvested and the pellets were resuspended in a buffer (20 mM Tris-HCl, pH 8.0, 150 mM NaCl, 4 mM MgCl 2 , 10% glycerol) and homogenized with an ultra-high-pressure cell disrupter at 4°C. The insoluble material was removed by centrifugation at 14,000 rpm for 50 min. The fusion protein was first purified by Ni-NTA (Novagen, USA) affinity chromatography and then further purified by passage through a Hitrap Q ion-exchange column (GE Healthcare, USA) with buffer A (20 mM Tris-HCl, pH 8.0, 4 mM MgCl 2 , 10% glycerol, 4 mM DTT) and buffer B (20 mM Tris-HCl, pH 8.0, 1M NaCl, 4 mM MgCl 2 , 10% glycerol, 4 mM DTT). Next the sample was loaded onto a Superdex 200 10/300 Increase column (GE Healthcare, USA) with DEPC-treated buffer C (50 mM HEPES, pH 7.0, 100 mM NaCl, 4 mM MgCl 2 , 2 mM GDP and 2 mM BeF 3 - ). Purified nsp12 was concentrated to 4.8 mg/mL and stored at 4°C. The SARS-CoV-2 nsp10 was cloned into pGEX-6p vector with a N-terminal GST -tag, and SARS-CoV-2 nsp14 inserted into pRSF-duet with no tag, and co-transformed into E. coli strain BL21 (DE3). Cells were harvested by centrifugation at 4000 rpm for 10 min, and the pellets resuspended in lysis buffer (25 mM HEPES, pH7.0, 300 mM NaCl, 4 mM MgCl 2 , 5% glycerol). An ultra-high-pressure cell disrupter at 4°C was used for lysis,and the product was centrifuged for 14000 rpm at 4°C. Recombinant protein was purified by GST-affinity chromatography and the GST-tag was removed by PreScission protease. The complex was further purified by passage through a Hitrap SP ion-exchange column (GE Healthcare, USA) with buffer A (25 mM HEPES, pH 7.0, 4 mM MgCl 2 , 10% glycerol, 4 mM DTT) and buffer B (25 mM HEPES, pH7.0, 1 M NaCl, 4 mM MgCl 2 , 10% glycerol, 4 mM DTT). Then it was load onto a Superdex 200 10/300 Increase column (GE Healthcare, USA) with a buffer (50 mM HEPES, pH 7.0, 250 mM NaCl, 4 mM MgCl 2 , 4 mM DTT). Purified nsp10/nsp14 complex was concentrated to 8 mg/mL and stored at 4°C. The nsp9-10 sample was also cloned into pGEX-6p vector, and the purification of nsp9-10/nsp14 complex was identical to the procedure for nsp10/nsp14.The preparation of nsp9 was performed as described previously( Yan et al., 2021 ). Nsp9 was cloned into a modified pET-28b-SUMO with the N terminus of a fusion of 6 × His-tag. The protein was expressed in E. coli strain BL21 (DE3). After harvesting by centrifugation, the pellets were resuspended in lysis buffer (20 mM HEPES, pH 7.0 and 150 mM NaCl) and homogenized with an ultra-high-pressure cell disrupter at 4°C. The lysate was centrifuged at 12,000 rpm for 30 min to remove cell debris. The fusion protein was purified by Ni-NTA (Novagen, USA) affinity chromatography and by application to a Superdex 200 10/300 Increase column (GE Healthcare, USA) in lysis buffer. Purified nsp9 was concentrated to 5 mg/mL and stored at 4°C. Full-length SARS-CoV-2 nsp7 and nsp8 were co-expressed in E. coli BL21 (DE3) cells as a no-tagged protein and a 6 × His-SUMO fusion protein, respectively. After purification by Ni-NTA (Novagen, USA) affinity chromatography, the nsp7-nsp8 complex was eluted through on-column tag cleavage by ULP protease. The complex was further purified by using a Hitrap Q ion-exchange column (GE Healthcare, USA) and a Superdex 200 10/300 Increase column (GE Healthcare, USA) in buffer C containing 50 mM HEPES, pH 7.0, 100 mM NaCl, 4 mM MgCl 2 , 2 mM GDP and 2 mM BeF 3 - . Nsp13 was purified as described previously( Yan et al., 2021 ). The nsp13 gene was inserted into the modified pET-28a vector with a 6 × His tag attached at its N terminus, and protein was expressed in E. coli BL21 (DE3) cells. Cells were harvested and resuspended in lysis buffer (20 mM HEPES, pH 7.0, 150 mM NaCl, 4 mM MgCl 2 , 10% glycerol). The cells were centrifuged at 14,000 rpm for 40 min and then lysed by high-pressure homogenization and sonication. The fusion protein was purified by Ni-NTA (Novagen, USA) affinity chromatography and Hitrap SP ion-exchange column (GE Healthcare, USA), and finally nsp13 protein was loaded onto a Superdex 200 10/300 Increase column (GE Healthcare, USA) in buffer C. Purified nsp13 was concentrated to 8 mg/mL and stored at 4°C. Assembly of the Cap(0)-RTC Nsp12 was incubated with nsp7 and nsp8 at 4°C for three hours in a molar ratio of 1: 2: 2 in buffer (50 mM HEPES, pH 7.0, 100 mM NaCl and 4 mM MgCl 2 ). Next, the mixture was purified by mono Q 5/50 ion-exchange chromatography (GE Healthcare, USA), producing the nsp7-nsp8-nsp12 complex (C-RTC). C-RTC and nsp13 and RNA were mixed to form E-RTC at a 1:2:1 molar ratio as described previously( Yan et al., 2020 ). E-RTC was incubated with the nsp9-nsp10/nsp14 complex at a 1:1.2 molar ratio with 2 mM GDP•BeF 3 - to assemble the Cap(0)-RTC.
Native electrophoretic mobility shift assays
The binding reaction buffer contained 50 mM HEPES, pH 7.0, 100 mM NaCl, 2 mM MgCl 2 , 2 mM GDP and 2 mM BeF 3 - . 18 μg RdRp (nsp12-nsp7-nsp8) complex protein was combined with 1.5 μg template-primer RNA, and RdRp/RNA and nsp13, or nsp9, or nsp10/14 mixed in a 1:2, or 1:1.2, or 1:1.2 molar ratio. Binding reactions were incubated for 30 min at 30°C. Reactions were run on a six lane polyacrylamide native gel (37.5:1 acrylamide:bis-acrylamide) running in 1 × TBE buffer at 150 V for 1h in 4°C. The gel was stained with ethidium bromide.
Cryo-EM sample preparation and data collection
In total, 3 μL of protein sample at 3 mg/mL (added with 0.025% DDM) was applied onto a H2/O2 glow-discharged, 200-mesh Quantifoil R0.6/1.0 grid (Quantifoil, Micro Tools GmbH, Germany). The grid was then blotted for 3.0 s with a blot force of 0 at 8°C and 100% humidity and plunge-frozen in liquid ethane using a Vitrobot (Thermo Fisher Scientific, USA). Cryo-EM data were collected with a 300 keV Titan Krios electron microscope (Thermo Fisher Scientific, USA) and a K3 direct electron detector (Gatan, USA). Images were recorded at 22500 × magnification and calibrated at a super-resolution pixel size of 0.82 Å/pixel. The exposure time was set to 2 s with a total accumulated dose of 60 electrons per Å 2 . All images were automatically recorded using SerialEM. A total of 12,704 images were collected with a defocus range from −2.0 μm to −1.0 μm. Statistics for data collection and refinement are in Table S1 . The methods for processing are described in Figures S2 and S4 .
Cryo-EM image processing
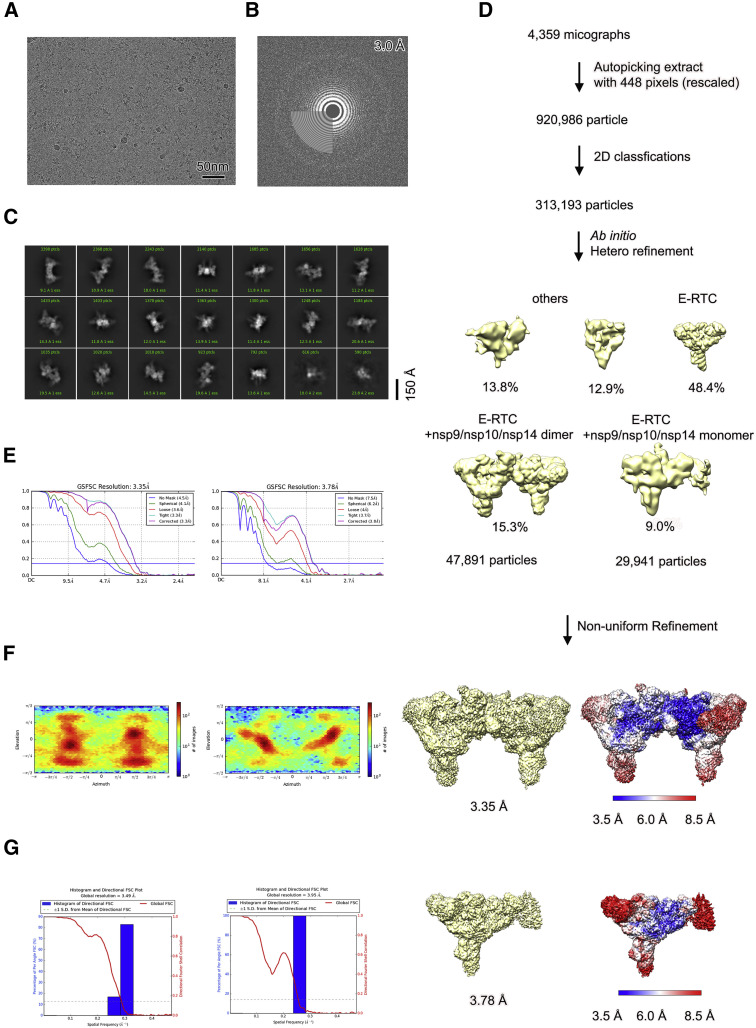
All dose-fractioned images were motion-corrected and dose-weighted by MotionCorr2( Zheng et al., 2017 ) software and their contrast transfer functions were estimated by ctffind4( Rohou and Grigorieff, 2015 ). A total of 2,039,214 particles were auto-picked using the model from SARS-CoV-2 Cap(−1)’-RTC (PDB: 7CYQ )( Yan et al., 2021 ) and extracted with a box size of 448 pixels in cryoSPARC( Punjani et al., 2017 ). The following 2D, 3D classifications and refinements were all performed in cryoSPARC. 887,588 particles were selected after two rounds of 2D classification based on complex integrity. This particle set was used to do Ab-Initio reconstruction in five classes, which were then used as 3D volume templates for heterogeneous refinement, with 135,801 particles converged into dCap(0)-RTC complex class and 80,256 particles converged into mCap(0)-RTC complex class. Next, these particles were imported into RELION 3.03( Scheres, 2012 ) to perform local classification to obtain one class particle with final resolution 3.35 Å and 3.78 Å, respectively. The methods are described in Figures S2 and S4 .
Model building and refinement
To build the structure of SARS-CoV-2 Cap(0)-RTC complex, we started with the model of the SARS-CoV-2 nsp12 and nsp7-8 complex (PDB: 7BTF ), SARS-CoV-2 nsp13 (PDB: 6ZSL ), nsp9 (PDB: 6W9Q ) and nsp10/nsp14 (PDB: 6C8S ). These were individually placed and rigid-body fitted into the cryo-EM map using UCSF Chimera( Pettersen et al., 2004 ). The model was manually built in Coot( Emsley et al., 2010 ) with the guidance of the cryo-EM map, and with real space refinement using Phenix( Afonine et al., 2018 ). The data validation statistics are shown in Table S1 .
Quantification and statistical analysis In Figures
S2 and S4 , the resolution estimations of cryo-EM density maps are based on the 0.143 Fourier Shell Correlation (FSC) criterion( Chen et al., 2013 ; Rosenthal and Henderson, 2003 ).
Materials availability
This study did not generate new unique reagents.
Experimental model and subject details
Proteins were obtained through recombinant expression in E. coli BL21 (DE3).
Method details Protein production and purification The SARS-CoV-2 nsp12 (GenBank: MN908947 ) gene was cloned into a modified pET-22b vector, with the C terminus possessing a 10 × His-tag. Protein was expressed in E. coli BL21 (DE3) as described( Yan et al., 2021 ). The cells were harvested and the pellets were resuspended in a buffer (20 mM Tris-HCl, pH 8.0, 150 mM NaCl, 4 mM MgCl 2 , 10% glycerol) and homogenized with an ultra-high-pressure cell disrupter at 4°C. The insoluble material was removed by centrifugation at 14,000 rpm for 50 min. The fusion protein was first purified by Ni-NTA (Novagen, USA) affinity chromatography and then further purified by passage through a Hitrap Q ion-exchange column (GE Healthcare, USA) with buffer A (20 mM Tris-HCl, pH 8.0, 4 mM MgCl 2 , 10% glycerol, 4 mM DTT) and buffer B (20 mM Tris-HCl, pH 8.0, 1M NaCl, 4 mM MgCl 2 , 10% glycerol, 4 mM DTT). Next the sample was loaded onto a Superdex 200 10/300 Increase column (GE Healthcare, USA) with DEPC-treated buffer C (50 mM HEPES, pH 7.0, 100 mM NaCl, 4 mM MgCl 2 , 2 mM GDP and 2 mM BeF 3 - ). Purified nsp12 was concentrated to 4.8 mg/mL and stored at 4°C. The SARS-CoV-2 nsp10 was cloned into pGEX-6p vector with a N-terminal GST -tag, and SARS-CoV-2 nsp14 inserted into pRSF-duet with no tag, and co-transformed into E. coli strain BL21 (DE3). Cells were harvested by centrifugation at 4000 rpm for 10 min, and the pellets resuspended in lysis buffer (25 mM HEPES, pH7.0, 300 mM NaCl, 4 mM MgCl 2 , 5% glycerol). An ultra-high-pressure cell disrupter at 4°C was used for lysis,and the product was centrifuged for 14000 rpm at 4°C. Recombinant protein was purified by GST-affinity chromatography and the GST-tag was removed by PreScission protease. The complex was further purified by passage through a Hitrap SP ion-exchange column (GE Healthcare, USA) with buffer A (25 mM HEPES, pH 7.0, 4 mM MgCl 2 , 10% glycerol, 4 mM DTT) and buffer B (25 mM HEPES, pH7.0, 1 M NaCl, 4 mM MgCl 2 , 10% glycerol, 4 mM DTT). Then it was load onto a Superdex 200 10/300 Increase column (GE Healthcare, USA) with a buffer (50 mM HEPES, pH 7.0, 250 mM NaCl, 4 mM MgCl 2 , 4 mM DTT). Purified nsp10/nsp14 complex was concentrated to 8 mg/mL and stored at 4°C. The nsp9-10 sample was also cloned into pGEX-6p vector, and the purification of nsp9-10/nsp14 complex was identical to the procedure for nsp10/nsp14.The preparation of nsp9 was performed as described previously( Yan et al., 2021 ). Nsp9 was cloned into a modified pET-28b-SUMO with the N terminus of a fusion of 6 × His-tag. The protein was expressed in E. coli strain BL21 (DE3). After harvesting by centrifugation, the pellets were resuspended in lysis buffer (20 mM HEPES, pH 7.0 and 150 mM NaCl) and homogenized with an ultra-high-pressure cell disrupter at 4°C. The lysate was centrifuged at 12,000 rpm for 30 min to remove cell debris. The fusion protein was purified by Ni-NTA (Novagen, USA) affinity chromatography and by application to a Superdex 200 10/300 Increase column (GE Healthcare, USA) in lysis buffer. Purified nsp9 was concentrated to 5 mg/mL and stored at 4°C. Full-length SARS-CoV-2 nsp7 and nsp8 were co-expressed in E. coli BL21 (DE3) cells as a no-tagged protein and a 6 × His-SUMO fusion protein, respectively. After purification by Ni-NTA (Novagen, USA) affinity chromatography, the nsp7-nsp8 complex was eluted through on-column tag cleavage by ULP protease. The complex was further purified by using a Hitrap Q ion-exchange column (GE Healthcare, USA) and a Superdex 200 10/300 Increase column (GE Healthcare, USA) in buffer C containing 50 mM HEPES, pH 7.0, 100 mM NaCl, 4 mM MgCl 2 , 2 mM GDP and 2 mM BeF 3 - . Nsp13 was purified as described previously( Yan et al., 2021 ). The nsp13 gene was inserted into the modified pET-28a vector with a 6 × His tag attached at its N terminus, and protein was expressed in E. coli BL21 (DE3) cells. Cells were harvested and resuspended in lysis buffer (20 mM HEPES, pH 7.0, 150 mM NaCl, 4 mM MgCl 2 , 10% glycerol). The cells were centrifuged at 14,000 rpm for 40 min and then lysed by high-pressure homogenization and sonication. The fusion protein was purified by Ni-NTA (Novagen, USA) affinity chromatography and Hitrap SP ion-exchange column (GE Healthcare, USA), and finally nsp13 protein was loaded onto a Superdex 200 10/300 Increase column (GE Healthcare, USA) in buffer C. Purified nsp13 was concentrated to 8 mg/mL and stored at 4°C. Assembly of the Cap(0)-RTC Nsp12 was incubated with nsp7 and nsp8 at 4°C for three hours in a molar ratio of 1: 2: 2 in buffer (50 mM HEPES, pH 7.0, 100 mM NaCl and 4 mM MgCl 2 ). Next, the mixture was purified by mono Q 5/50 ion-exchange chromatography (GE Healthcare, USA), producing the nsp7-nsp8-nsp12 complex (C-RTC). C-RTC and nsp13 and RNA were mixed to form E-RTC at a 1:2:1 molar ratio as described previously( Yan et al., 2020 ). E-RTC was incubated with the nsp9-nsp10/nsp14 complex at a 1:1.2 molar ratio with 2 mM GDP•BeF 3 - to assemble the Cap(0)-RTC.
Native electrophoretic mobility shift assays
The binding reaction buffer contained 50 mM HEPES, pH 7.0, 100 mM NaCl, 2 mM MgCl 2 , 2 mM GDP and 2 mM BeF 3 - . 18 μg RdRp (nsp12-nsp7-nsp8) complex protein was combined with 1.5 μg template-primer RNA, and RdRp/RNA and nsp13, or nsp9, or nsp10/14 mixed in a 1:2, or 1:1.2, or 1:1.2 molar ratio. Binding reactions were incubated for 30 min at 30°C. Reactions were run on a six lane polyacrylamide native gel (37.5:1 acrylamide:bis-acrylamide) running in 1 × TBE buffer at 150 V for 1h in 4°C. The gel was stained with ethidium bromide.
Cryo-EM sample preparation and data collection
In total, 3 μL of protein sample at 3 mg/mL (added with 0.025% DDM) was applied onto a H2/O2 glow-discharged, 200-mesh Quantifoil R0.6/1.0 grid (Quantifoil, Micro Tools GmbH, Germany). The grid was then blotted for 3.0 s with a blot force of 0 at 8°C and 100% humidity and plunge-frozen in liquid ethane using a Vitrobot (Thermo Fisher Scientific, USA). Cryo-EM data were collected with a 300 keV Titan Krios electron microscope (Thermo Fisher Scientific, USA) and a K3 direct electron detector (Gatan, USA). Images were recorded at 22500 × magnification and calibrated at a super-resolution pixel size of 0.82 Å/pixel. The exposure time was set to 2 s with a total accumulated dose of 60 electrons per Å 2 . All images were automatically recorded using SerialEM. A total of 12,704 images were collected with a defocus range from −2.0 μm to −1.0 μm. Statistics for data collection and refinement are in Table S1 . The methods for processing are described in Figures S2 and S4 .
Cryo-EM image processing
All dose-fractioned images were motion-corrected and dose-weighted by MotionCorr2( Zheng et al., 2017 ) software and their contrast transfer functions were estimated by ctffind4( Rohou and Grigorieff, 2015 ). A total of 2,039,214 particles were auto-picked using the model from SARS-CoV-2 Cap(−1)’-RTC (PDB: 7CYQ )( Yan et al., 2021 ) and extracted with a box size of 448 pixels in cryoSPARC( Punjani et al., 2017 ). The following 2D, 3D classifications and refinements were all performed in cryoSPARC. 887,588 particles were selected after two rounds of 2D classification based on complex integrity. This particle set was used to do Ab-Initio reconstruction in five classes, which were then used as 3D volume templates for heterogeneous refinement, with 135,801 particles converged into dCap(0)-RTC complex class and 80,256 particles converged into mCap(0)-RTC complex class. Next, these particles were imported into RELION 3.03( Scheres, 2012 ) to perform local classification to obtain one class particle with final resolution 3.35 Å and 3.78 Å, respectively. The methods are described in Figures S2 and S4 .
Model building and refinement
To build the structure of SARS-CoV-2 Cap(0)-RTC complex, we started with the model of the SARS-CoV-2 nsp12 and nsp7-8 complex (PDB: 7BTF ), SARS-CoV-2 nsp13 (PDB: 6ZSL ), nsp9 (PDB: 6W9Q ) and nsp10/nsp14 (PDB: 6C8S ). These were individually placed and rigid-body fitted into the cryo-EM map using UCSF Chimera( Pettersen et al., 2004 ). The model was manually built in Coot( Emsley et al., 2010 ) with the guidance of the cryo-EM map, and with real space refinement using Phenix( Afonine et al., 2018 ). The data validation statistics are shown in Table S1 .
Supplemental information Document S1. Tables S1–S3 Video S1. A movie for the proposed in trans backtracking proofreading
📊 Figures
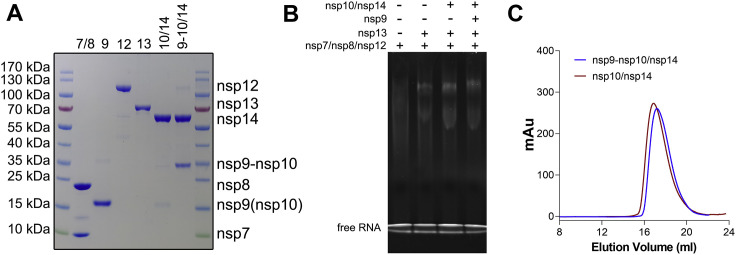
Figureu00a0S1
Biochemical analysis, related to Figureu00a01 (A) 10% SDS-PAGE analysis of the components used to constitute the RTCs. Lanes 1 and 8, markers; lane 2, nsp7/nsp8; lane 3, nsp9; lane 4, nsp12; lane 5, n...
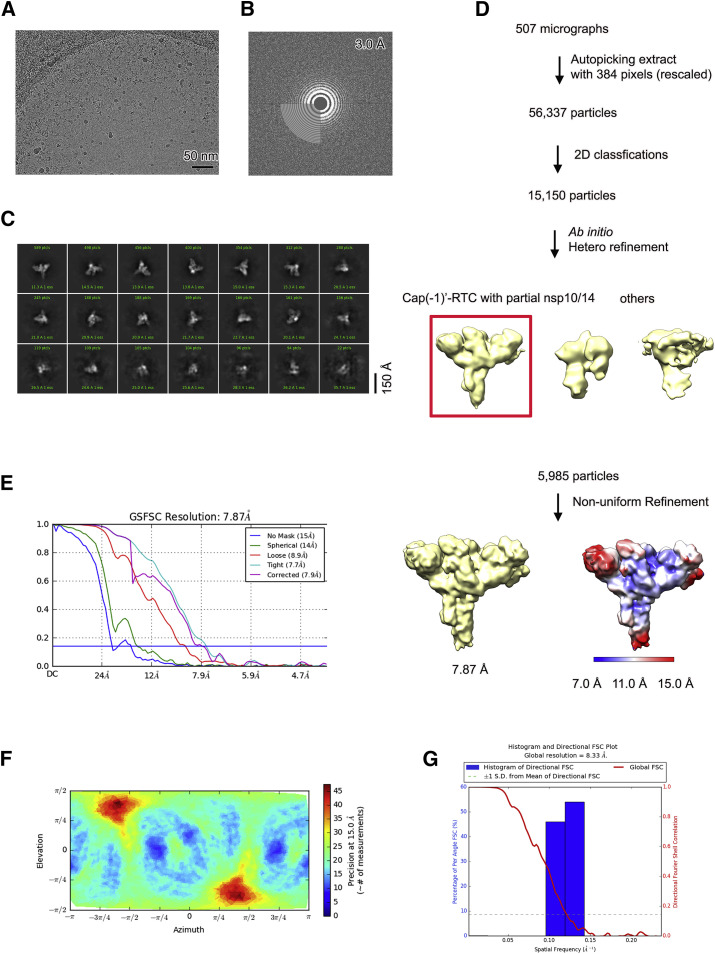
Figureu00a0S2
Cryo-EM reconstruction of SARS-CoV-2 Cap(u22121)u2032-RTC incubated with nsp10/nsp14, related to Figureu00a01 (A) Raw image of the SARS-CoV-2 Cap(-)u2019-RTC with nsp10/14 complex particles in vitreou...
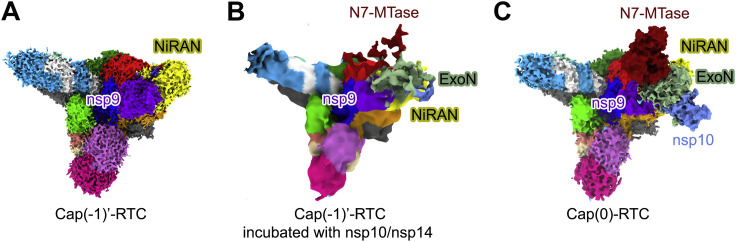
Figureu00a0S3
Comparison of cryo-EM densities, related to Figureu00a01 The cryo-EM densities of Cap(u22121)u2019-RTC ( A ), initial test dataset for Cap(u22121)u2019-RTC incubated with nsp10/nsp14 ( B ), and mCap(0...
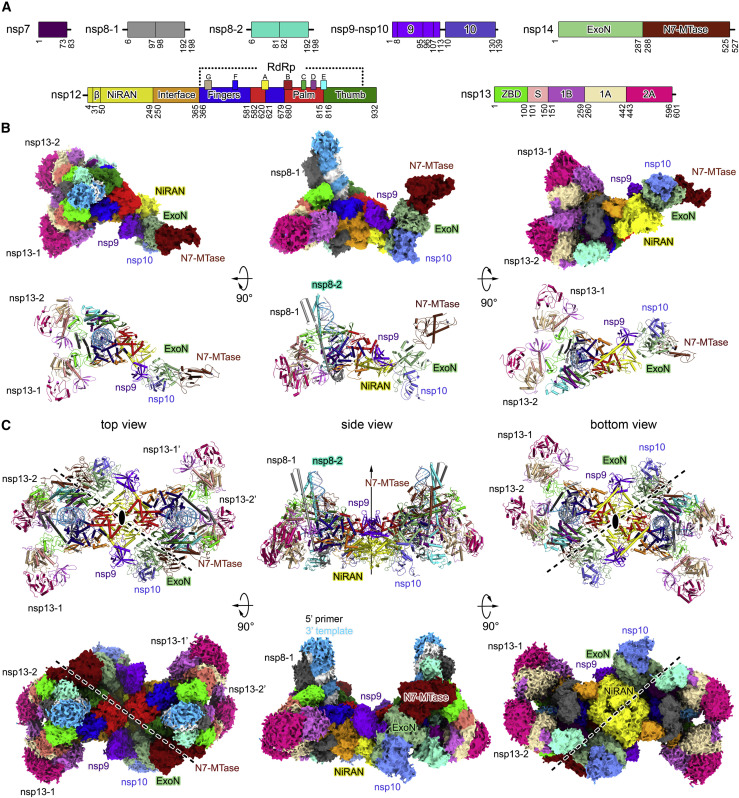
Figureu00a01
Overall structure (A) Domain organization of each component in Cap(0)-RTC. The color scheme for each component in Cap(0)-RTC is generally similar to that used previously ( Gao etu00a0al., 2020 ; Yan e...
Figureu00a0S4
Cryo-EM reconstruction of SARS-CoV-2 Cap(0)-RTC, related to Figureu00a01 (A) Raw image of the dCap(0)-RTC and mCap(0)-RTC particles in vitreous ice recorded at defocus values of u22121.0 to u22121.8u0...
Figureu00a0S5
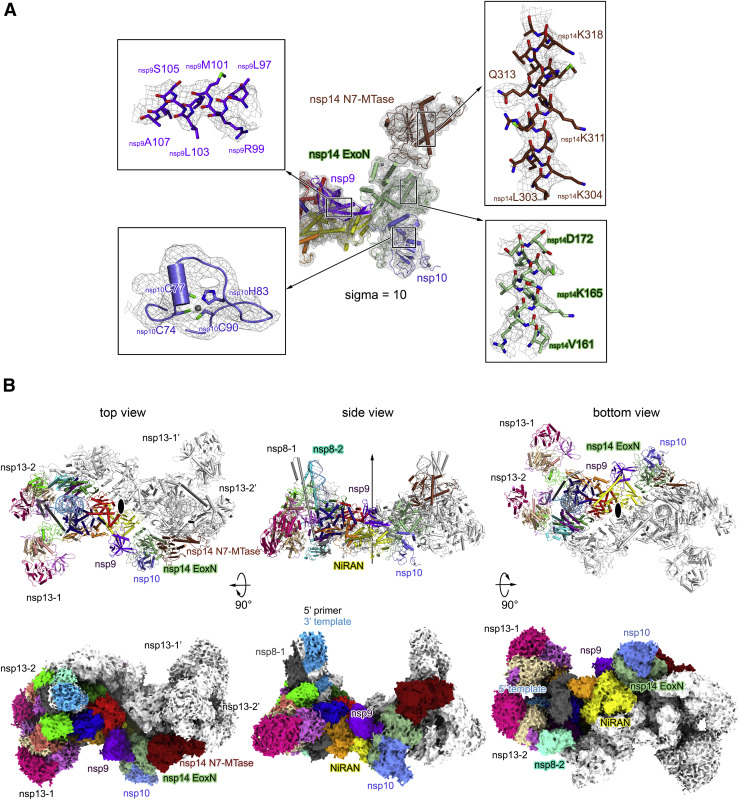
Density and structure of Cap(0)-RTC, related to Figureu00a01 (A) Density of Cap(0)-RTC (Related to Figureu00a01 ). Structures of Nsp12 NiRAN, nsp9, nsp10 and nsp14 are overlaid with the cryo-EM map of...
Figureu00a02
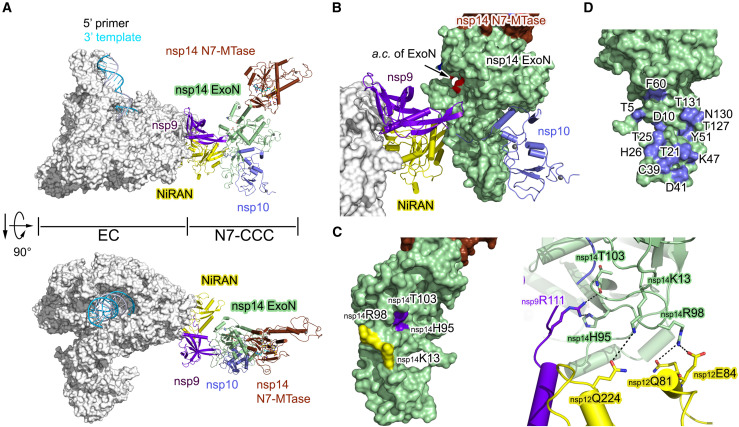
Architecture of N7-CCC (A) N7-CCC in Cap(0)-RTC protomer is shown as colored cartoons from a side view (top panel) and a top view (bottom panel). For a clear representation, the components of EC in Ca...
Figureu00a0S6
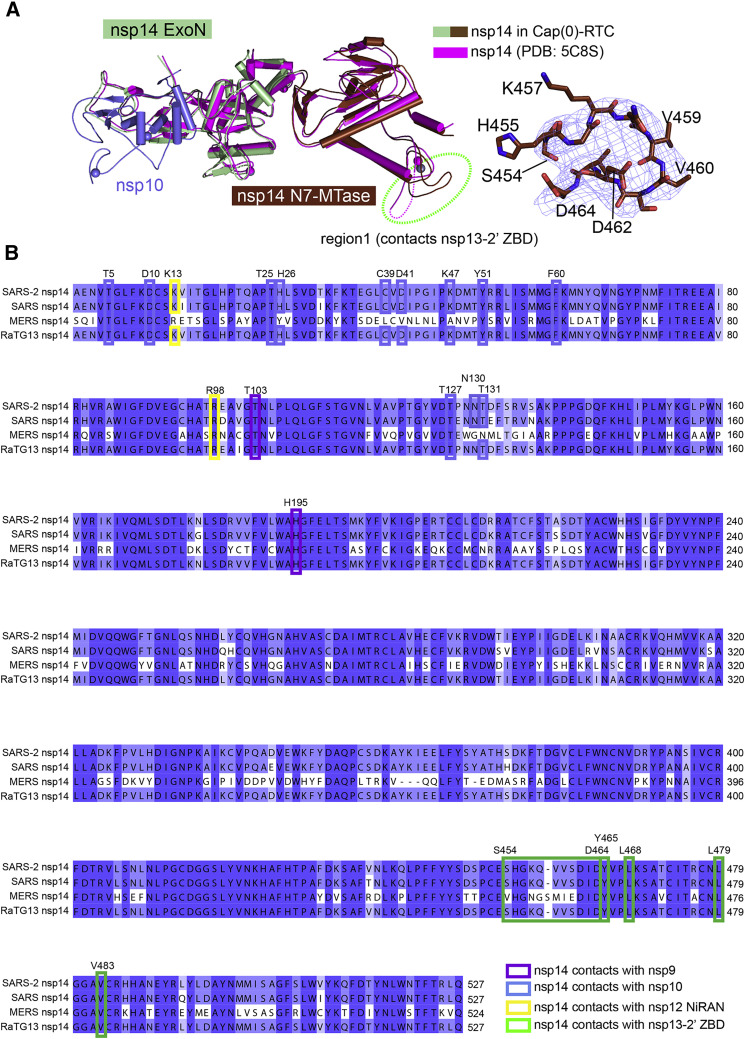
Structure of nsp10/nsp14 and sequence comparison, related to Figureu00a02 (A) The structures of nsp10/nsp14 complex in Cap(0)-RTC and in crystallo( Ma etu00a0al., 2015 ) (PDB code: 5C8S ) are aligned....
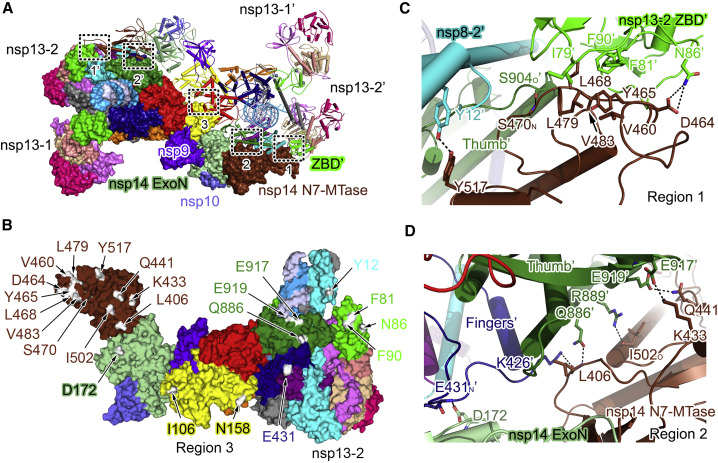
Figureu00a03
Inter-protomer interactions (A) One Cap(0)-RTC protomer is shown as a cartoon diagram and the another is shown as a molecular surface. The inter-protomer interacting regions are indicated by the dashe...
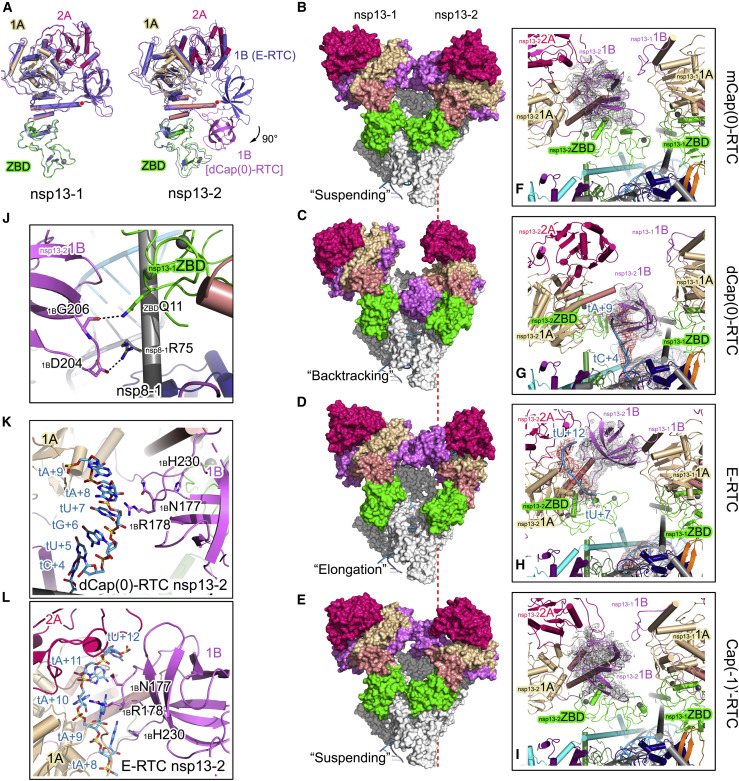
Figureu00a04
Conformational change of nsp13-2 1B (A) Comparison of nsp13 in E-RTC and dCap(0)-RTC. The polypeptides of nsp13-1 and nsp13-2 in E-RTC are colored light blue, whereas these in dCap(0)-RTC are shown as...
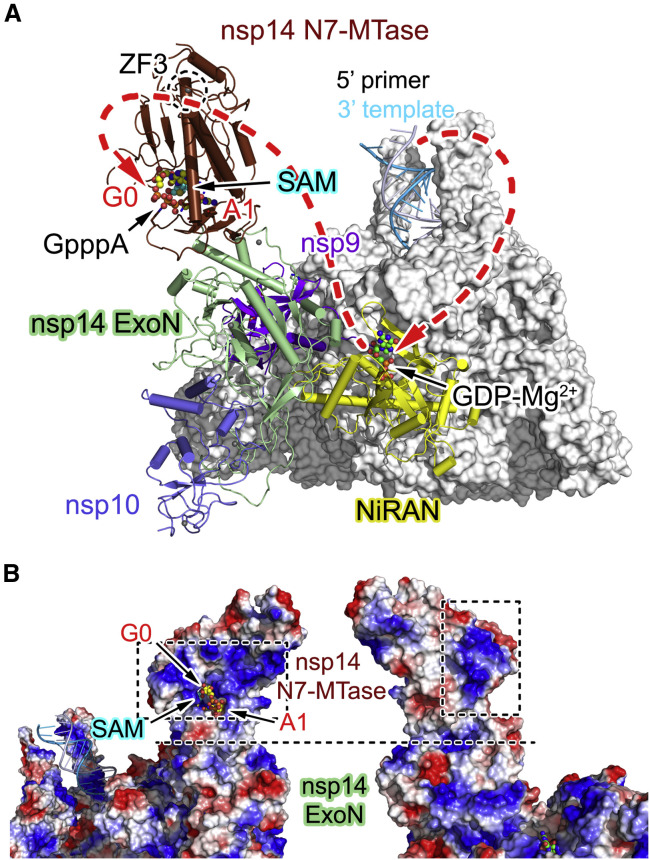
Figureu00a05
A potential transferring path for pre-mRNA in capping (A) An overall view of N7-CCC. N7-CCC is shown as colored cartoon and the EC is covered by white molecular surface. Nsp9, nsp10, nsp12 NiRAN, nsp1...
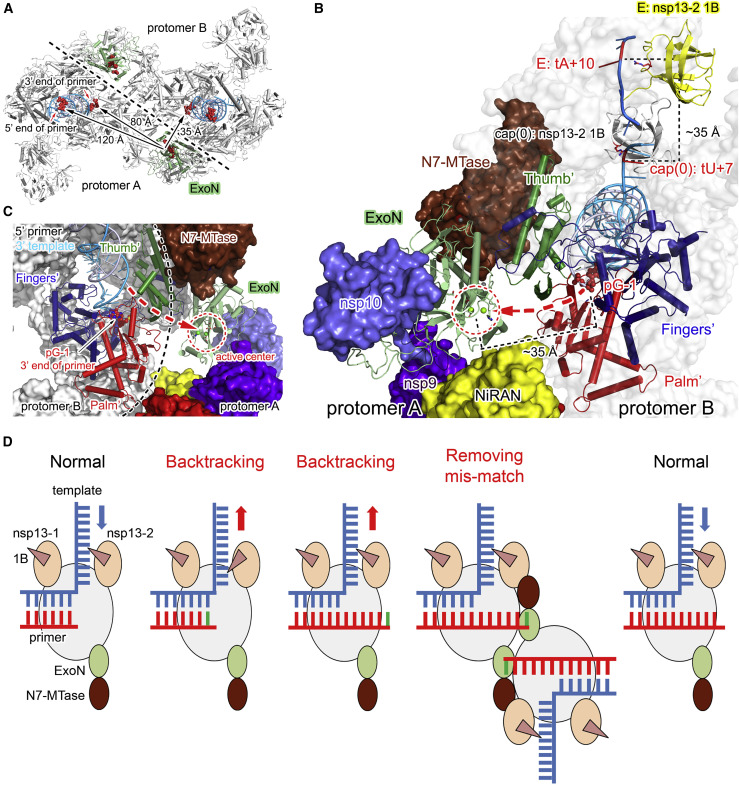
Figureu00a06
An in trans backtracking model for proofreading (A) Distance between the catalytic center of nsp14 ExoN in one Cap(0)-RTC protomer with the 5u2032 end of primer RNA in the same Cap(0)-RTC protomer and...
Figure images are served from the NIH/NLM PubMed Central Open Access Subset or Europe PMC; copyright remains with the publishers and authors.
💬 Discussion
0 commentsNo comments yet. Be the first to start a discussion!
Leave a Comment