Abstract
In bacterial defense and genome editing applications, the CRISPR-associated protein Cas9 searches millions of DNA base pairs to locate a 20-nucleotide, guide RNA-complementary target sequence that abuts a protospacer-adjacent motif (PAM). Target capture requires Cas9 to unwind DNA at candidate sequences using an unknown ATP-independent mechanism. Here we show that Cas9 sharply bends and undertwists DNA on PAM binding, thereby flipping DNA nucleotides out of the duplex and toward the guide RNA for sequence interrogation. Cryogenic-electron microscopy (cryo-EM) structures of Cas9-RNA-DNA complexes trapped at different states of the interrogation pathway, together with solution conformational probing, reveal that global protein rearrangement accompanies formation of an unstacked DNA hinge. Bend-induced base flipping explains how Cas9 'reads' snippets of DNA to locate target sites within a vast excess of nontarget DNA, a process crucial to both bacterial antiviral immunity and genome editing. This mechanism establishes a physical solution to the problem of complementarity-guided DNA search and shows how interrogation speed and local DNA geometry may influence genome editing efficiency.
🔬 Techniques
🔭 Microscopes
🧬 Organisms
💻 Software
🧪 Sample Preparation
🏭 Microscope Brands
🧪 Reagent Suppliers
📷 Detectors
💻 Software Details
💾 Data Repositories
🏛️ Research Organizations (ROR)
Affiliated research institutions:
📋 Methods
Protein expression and purification
Cas9 was expressed and purified as described previously 28 , with slight modifications. Briefly, protein was expressed from custom pET-based vectors in E. coli BL21 Star(DE3) cells. Cells were sonicated in lysis buffer (50 mM HEPES (pH 7.5), 500 mM NaCl, 1 mM TCEP, 0.5 mM PMSF, 10 tablets/L cOmplete EDTA-free protease inhibitor cocktail (Roche), 0.25 mg/mL chicken egg white lysozyme (Sigma-Aldrich)), and clarified lysate was loaded onto Ni-NTA resin, which was then washed (50 mM HEPES (pH 7.5), 500 mM NaCl, 1 mM TCEP, 5% glycerol, 20 mM imidazole) and eluted (50 mM HEPES (pH 7.5), 500 mM NaCl, 1 mM TCEP, 5% glycerol, 300 mM imidazole). Proteins were cleaved overnight with TEV protease at 4°C without dialysis. The digested protein solution was diluted with one volume of low-salt ion exchange buffer (50 mM HEPES (pH 7.5), 250 mM KCl, 1 mM TCEP, 10% glycerol). Digested protein was purified on a HiTrap Heparin HP affinity column (Cytiva), eluting with high-salt ion exchange buffer (50 mM HEPES (pH 7.5), 1 M KCl, 1 mM TCEP, 10% glycerol). Eluted protein was then purified by size exclusion in protein-purification size exclusion buffer (20 mM HEPES (pH 7.5), 150 mM KCl, 1 mM dithiothreitol (DTT), 10% glycerol) on a Superdex 200 Increase 10/300 GL column (Cytiva). Plasmid/protein sequences and Addgene IDs can be found in the Supplementary Information . Nucleic acid preparation All DNA oligonucleotides were synthesized by Integrated DNA Technologies except the cystamine-functionalized target strand, which was synthesized by TriLink Biotechnologies (with HPLC purification). DNA oligonucleotides that were not HPLC-purified by the manufacturer were PAGE-purified in house (unless a downstream preparative step involved another PAGE purification), and all DNA oligonucleotides were stored in water. Duplex DNA substrates were annealed by heating to 95°C and cooling to 25°C over the course of 40 min on a thermocycler. Guide RNAs were transcribed and purified as described previously 28 , except no ribozyme was included in the transcript. Briefly, in vitro transcription reactions included PCR-assembled DNA template, 40 mM Tris-Cl (pH 7.9 at 25°C), 25 mM MgCl 2 , 10 mM DTT, 0.01% (v/v) Triton X-100, 2 mM spermidine, 5 mM of each NTP, and 100 μg/mL T7 RNA polymerase. Transcription was allowed to proceed for 2.5 hr at 37°C, after which RNA was purified by urea-PAGE, ethanol-precipitated, and resuspended in RNA storage buffer (0.1 mM EDTA, 2 mM sodium citrate, pH 6.4). All sgRNA molecules were annealed (80°C for 2 min, then moved directly to ice) in RNA storage buffer prior to use. For both DNA and RNA, A 260 was measured on a NanoDrop (Thermo Scientific), and concentration was estimated according to extinction coefficients reported previously 49 . Oligonucleotide sequences can be found in the Supplementary Information .
Show full methods section
Protein expression and purification
Cas9 was expressed and purified as described previously 28 , with slight modifications. Briefly, protein was expressed from custom pET-based vectors in E. coli BL21 Star(DE3) cells. Cells were sonicated in lysis buffer (50 mM HEPES (pH 7.5), 500 mM NaCl, 1 mM TCEP, 0.5 mM PMSF, 10 tablets/L cOmplete EDTA-free protease inhibitor cocktail (Roche), 0.25 mg/mL chicken egg white lysozyme (Sigma-Aldrich)), and clarified lysate was loaded onto Ni-NTA resin, which was then washed (50 mM HEPES (pH 7.5), 500 mM NaCl, 1 mM TCEP, 5% glycerol, 20 mM imidazole) and eluted (50 mM HEPES (pH 7.5), 500 mM NaCl, 1 mM TCEP, 5% glycerol, 300 mM imidazole). Proteins were cleaved overnight with TEV protease at 4°C without dialysis. The digested protein solution was diluted with one volume of low-salt ion exchange buffer (50 mM HEPES (pH 7.5), 250 mM KCl, 1 mM TCEP, 10% glycerol). Digested protein was purified on a HiTrap Heparin HP affinity column (Cytiva), eluting with high-salt ion exchange buffer (50 mM HEPES (pH 7.5), 1 M KCl, 1 mM TCEP, 10% glycerol). Eluted protein was then purified by size exclusion in protein-purification size exclusion buffer (20 mM HEPES (pH 7.5), 150 mM KCl, 1 mM dithiothreitol (DTT), 10% glycerol) on a Superdex 200 Increase 10/300 GL column (Cytiva). Plasmid/protein sequences and Addgene IDs can be found in the Supplementary Information . Nucleic acid preparation All DNA oligonucleotides were synthesized by Integrated DNA Technologies except the cystamine-functionalized target strand, which was synthesized by TriLink Biotechnologies (with HPLC purification). DNA oligonucleotides that were not HPLC-purified by the manufacturer were PAGE-purified in house (unless a downstream preparative step involved another PAGE purification), and all DNA oligonucleotides were stored in water. Duplex DNA substrates were annealed by heating to 95°C and cooling to 25°C over the course of 40 min on a thermocycler. Guide RNAs were transcribed and purified as described previously 28 , except no ribozyme was included in the transcript. Briefly, in vitro transcription reactions included PCR-assembled DNA template, 40 mM Tris-Cl (pH 7.9 at 25°C), 25 mM MgCl 2 , 10 mM DTT, 0.01% (v/v) Triton X-100, 2 mM spermidine, 5 mM of each NTP, and 100 μg/mL T7 RNA polymerase. Transcription was allowed to proceed for 2.5 hr at 37°C, after which RNA was purified by urea-PAGE, ethanol-precipitated, and resuspended in RNA storage buffer (0.1 mM EDTA, 2 mM sodium citrate, pH 6.4). All sgRNA molecules were annealed (80°C for 2 min, then moved directly to ice) in RNA storage buffer prior to use. For both DNA and RNA, A 260 was measured on a NanoDrop (Thermo Scientific), and concentration was estimated according to extinction coefficients reported previously 49 . Oligonucleotide sequences can be found in the Supplementary Information .
Cryo-EM construct preparation
DNA duplexes were pre-annealed in water at 10X concentration (60 μM target strand, 75 μM non-target strand). Cross-linking reactions were assembled with 300 μL water, 100 μL 5X disulfide reaction buffer (250 mM Tris-Cl, pH 7.4 at 25°C, 750 mM NaCl, 25 mM MgCl 2 , 25% glycerol, 500 μM DTT), 50 μL 10X DNA duplex, 25 μL 100 μM sgRNA, and 25 μL 80 μM Cas9. Cross-linking was allowed to proceed at 25°C for 24 hours (0 RNA:DNA matches) or 8 hours (3 RNA:DNA matches). Sample was then purified by size exclusion (Superdex 200 Increase 10/300 GL, Cytiva) in cryo-EM buffer (20 mM Tris-Cl, pH 7.5 at 25°C, 200 mM KCl, 100 μM DTT, 5 mM MgCl 2 , 0.25% glycerol). Peak fractions were pooled, concentrated to an estimated 6 μM, snap-frozen in 10-μL aliquots in liquid nitrogen, and stored at −80°C until grid preparation. For the Cas9:sgRNA structural construct, which lacked a cross-link, the reaction was assembled with 350 μL water, 100 μL 5X disulfide reaction buffer, 0.45 μL 1 M DTT, 25 μL 100 μM sgRNA, and 25 μL 80 μM Cas9. The complex was allowed to form at 25°C for 30 minutes. The Cas9:sgRNA sample was then size-exclusion-purified and processed as described for the DNA-containing constructs. For Cas9:sgRNA, cryo-EM buffer contained 1 mM DTT instead of 100 μM DTT.
SDS-PAGE analysis
For non-reducing SDS-PAGE, thiol exchange was first quenched by the addition of 20 mM S-methyl methanethiosulfonate (S-MMTS). Then, 0.25 volumes of 5X non-reducing SDS-PAGE loading solution (0.0625% w/v bromophenol blue, 75 mM EDTA, 30% glycerol, 10% SDS, 250 mM Tris-Cl, pH 6.8) were added, and the sample was heated to 90°C for 5 minutes before loading of 3 pmol onto a 4–15% Mini-PROTEAN TGX Stain-Free Precast Gel (Bio-Rad), alongside PageRuler Prestained Protein Ladder (Thermo Scientific). Gels were imaged using the Stain-Free imaging protocol (5-min activation, 3-s exposure) of Bio-Rad Image Lab 5.2.1 on a Bio-Rad ChemiDoc. For reducing SDS-PAGE, no S-MMTS was added, and 5% β-mercaptoethanol (βME) was added along with the non-reducing SDS-PAGE loading solution. For radioactive SDS-PAGE analysis, a 4–20% Mini-PROTEAN TGX Precast Gel (Bio-Rad) was pre-run for 20 min at 200 V (to allow free ATP to migrate ahead of free DNA), run with radioactive sample for 15 min at 200 V, dried (80°C, 3 hours) on a gel dryer (Bio-Rad), and exposed to a phosphor screen, subsequently imaged on an Amersham Typhoon using the Amersham Typhoon Control Software 2.0.0.6 (Cytiva). Nucleic acid radiolabeling Standard 5′ radiolabeling was performed with T4 polynucleotide kinase (New England Biolabs) at 0.2 U/μL (manufacturer’s units), 1X T4 PNK buffer (New England Biolabs), 400 nM DNA oligonucleotide, and 200 nM [γ− 32 P]-ATP (PerkinElmer) for 30 min at 37°C, followed by a 20-min heat-killing incubation at 65°C. Radiolabeled oligos were then buffer exchanged into water using a Microspin G-25 spin column (GE Healthcare). For 5′ radiolabeling of sgRNAs, the 5′ triphosphate was first removed by treatment with Quick CIP (New England BioLabs, manufacturer’s instructions). The reaction was then supplemented with 5 mM DTT and the same concentrations of T4 polynucleotide kinase (New England BioLabs) and [γ− 32 P]-ATP (PerkinElmer) used for DNA radiolabeling, and the remainder of the protocol was completed as for DNA.
Radiolabeled target-strand cleavage rate measurements
DNA duplexes at 10X concentration (20 nM radiolabeled target strand, 75 μM unlabeled non-target strand) were annealed in water with 60 μM cystamine dihydrochloride (pH 7). A 75-μL reaction was assembled from 15 μL 5X Mg-free disulfide reaction buffer (250 mM Tris-Cl, pH 7.4 at 25°C, 750 mM NaCl, 5 mM EDTA, 25% glycerol, 500 μM DTT), 7.5 μL 600 μM cystamine dihydrochloride (pH 7), 37.5 μL water, 3.75 μL 80 μM Cas9, 3.75 μL 100 μM sgRNA, 7.5 μL 10X DNA duplex. The reaction was incubated at 25°C for 2 hours, at which point the cross-linked fraction had fully equilibrated. To non-reducing or reducing reactions, 5 μL of 320 mM S-MMTS or 80 mM DTT (respectively) in 1X Mg-free disulfide reaction buffer was added. Samples were incubated at 25°C for an additional 5 min, then cooled to 16°C and allowed to equilibrate for 15 min. One aliquot was quenched into 0.25 volumes 5X non-reducing SDS-PAGE solution and subject to SDS-PAGE analysis to assess the extent of cross-linking (for the reduced sample, no βME was added, as the DTT had already effectively reduced the sample). Another aliquot was quenched for reducing urea-PAGE analysis as timepoint 0. DNA cleavage was initiated by combining the remaining reaction volume with 0.11 volumes 60 mM MgCl 2 . Aliquots were taken at the indicated timepoints for reducing urea-PAGE analysis.
Urea-PAGE analysis
To each sample was added 1 volume of 2X urea-PAGE loading solution (92% formamide, 30 mM EDTA, 0.025% bromophenol blue, 400 μg/mL heparin). For reducing urea-PAGE analysis, 5% βME was subsequently added. Samples were heated to 90°C for 5 minutes, then resolved on a denaturing polyacrylamide gel (10% or 15% acrylamide:bis-acrylamide 29:1, 7 M urea, 0.5X TBE). For radioactive samples, gels were dried (80°C, 3 hr) on a gel dryer (Bio-Rad), exposed to a phosphor screen, and imaged on an Amersham Typhoon (Cytiva). For samples containing fluorophore-conjugated DNA, gels were directly imaged on the Typhoon without further treatment. For unlabeled samples, gels were stained with 1X SYBR Gold (Invitrogen) in 0.5X TBE prior to Typhoon imaging.
Fluorescence and autoradiograph data analysis
Band volumes in fluorescence images and autoradiographs were quantified in Image Lab 6.1 (Bio-Rad). For fluorescence images recorded by the ChemiDoc, Image Lab’s native .scn files were used for quantification. For images recorded by the Typhoon, the Typhoon software’s native .gel files (square root encoded) were used for quantification. Data were fit by the least-squares method in Prism 7 (GraphPad Software).
Cryo-EM grid preparation and data collection
Cryo-EM samples were thawed and diluted to 3 μM (Cas9:sgRNA:DNA) or 1.5 μM (Cas9:sgRNA) in cryo-EM buffer. An UltrAuFoil grid (1.2/1.3-μm, 300 mesh, Electron Microscopy Sciences, catalog no. Q350AR13A) was glow-discharged in a PELCO easiGlow for 15 s at 25 mA, then loaded into an FEI Vitrobot Mark IV equilibrated to 8°C with 100% humidity. From the sample, kept on ice up until use, 3.6 μL was applied to the grid, which was immediately blotted (Cas9:sgRNA:DNA{0 RNA:DNA matches} and Cas9:sgRNA: blot time 4.5 s, blot force 8; Cas9:sgRNA:DNA{3 RNA:DNA matches}: blot time 3 s, blot force 6) and plunged into liquid-nitrogen-cooled ethane. Micrographs for Cas9:sgRNA were collected on a Talos Arctica TEM operated at 200 kV and x36,000 magnification (1.115 Å/pixel), at −0.8 to −2 μm defocus, using the super-resolution camera setting (0.5575 Å/pixel) on a Gatan K3 Direct Electron Detector. Micrographs for Cas9:sgRNA:DNA complexes were collected on a Titan Krios G3i TEM operated at 300 kV with energy filter, x81,000 nominal magnification (1.05 Å/pixel), −0.8 μm to −2 μm defocus, using the super-resolution camera setting (0.525 Å/pixel) in CDS mode on a Gatan K3 Direct Electron Detector. All images were collected using beam shift in SerialEM v.3.8.7 software.
Cryo-EM data processing and model building
Details of cryo-EM data processing and model building can be found in the Supplementary Information .
Permanganate reactivity measurements
DNA duplexes were annealed at 50X concentration (100 nM radiolabeled target strand, 200 nM unlabeled non-target strand) in 1X annealing buffer (10 mM Tris-Cl, pH 7.9 at 25°C, 50 mM KCl, 1 mM EDTA), then diluted to 10X concentration in water. A Cas9 titration at 5X was prepared by diluting an 80 μM Cas9 stock solution with protein-purification size exclusion buffer. An sgRNA titration at 5X was prepared by diluting a 100 μM sgRNA stock solution with RNA storage buffer. For all reactions, the sgRNA concentration was 1.25 times the Cas9 concentration, and the reported ribonucleoprotein concentration is that of Cas9. Reactions were assembled with 11 μL 5X permanganate reaction buffer (100 mM Tris-Cl, pH 7.9 at 25°C, 120 mM KCl, 25 mM MgCl 2 , 5 mM TCEP, 500 μg/mL UltraPure BSA, 0.05% Tween-20), 11 μL water, 11 μL 5X Cas9, 11 μL 5X sgRNA, 5.5 μL 10X DNA. A stock solution of KMnO 4 was prepared fresh in water, and its concentration was corrected to 100 mM (10X reaction concentration) based on 8 averaged NanoDrop readings (ε 526 = 2.4 × 10 3 M −1 cm −1 ). Reaction tubes and KMnO 4 (or water, for reactions lacking permanganate) were equilibrated to 30°C for 15 minutes. To initiate the reaction, 22.5 μL of Cas9:sgRNA:DNA was added to 2.5 μL 100 mM KMnO 4 or water. After 2 min, 25 μL 2X stop solution (2 M βME, 30 mM EDTA) was added to stop the reaction, and 50 μL of water was added to each quenched reaction. Samples were extracted once with 100 μL 25:24:1 phenol:chloroform:isoamyl alcohol (pH 8) in 5PRIME Phase Lock Heavy tubes (Quantabio). The aqueous phase was isolated and combined with 10 μL 3 M sodium acetate (pH 5.2), 1 μL GlycoBlue coprecipitant (Invitrogen), and 300 μL ethanol, and left at −20°C for >2 hr. DNA was precipitated by centrifugation, and supernatant was decanted. A second wash was performed with 500 μL 70% ethanol. Pellets were resuspended in 70 μL 10% piperidine and incubated at 90°C for 30 min. Solvent was evaporated in a SpeedVac (ThermoFisher Scientific). Approximate yield was determined by measuring radioactivity of the pellet-containing tube in a benchtop radiation counter (Bioscan QC-4000), and pellets were resuspended in an appropriate volume of loading solution (50% water, 50% formamide, 0.025% w/v bromophenol blue) to normalize signal across samples prior to resolution by denaturing PAGE and autoradiography. Because piperidine treatment leads to low levels of cleavage at every nucleotide, the exhaustive single-nucleotide ladder could be used to assign band identities, also confirmed by the dark/light pattern (piperidine-catalyzed cleavage at thymines is less efficient than at other nucleotides in the absence of permanganate modification and more efficient in the presence of permanganate modification). Data analysis was performed as follows: let v i denote the volume of band i in a lane with n total bands (band 1 is the shortest cleavage fragment, band n is the topmost band corresponding to the starting/uncleaved DNA oligonucleotide). The probability of cleavage at thymine i is defined as: p c l e a v e , i = v i ∑ j = i n v j . Oxidation probability of thymine i is defined as: p ox,i = p cleave,i,+ pm − p cleave,i,−pm , where + pm indicates the experiment that contained 10 mM KMnO 4 and − pm indicates the no-permanganate experiment. An extensive description of this type of analysis can be found in ref. 28 .
Preparation of DNA cyclization substrates
Each variant DNA cyclization substrate precursor was assembled by PCR from two amplification primers (one of which contained a fluorescein-dT) and two assembly primers. Each reaction was 400 μL total (split into 4 × 100-μL aliquots) and contained 1X Q5 reaction buffer (New England BioLabs), 200 μM dNTPs, 200 nM forward amplification primer, 200 nM reverse amplification primer, 1 nM forward assembly primer, 1 nM reverse assembly primer, 0.02 U/μL Q5 polymerase. Thermocycle parameters were as follows: 98°C, 30 s; {98°C, 10 s; 55°C, 20 s; 72°C, 15 s}; {98°C, 10 s; 62°C, 20 s; 72°C, 15 s}; {98°C, 10 s; 72°C, 35 s}x25; 72°C, 2 min; 10°C, ∞. PCR products were phenol-chloroform-extracted, ethanol-precipitated, and resuspended in 80 μL water. To this was added 15 μL 10X CutSmart buffer, 47.5 μL water, and 7.5 μL ClaI restriction enzyme (10,000 units/mL, New England BioLabs), and digestion was allowed to proceed overnight at 37°C. Samples were then combined with 0.25 volumes 5X native quench solution (25% glycerol, 250 μg/mL heparin, 125 mM EDTA, 1.2 mg/mL proteinase K, 0.0625% w/v bromophenol blue), incubated at 55°C for 15 minutes, and resolved on a preparative native PAGE gel (8% acrylamide:bis-acrylamide 37.5:1, 0.5X TBE) at 4°C. Fluorescent bands, made visible on a blue LED transilluminator, were cut out, and DNA was extracted, ethanol-precipitated, and resuspended in water.
Cyclization efficiency measurements
Each cyclization reaction contained the following components: 1 μL 10X T4 DNA ligase reaction buffer (New England BioLabs), 2 μL water, 1 μL 10X ligation buffer additives (400 μg/mL UltraPure BSA, 100 mM KCl, 0.1% NP-40), 2 μL 80 μM Cas9 (or protein-purification size exclusion buffer), 2 μL 100 μM sgRNA (or RNA storage buffer), 1 μL 25 nM cyclization substrate, 1 μL T4 DNA ligase (400,000 units/mL, New England BioLabs) (or ligase storage buffer). All reaction components were incubated together at 20°C for 15 minutes prior to reaction initiation except for the ligase, which was incubated separately. Reactions were initiated by combining the ligase with the remainder of the components, allowed to proceed at 20°C for 30 minutes, then quenched with 2.5 μL 5X native quench solution. Samples were then incubated at 55°C for 15 minutes, resolved on an analytical native PAGE gel (8% acrylamide:bis-acrylamide 37.5:1, 0.5X TBE) at 4°C, and imaged for fluorescein on an Amersham Typhoon (Cytiva). Monomolecular cyclization efficiency (MCE) for a given lane is defined as (band volume of circular monomers)/(sum of all band volumes). Bimolecular ligation efficiency (BLE) is defined as (sum of band volumes of all linear/circular n-mers, for n≥2)/(sum of all band volumes). The non-specific degradation products indicated in Extended Data Fig. 6a were not included in the analysis.
Supplementary Material Supplementary Information Video 1 Video 2 Video 3 Video 4
📊 Figures
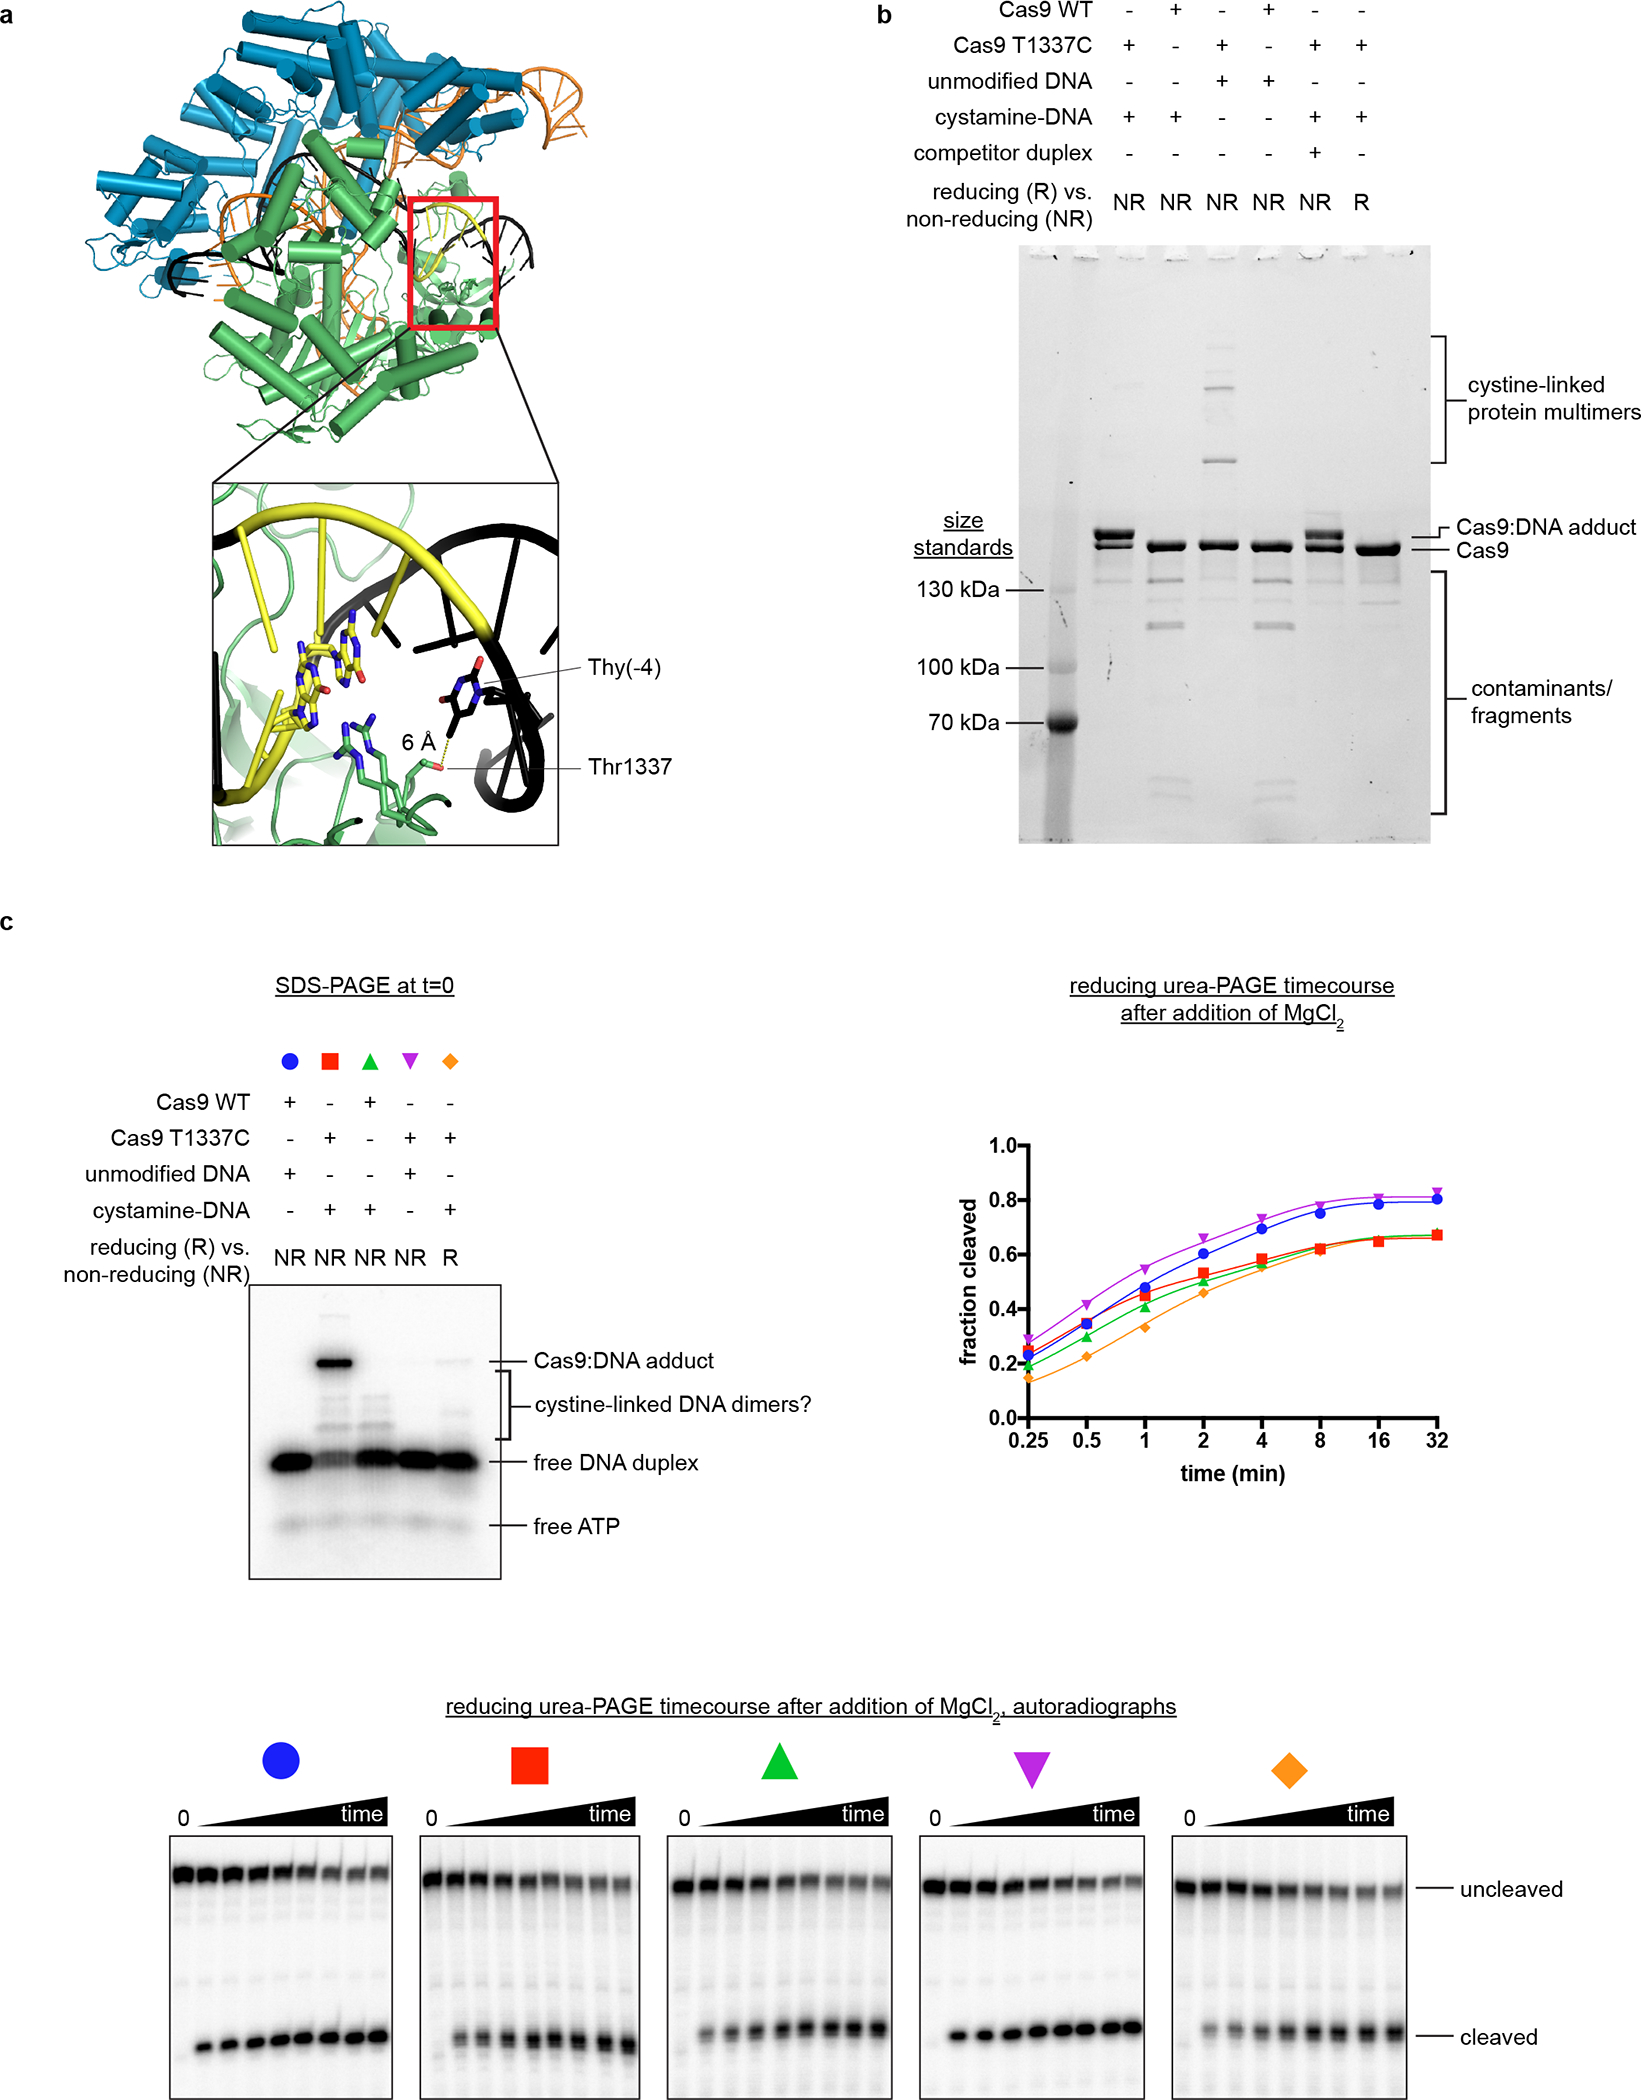
Extended Data Fig. 1
Characterization of the Cas9:DNA cross-link.
a , Crystal structure of Cas9:sgRNA:DNA with 20-bp RNA:DNA hybrid formed (PDB 4UN3). In the inset, Arg1333 and Arg1335 recognize the two guanines of the PAM. Green, NUC lobe; blue, REC lobe; orange, g...
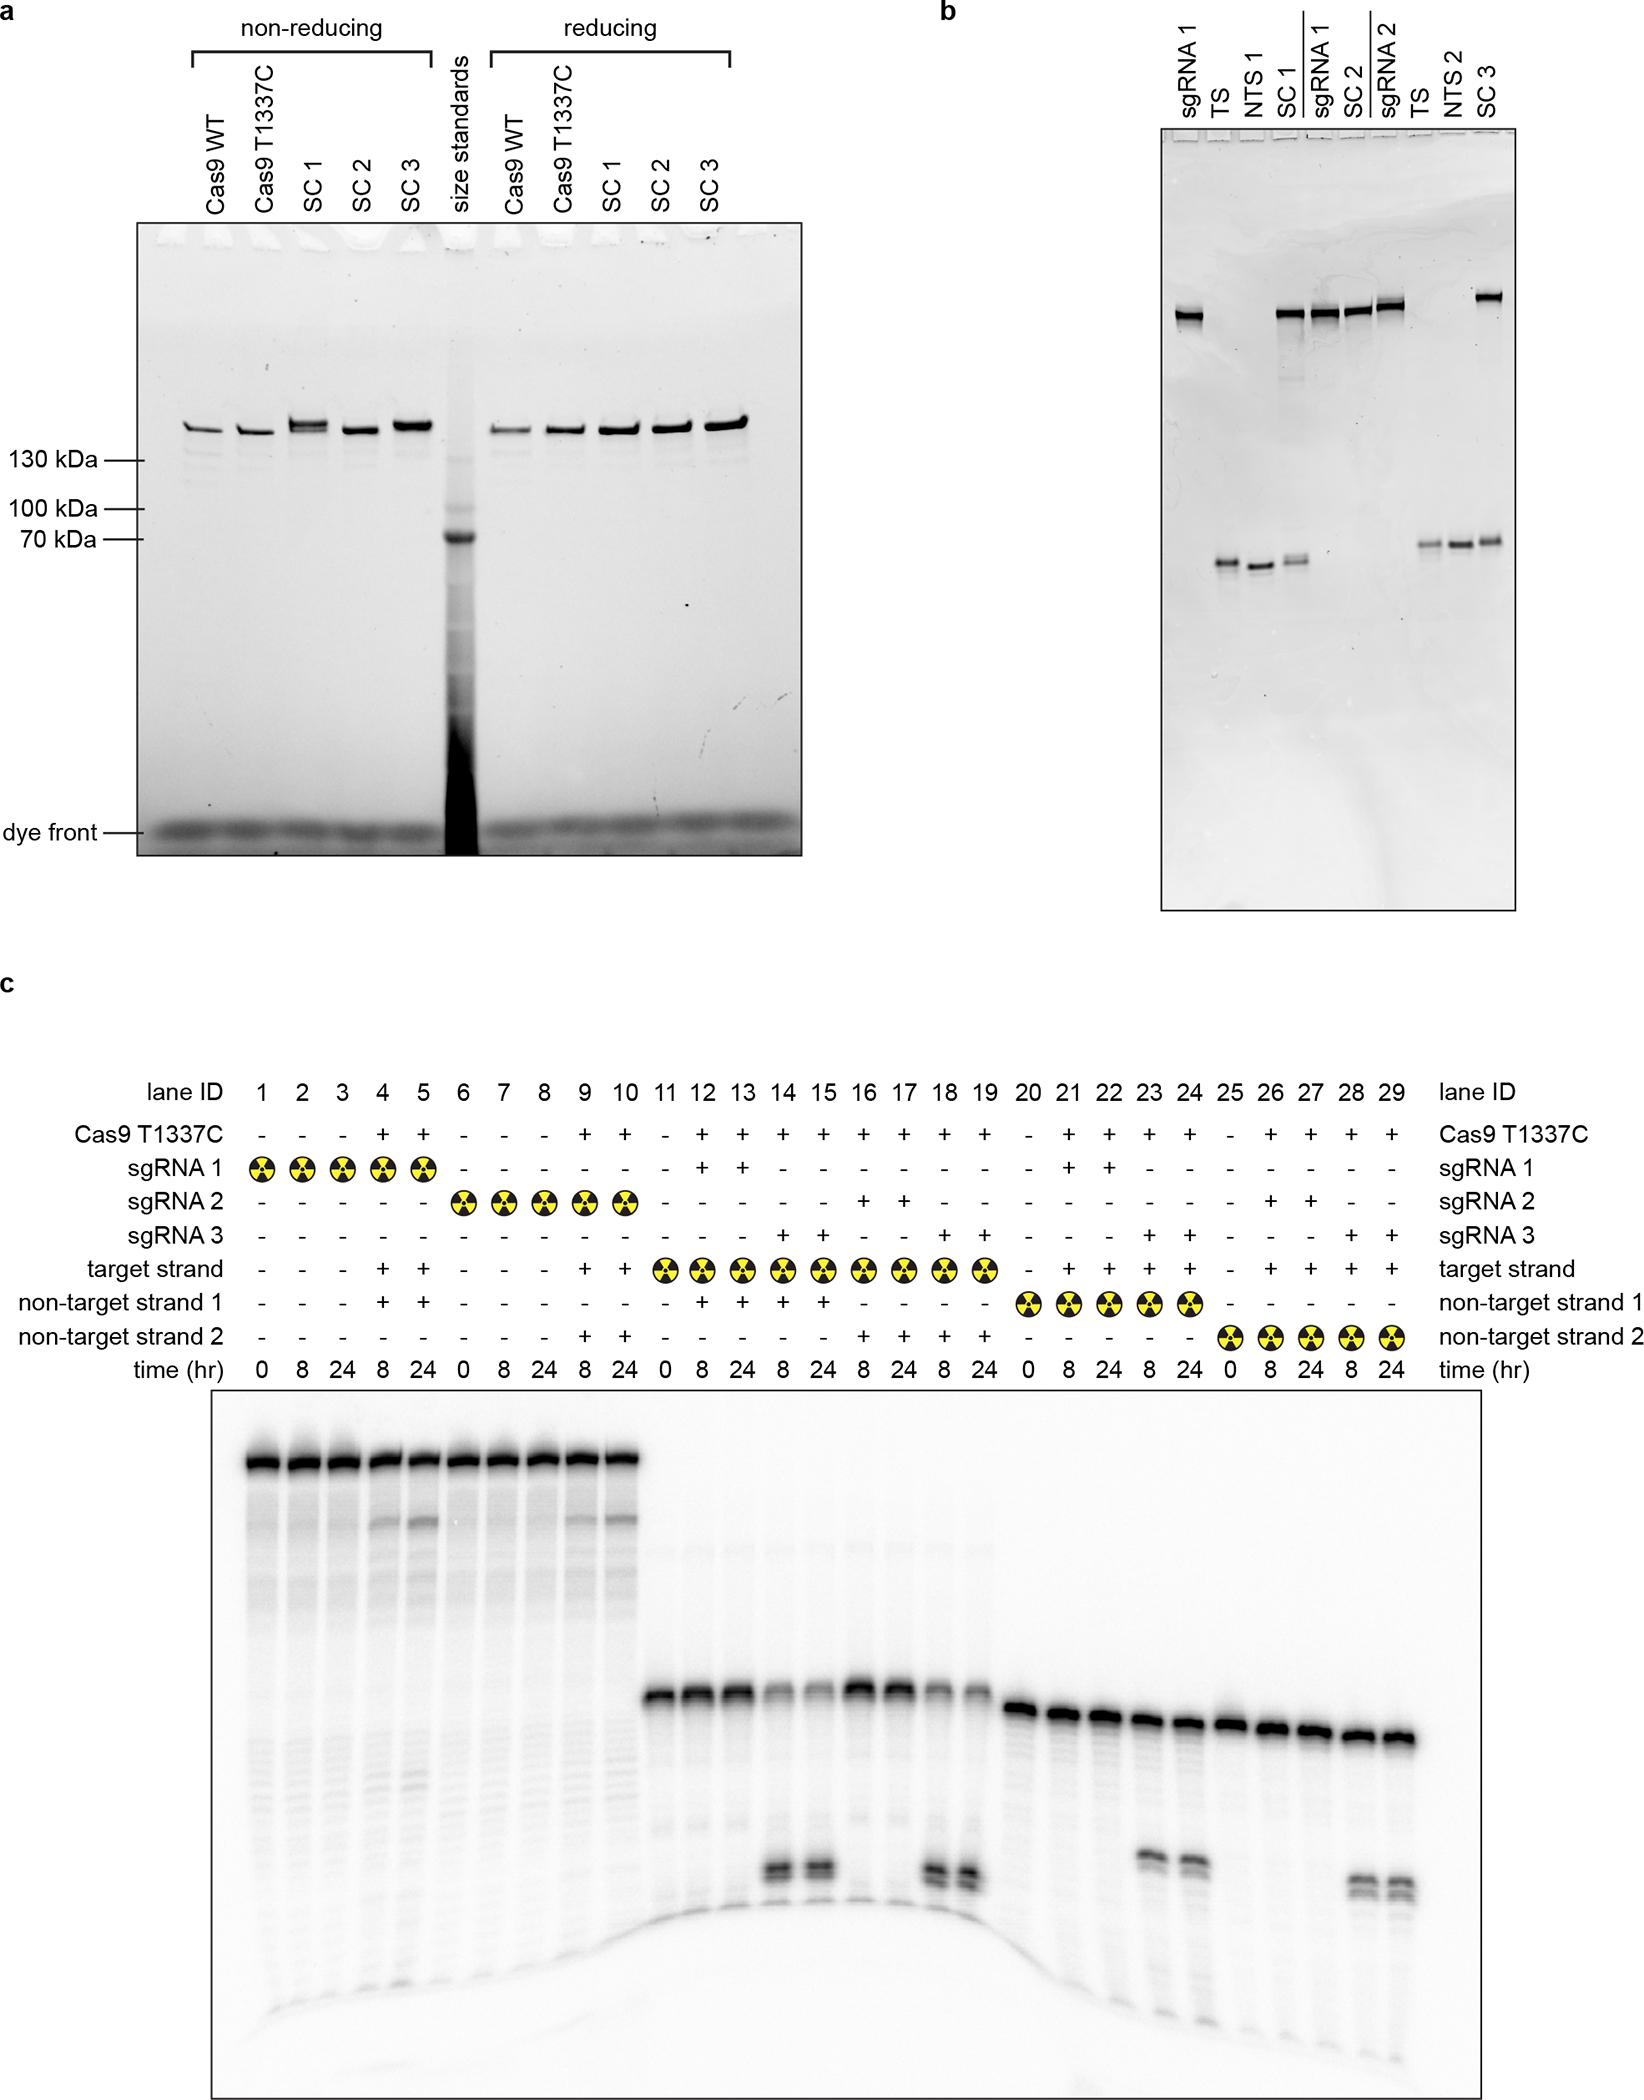
Extended Data Fig. 2
Cryo-EM sample quality.
a , SDS-PAGE (Stain-Free) analysis of purified proteins and cryo-EM samples. SC, structural construct; SC 1, Cas9:sgRNA:DNA with 0 RNA:DNA matches; SC 2, Cas9:sgRNA; SC 3, Cas9:sgRNA:DNA with 3 RNA:DN...
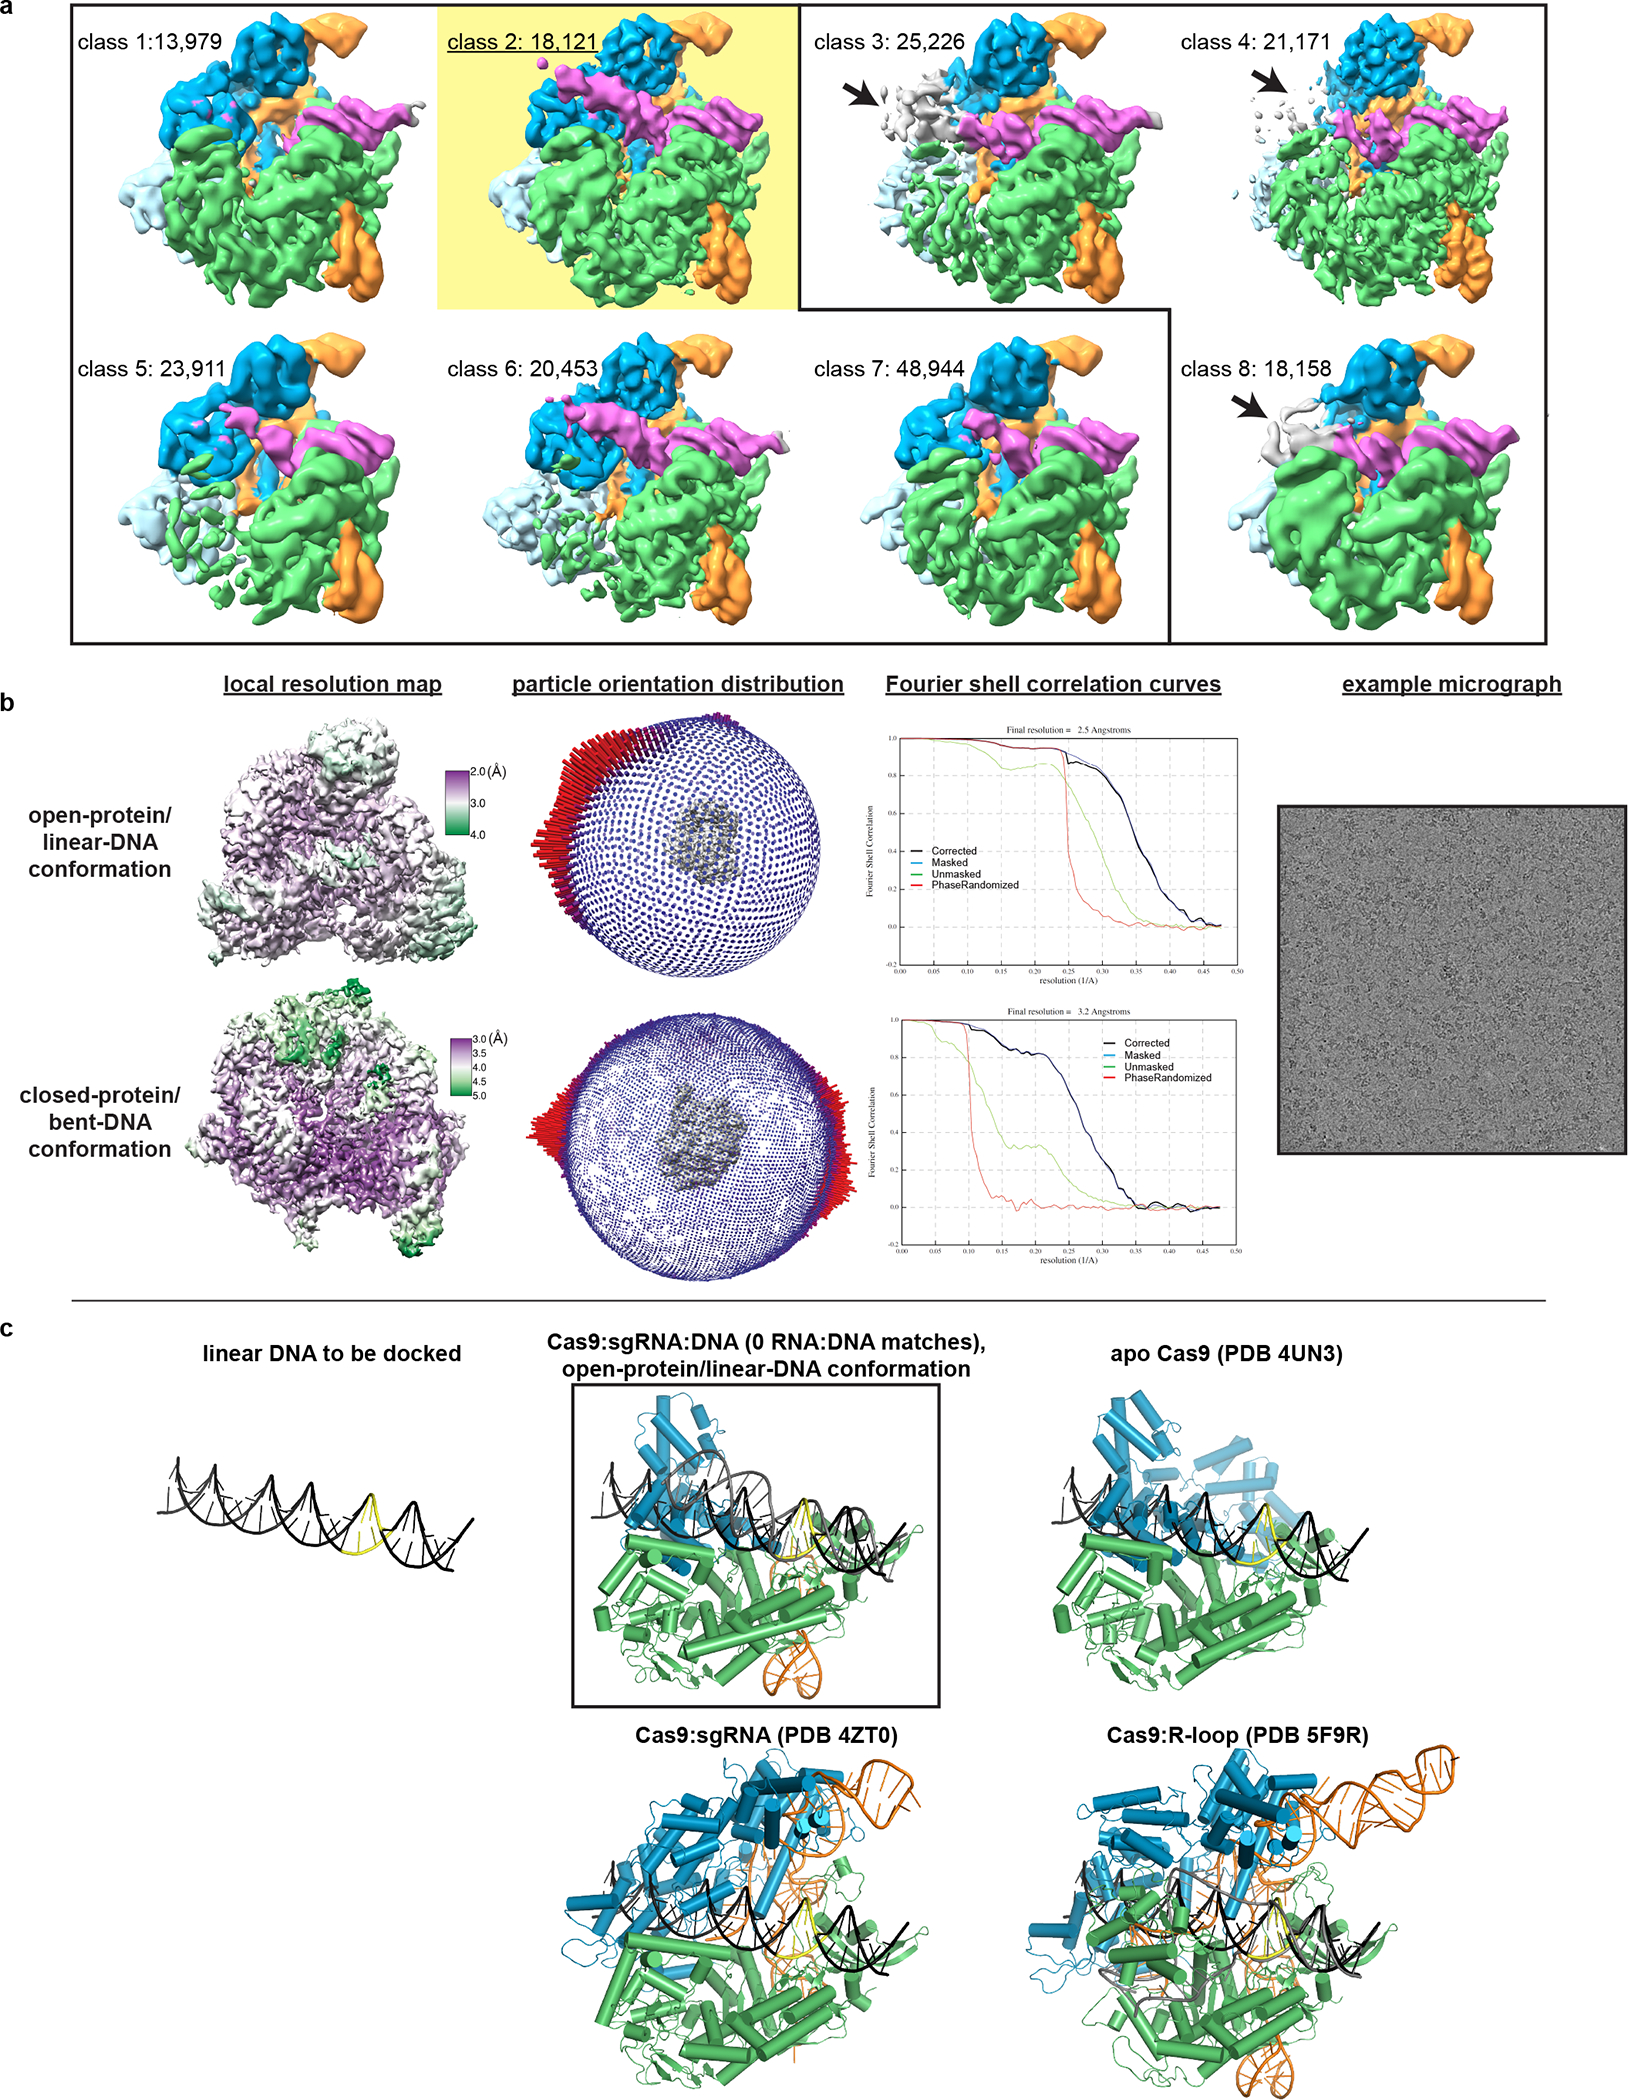
Extended Data Fig. 3
Cryo-EM analysis of Cas9:sgRNA:DNA with 0 RNA:DNA matches.
a , Classes from RELION 3D classification of closed-protein particles (threshold 6u03c3). The number of particles in each class is indicated next to the class number. In classes 1/2/5/6/7 the DNA is b...
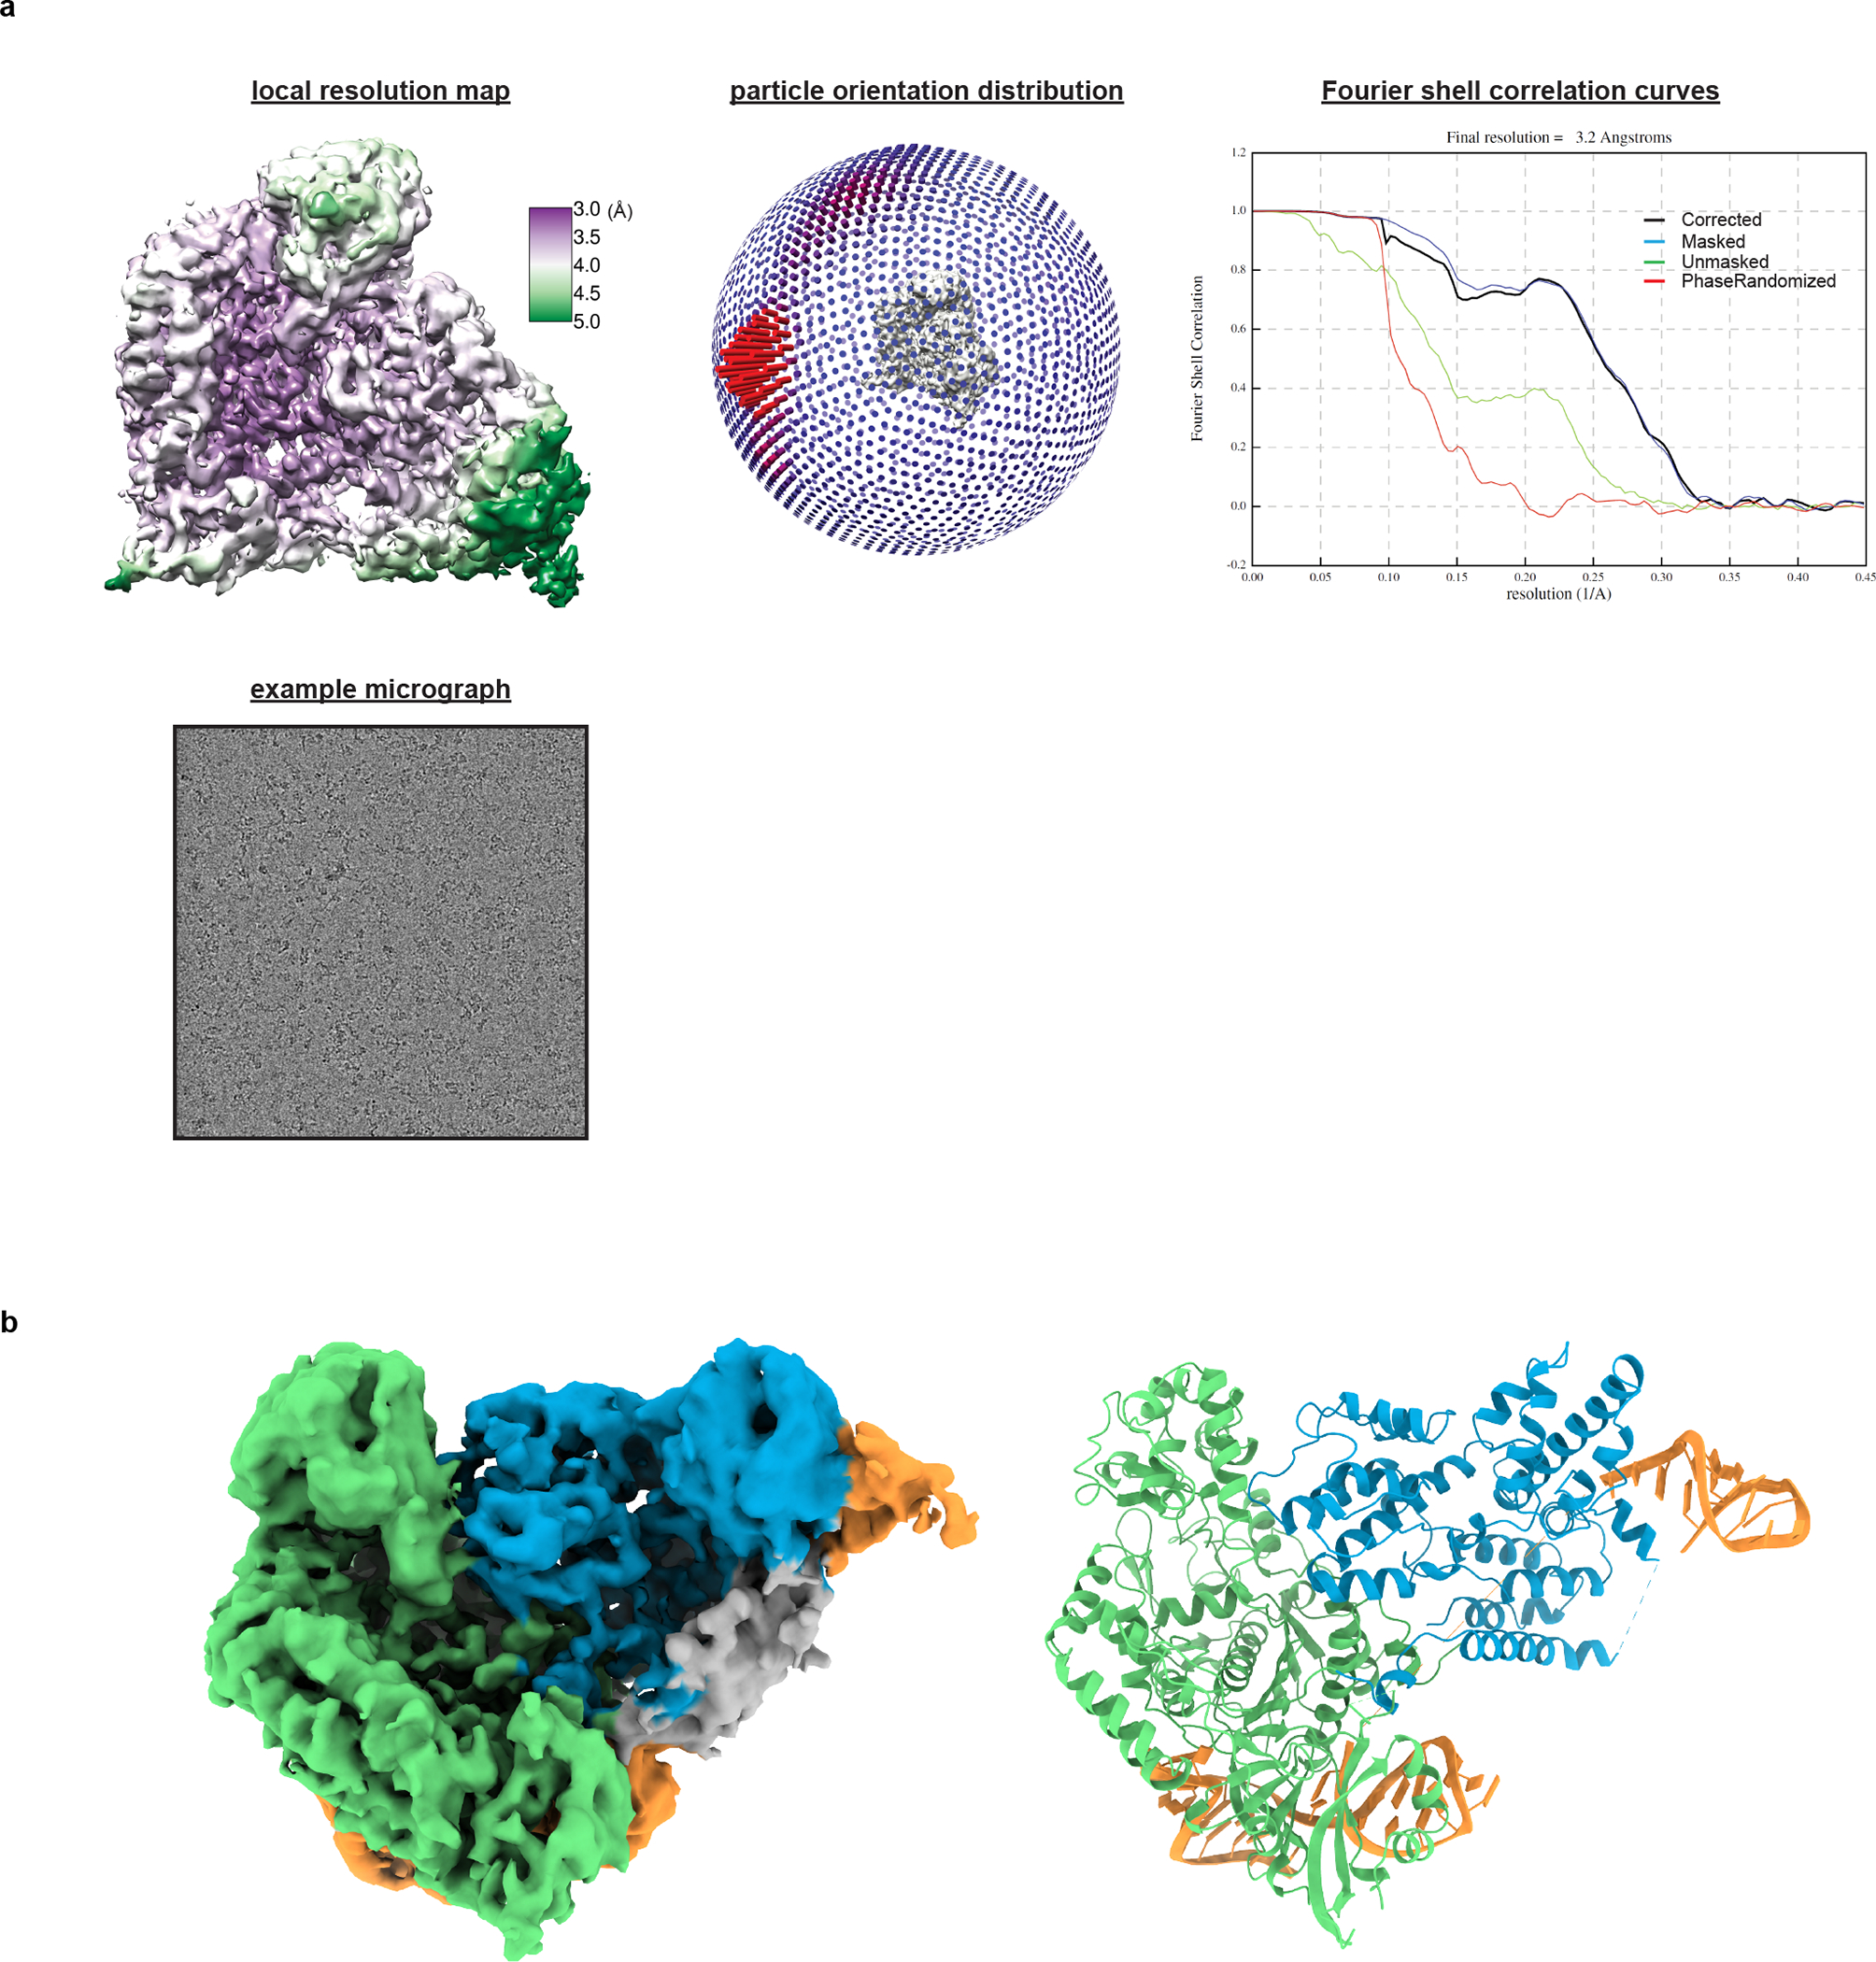
Extended Data Fig. 4
Cryo-EM analysis of Cas9:sgRNA.
a , Details of cryo-EM analysis. b , Unsharpened cryo-EM map (threshold 5u03c3) and model of Cas9:sgRNA in open-protein conformation. Green, NUC lobe; blue, REC lobe; orange, guide RNA; gray, unattrib...
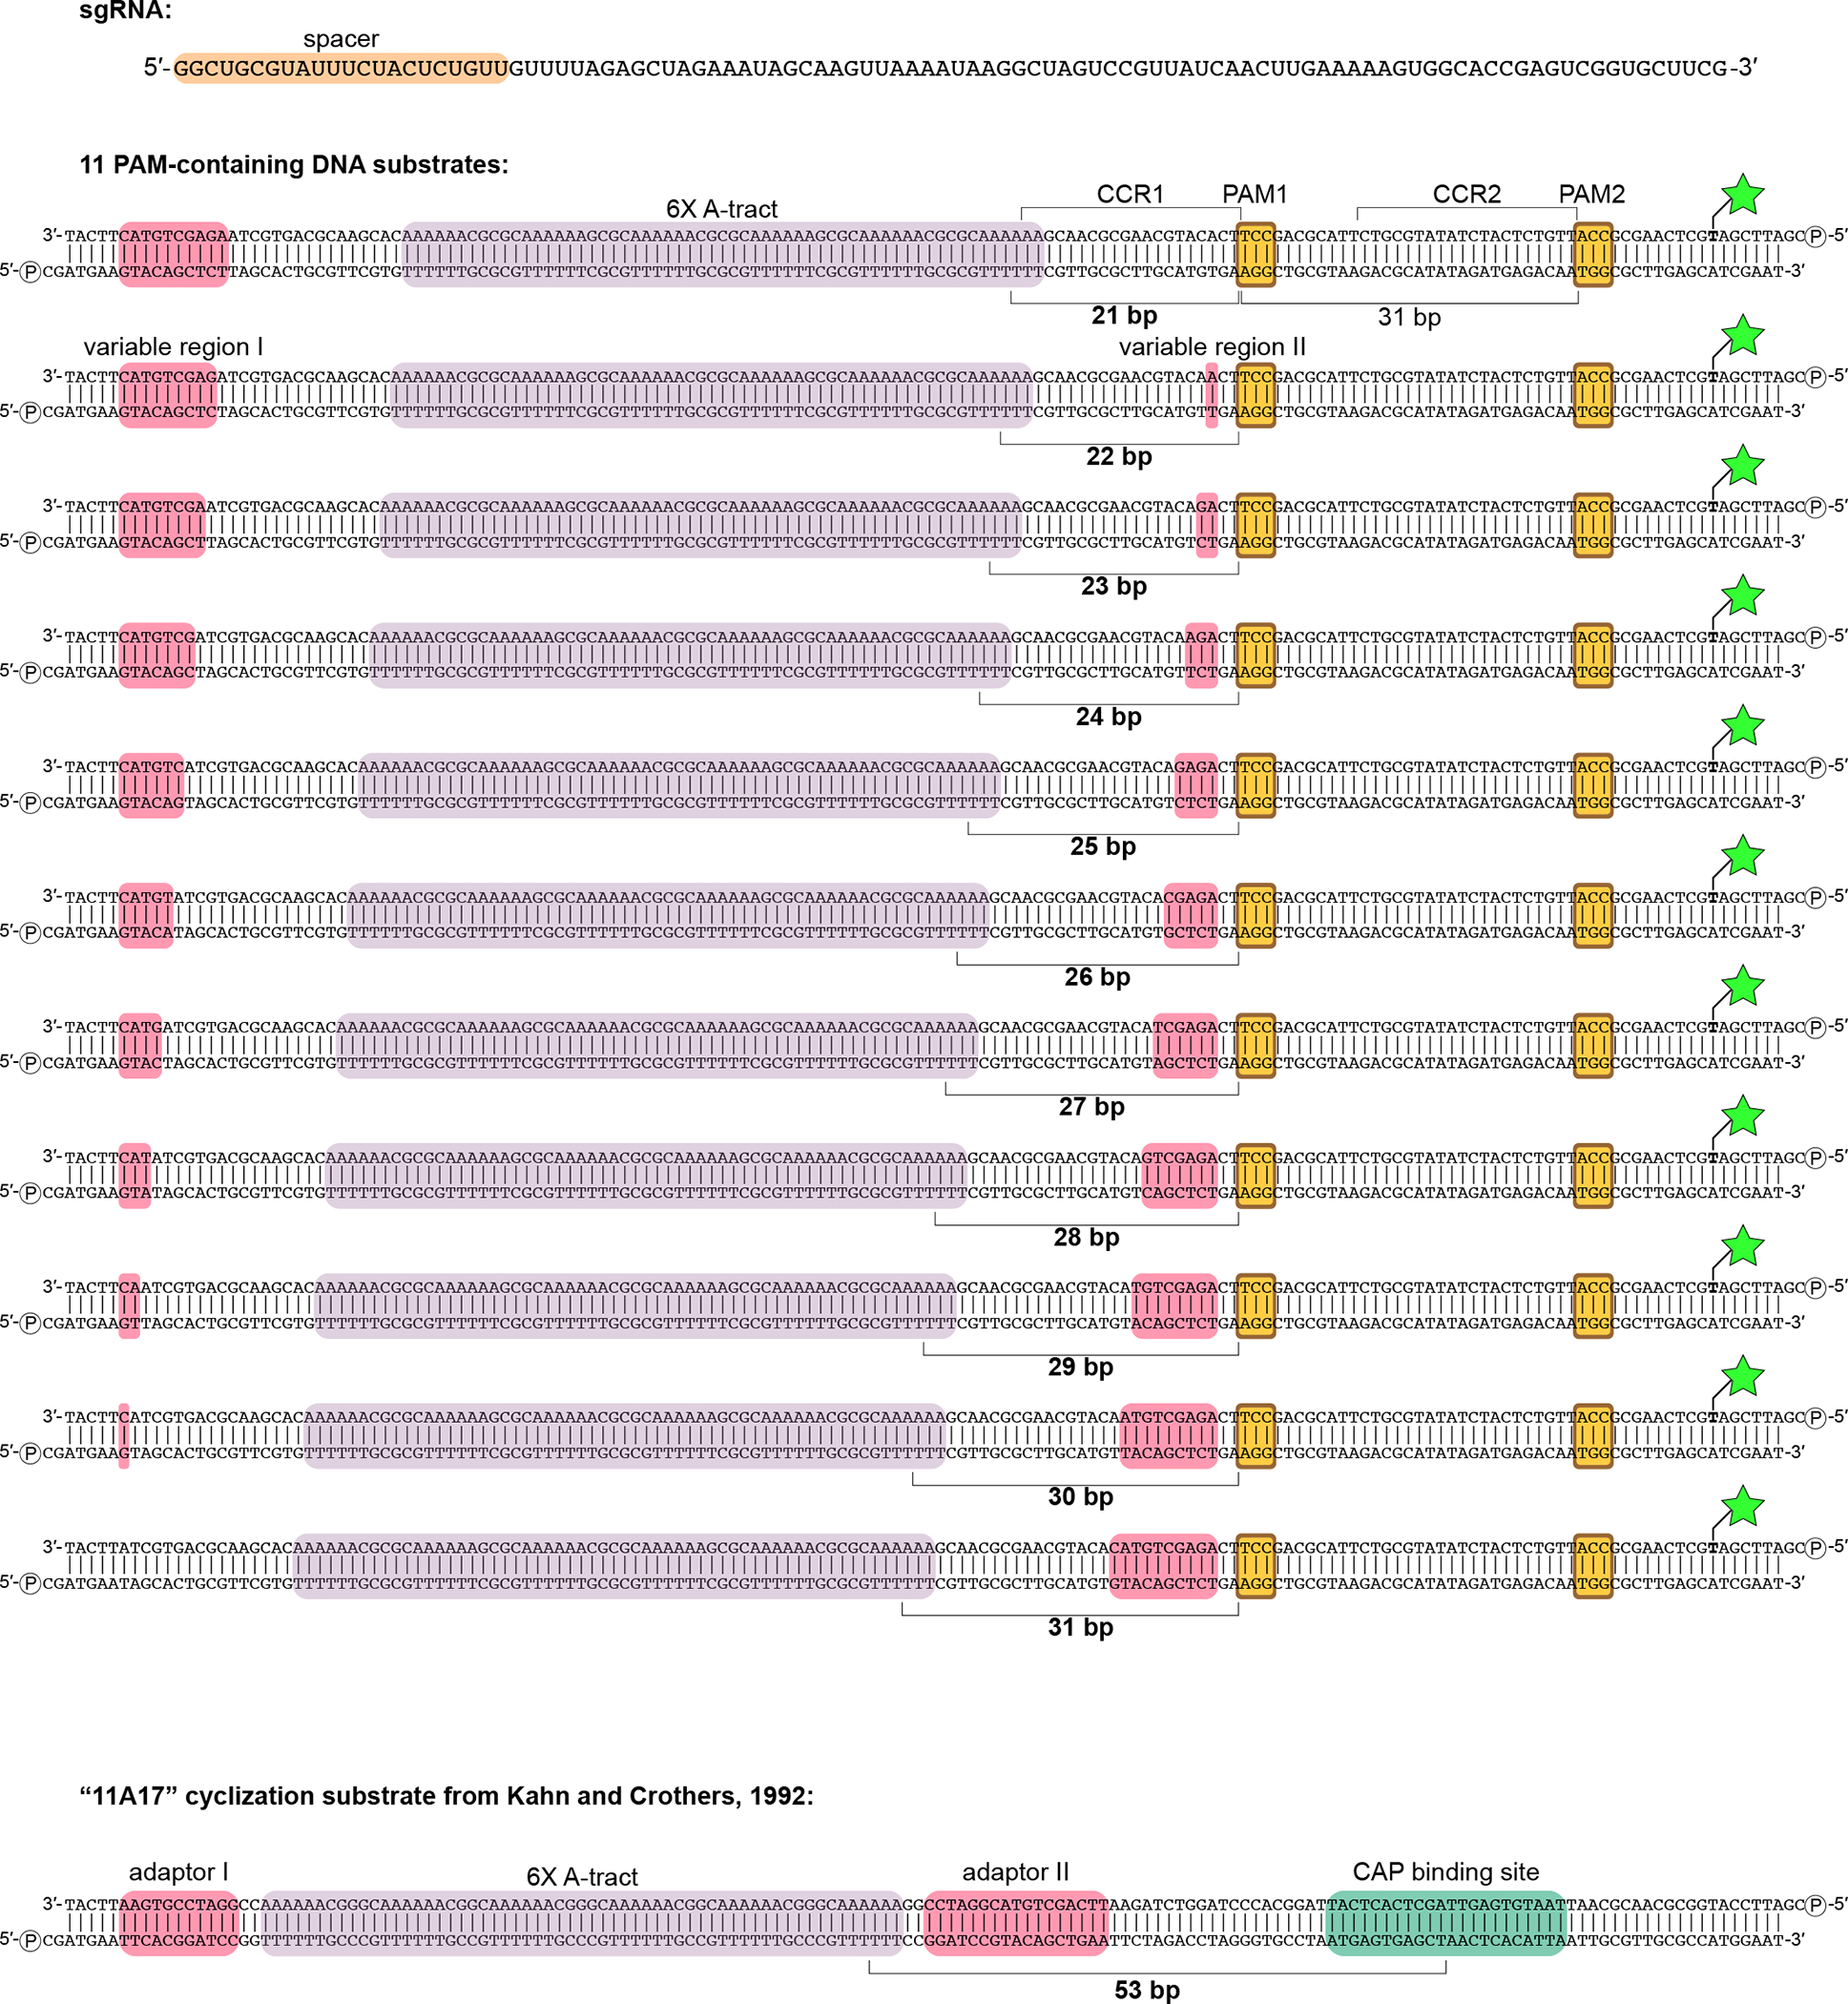
Extended Data Fig. 5
Nucleic acid sequences used in DNA cyclization experiments.
Green star/bold T, fluorescein-conjugated dT; circled P, 5u2032 phosphate; CCR, candidate complementarity region.
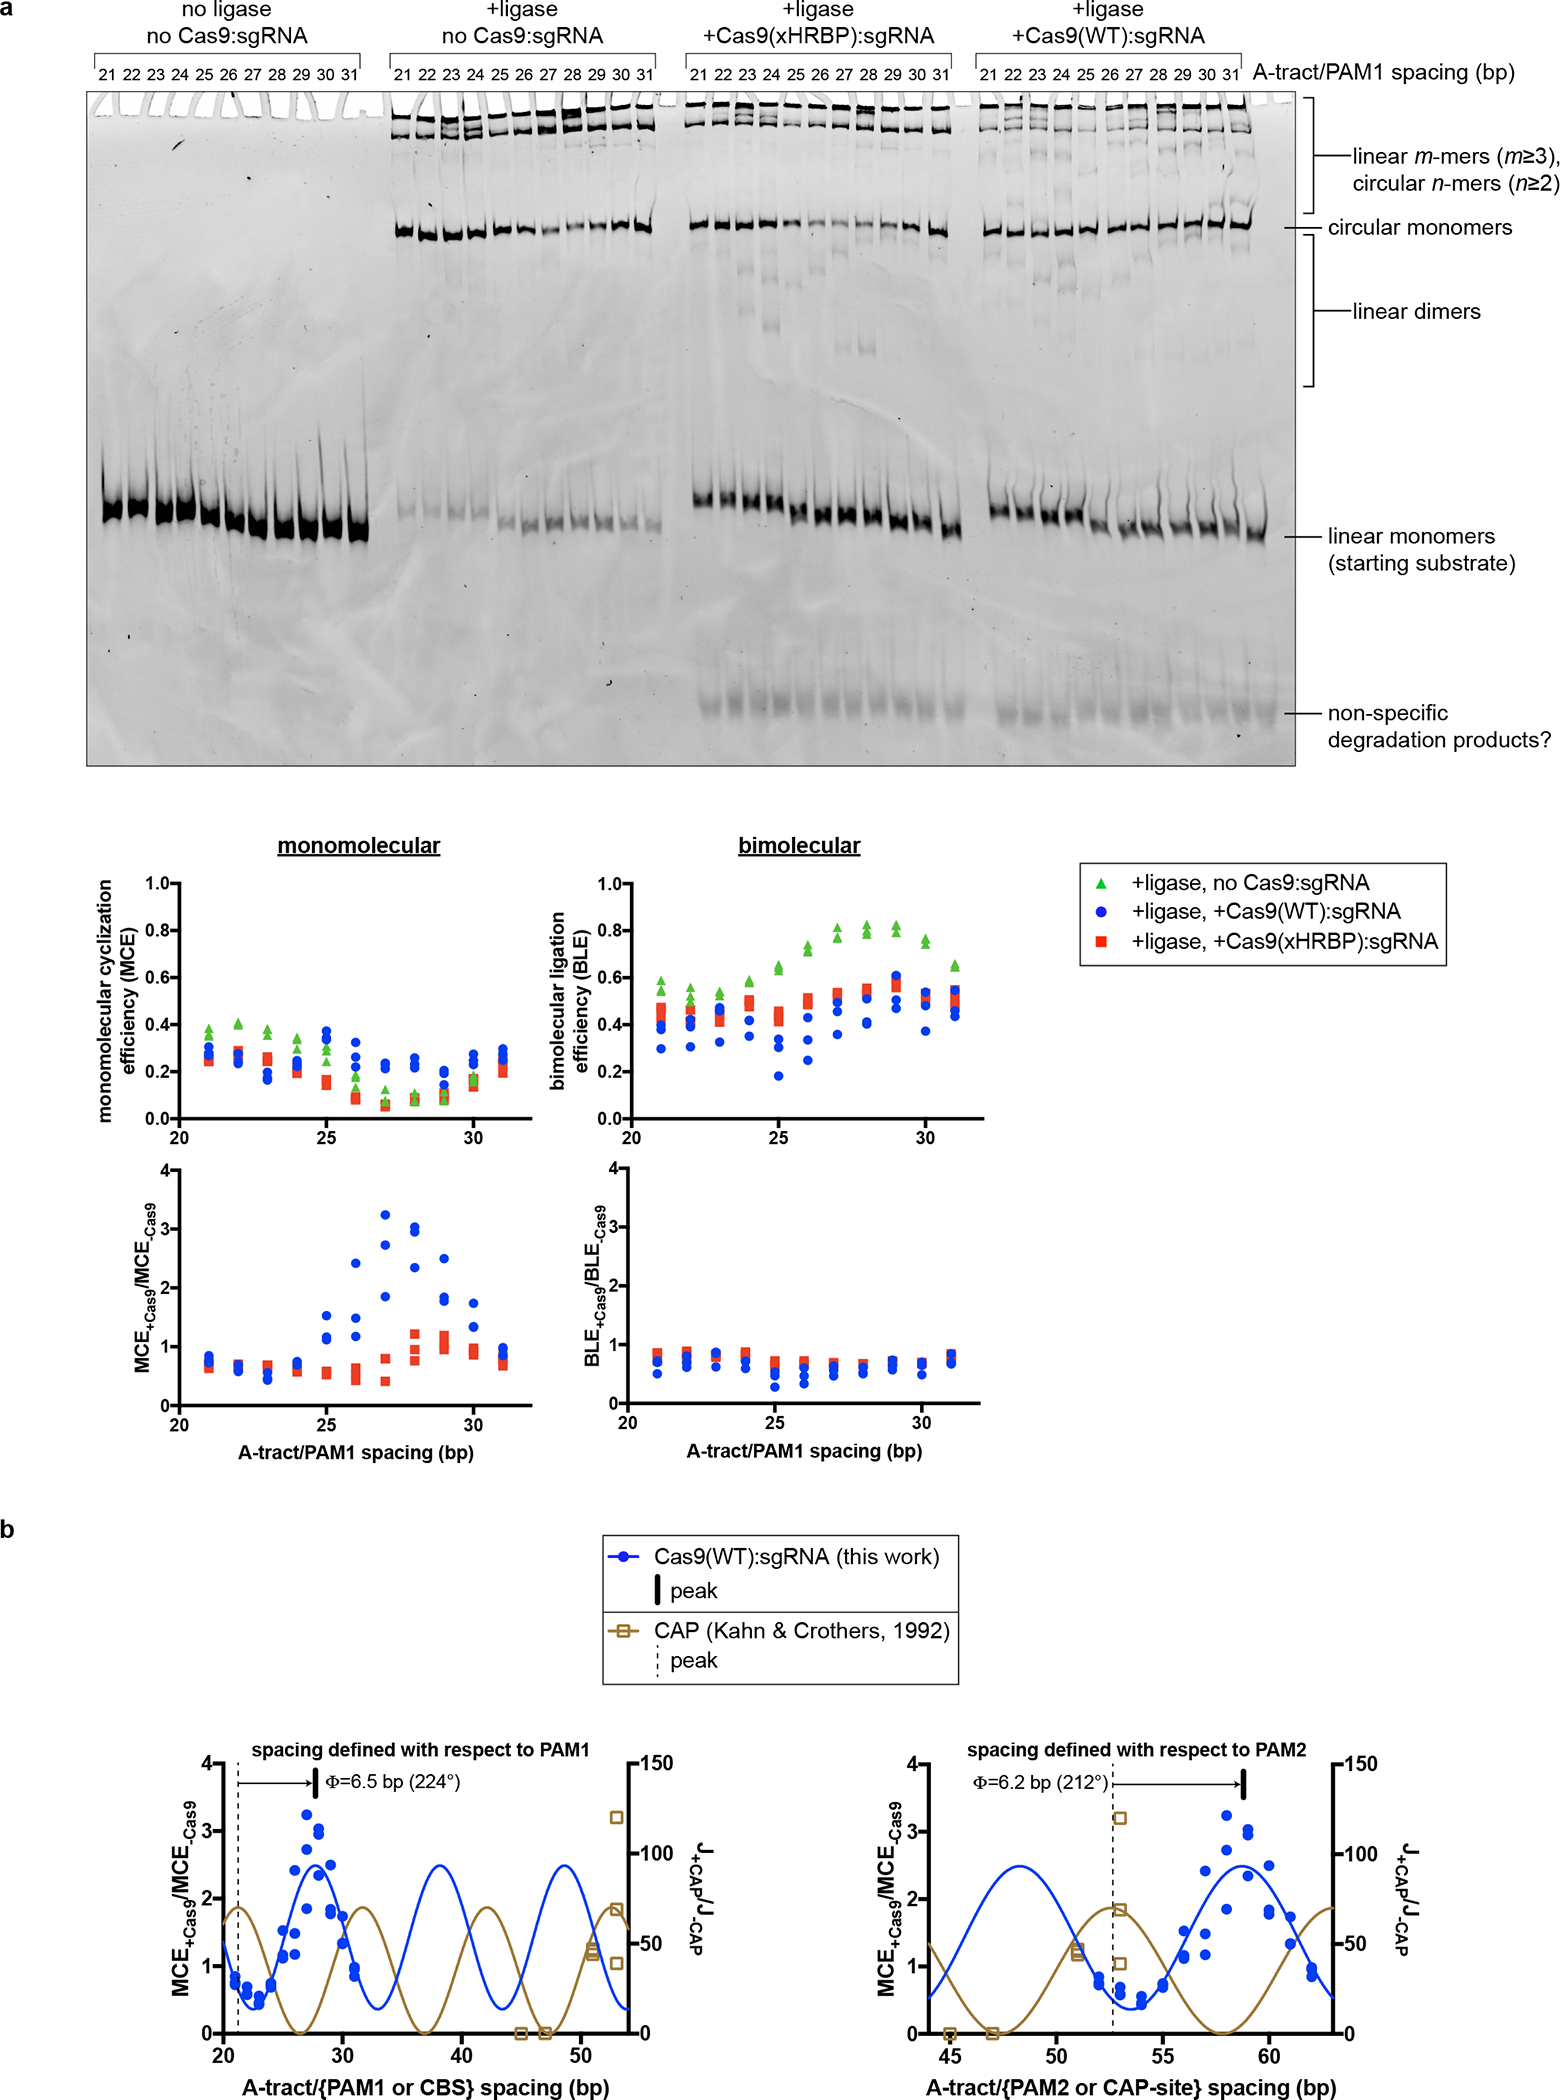
Extended Data Fig. 6
Details of DNA cyclization experiments.
a , Fluorescence image and analysis of native PAGE gel resolving ligation products. Gel represents one replicate. Three replicates are plotted on the graphs. The polymeric/cyclized band assignments we...
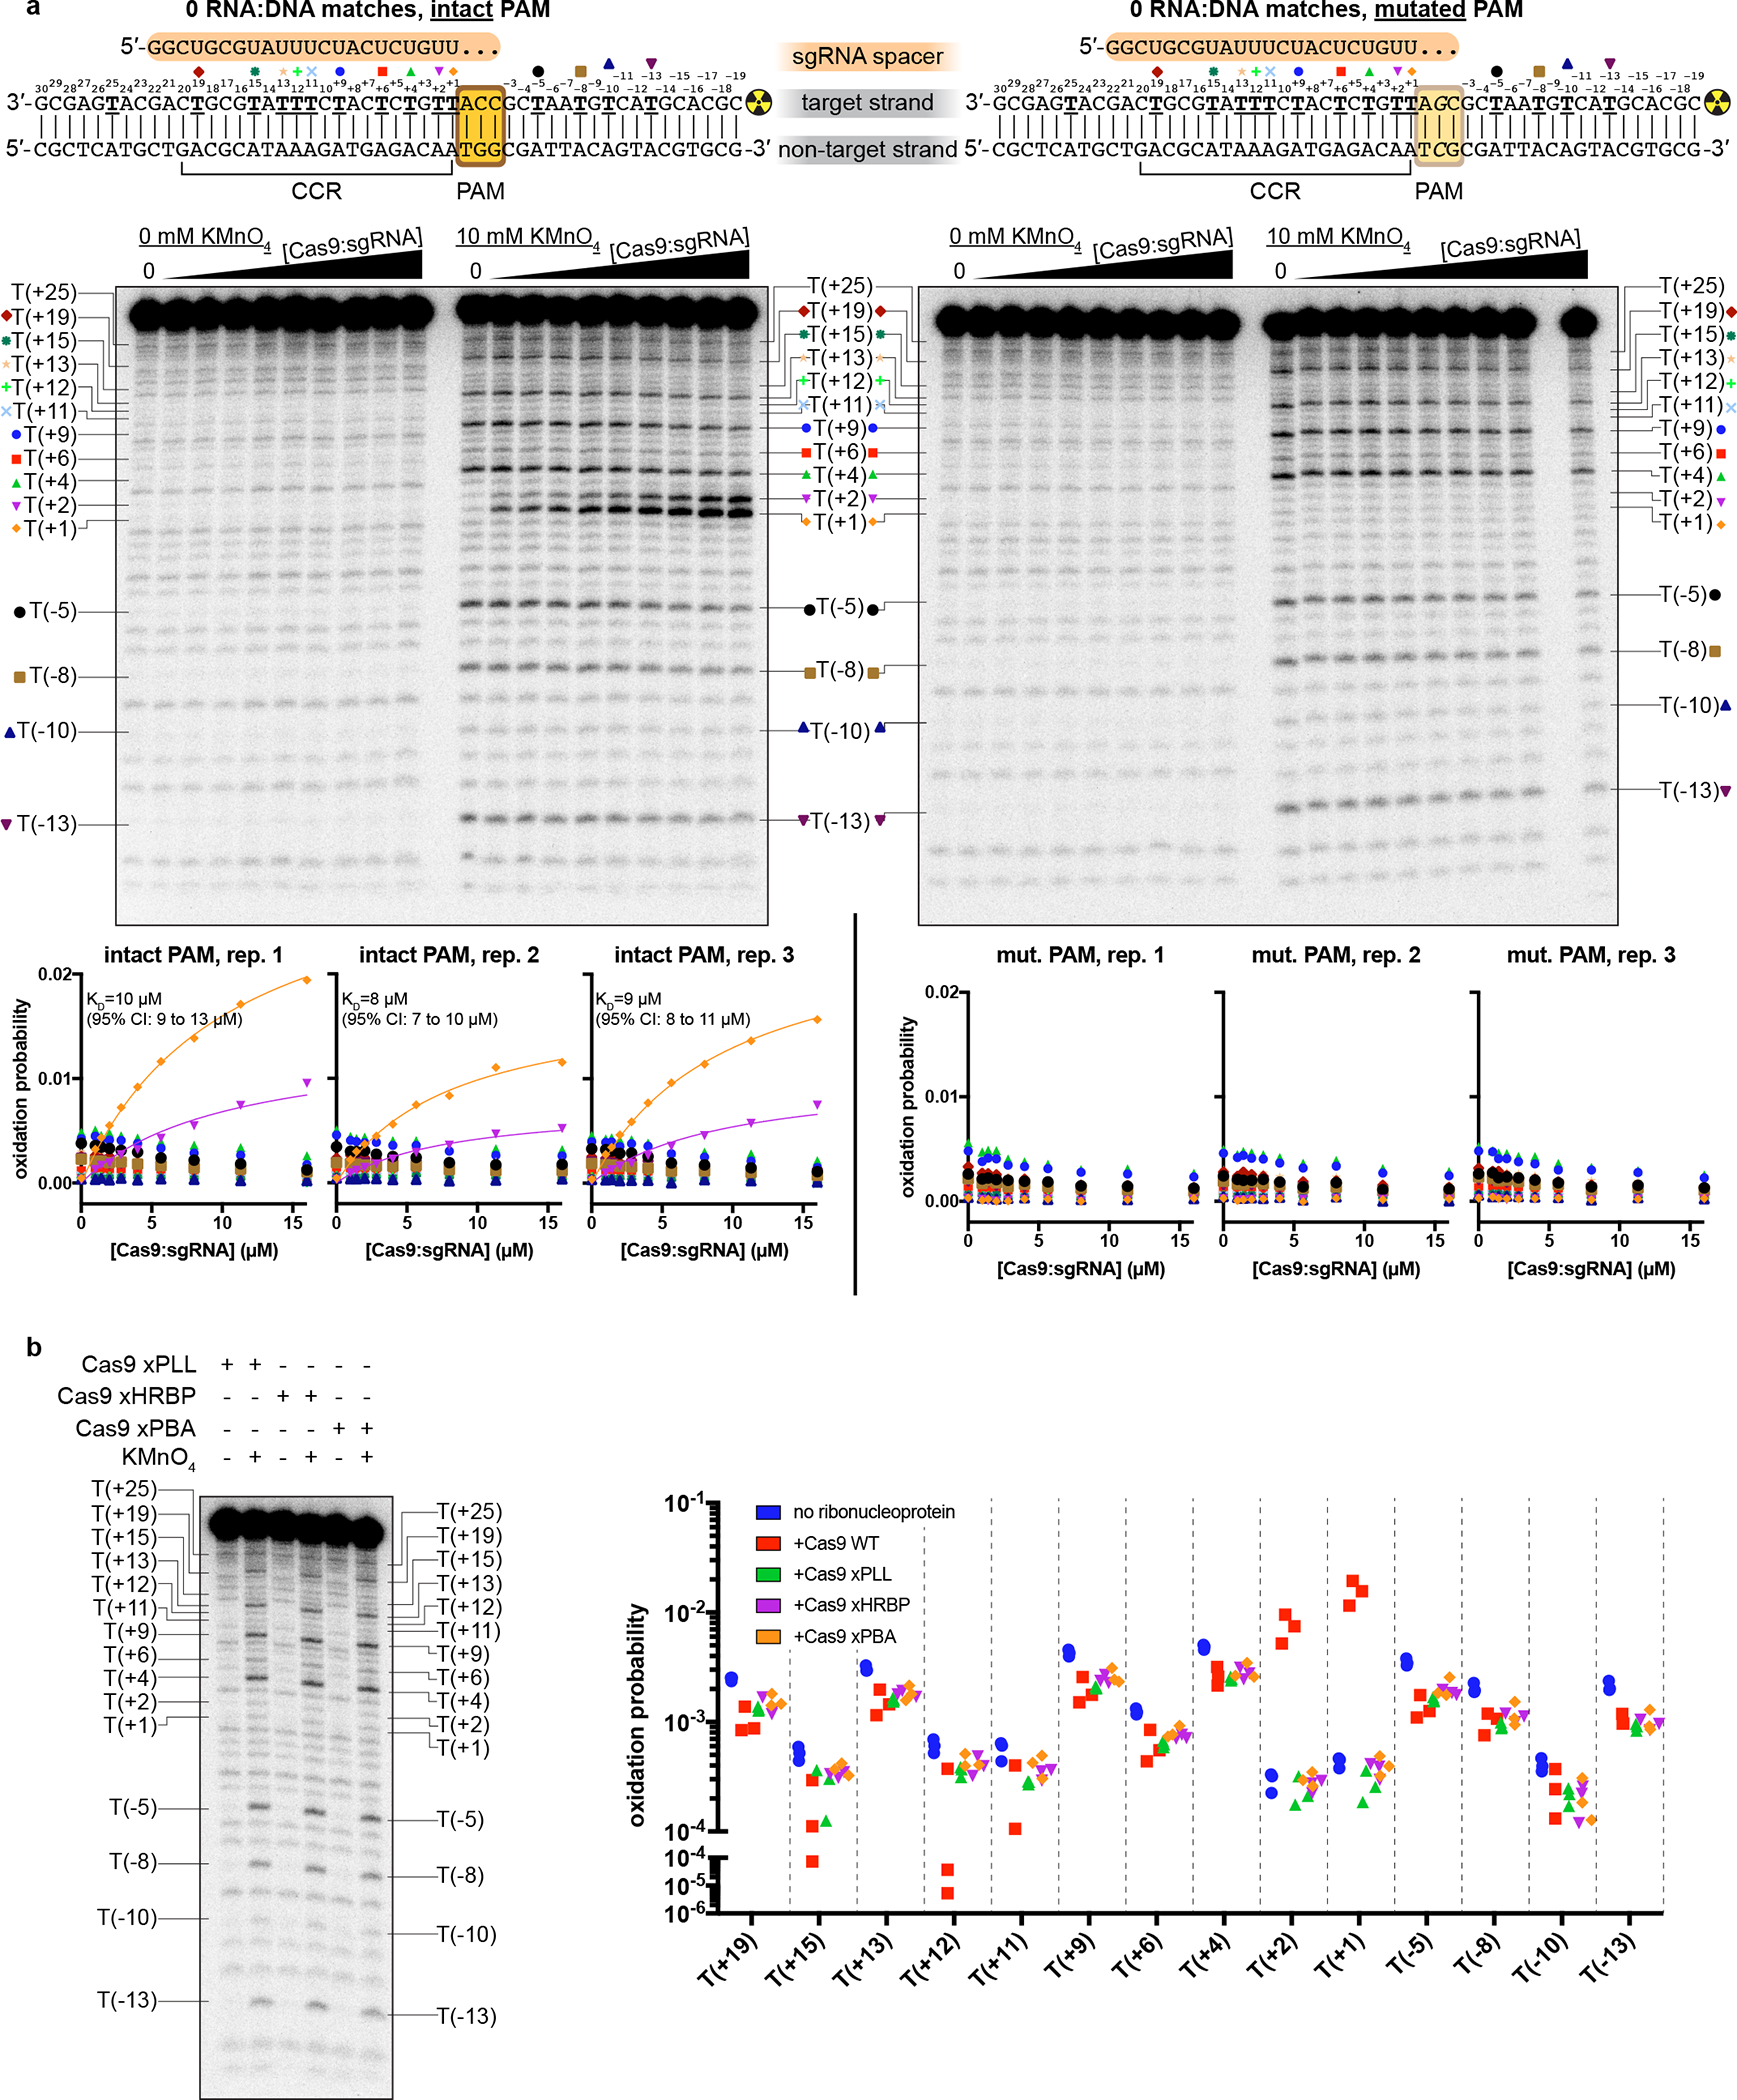
Extended Data Fig. 7
Details of permanganate reactivity measurements.
a , Autoradiographs and analysis of all thymines except T(+25), which was insufficiently resolved from neighboring bands. The depicted autoradiographs are replicate 1. Due to systematic variation acro...
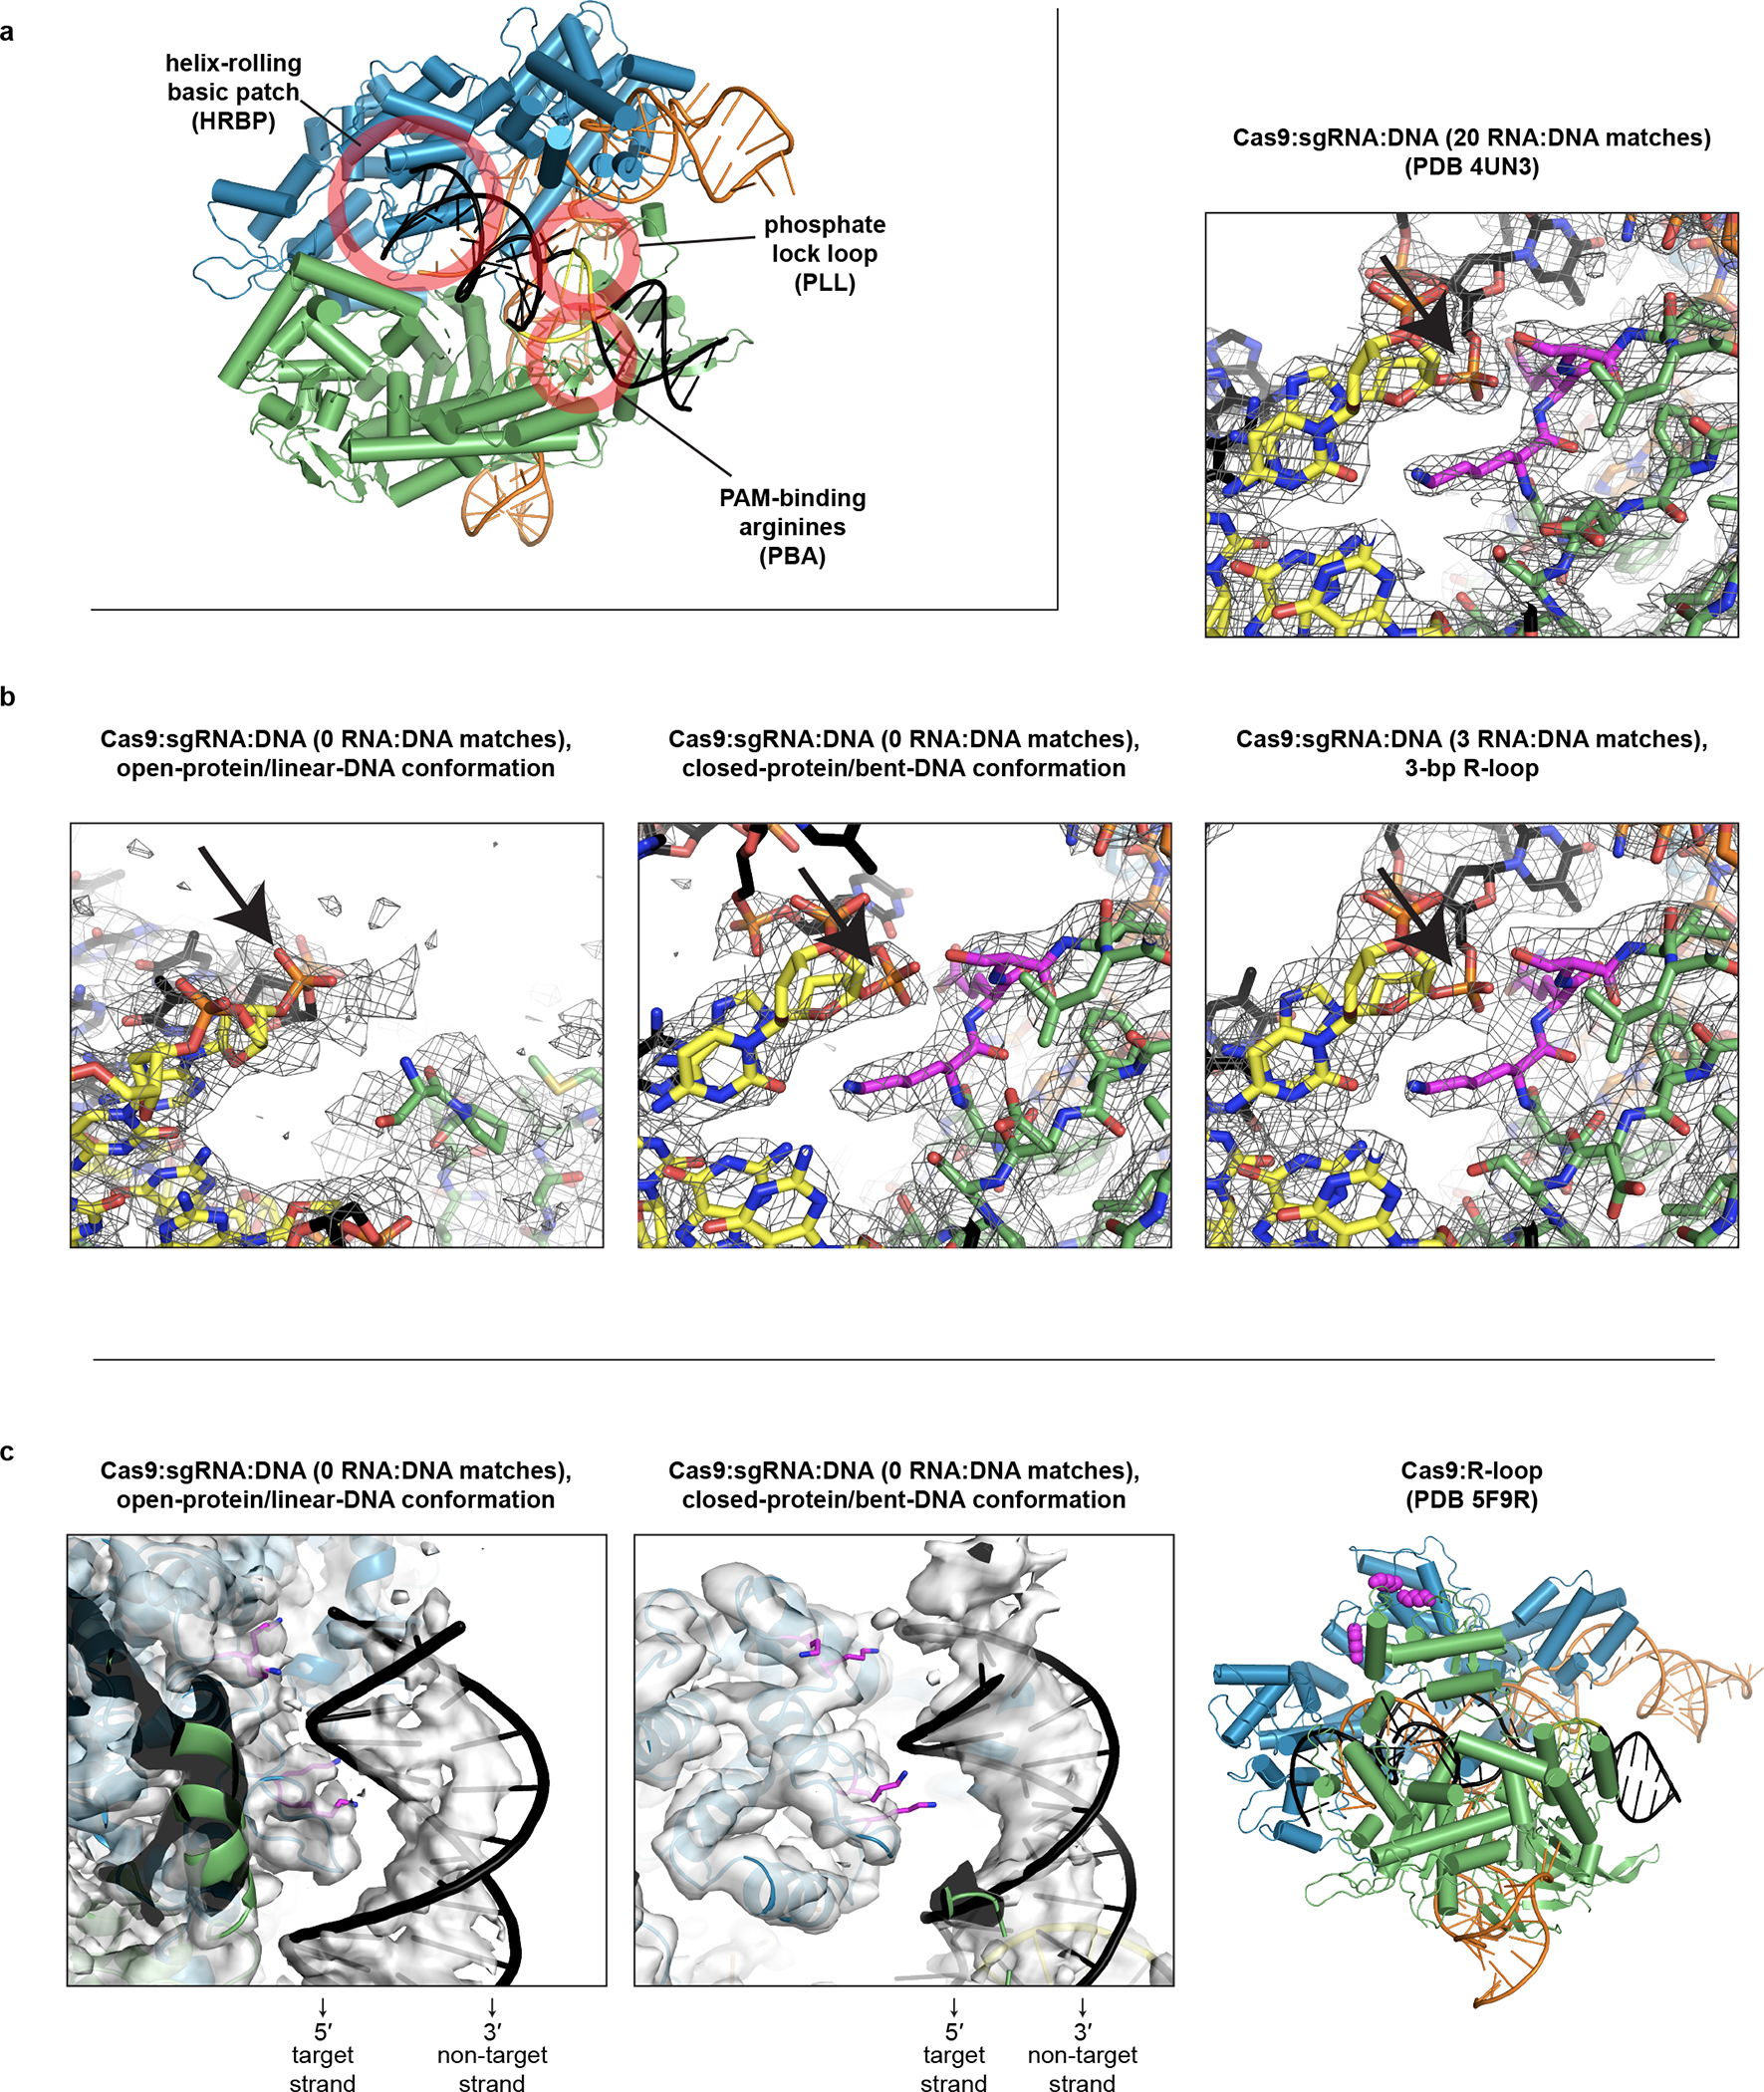
Extended Data Fig. 8
Structural features potentially relevant to Cas9-induced DNA bending.
a , Location of each feature in the bent-DNA structure. Green, NUC lobe; blue, REC lobe; orange, guide RNA; black, DNA; yellow, PAM. b , Comparison of phosphate lock loop (magenta) in various structur...
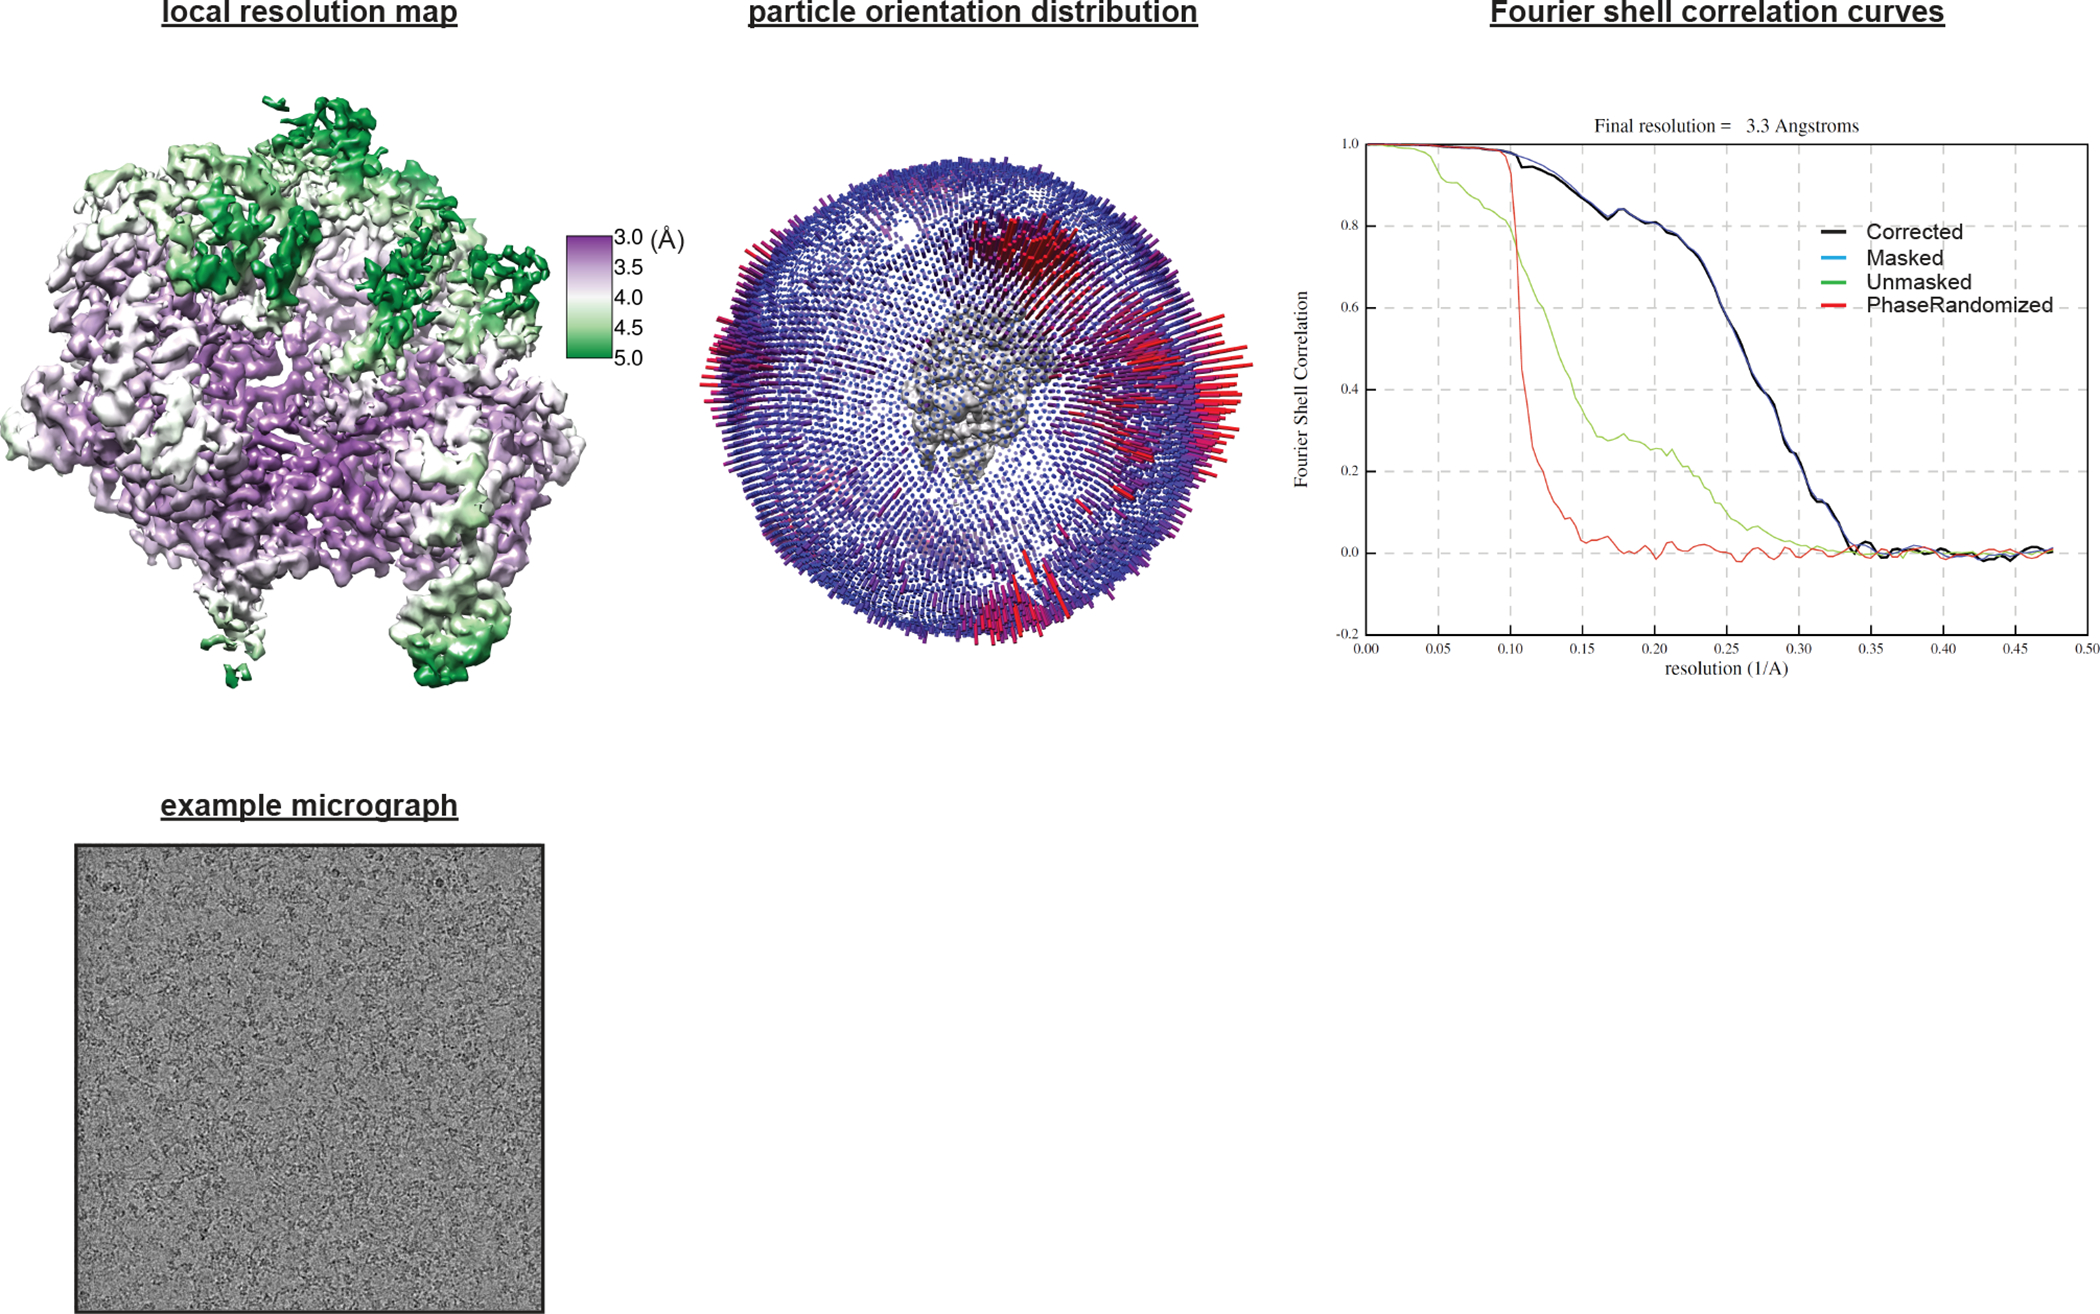
Extended Data Fig. 9
Cryo-EM analysis of Cas9:sgRNA:DNA with 3 RNA:DNA matches.
Details of cryo-EM analysis.
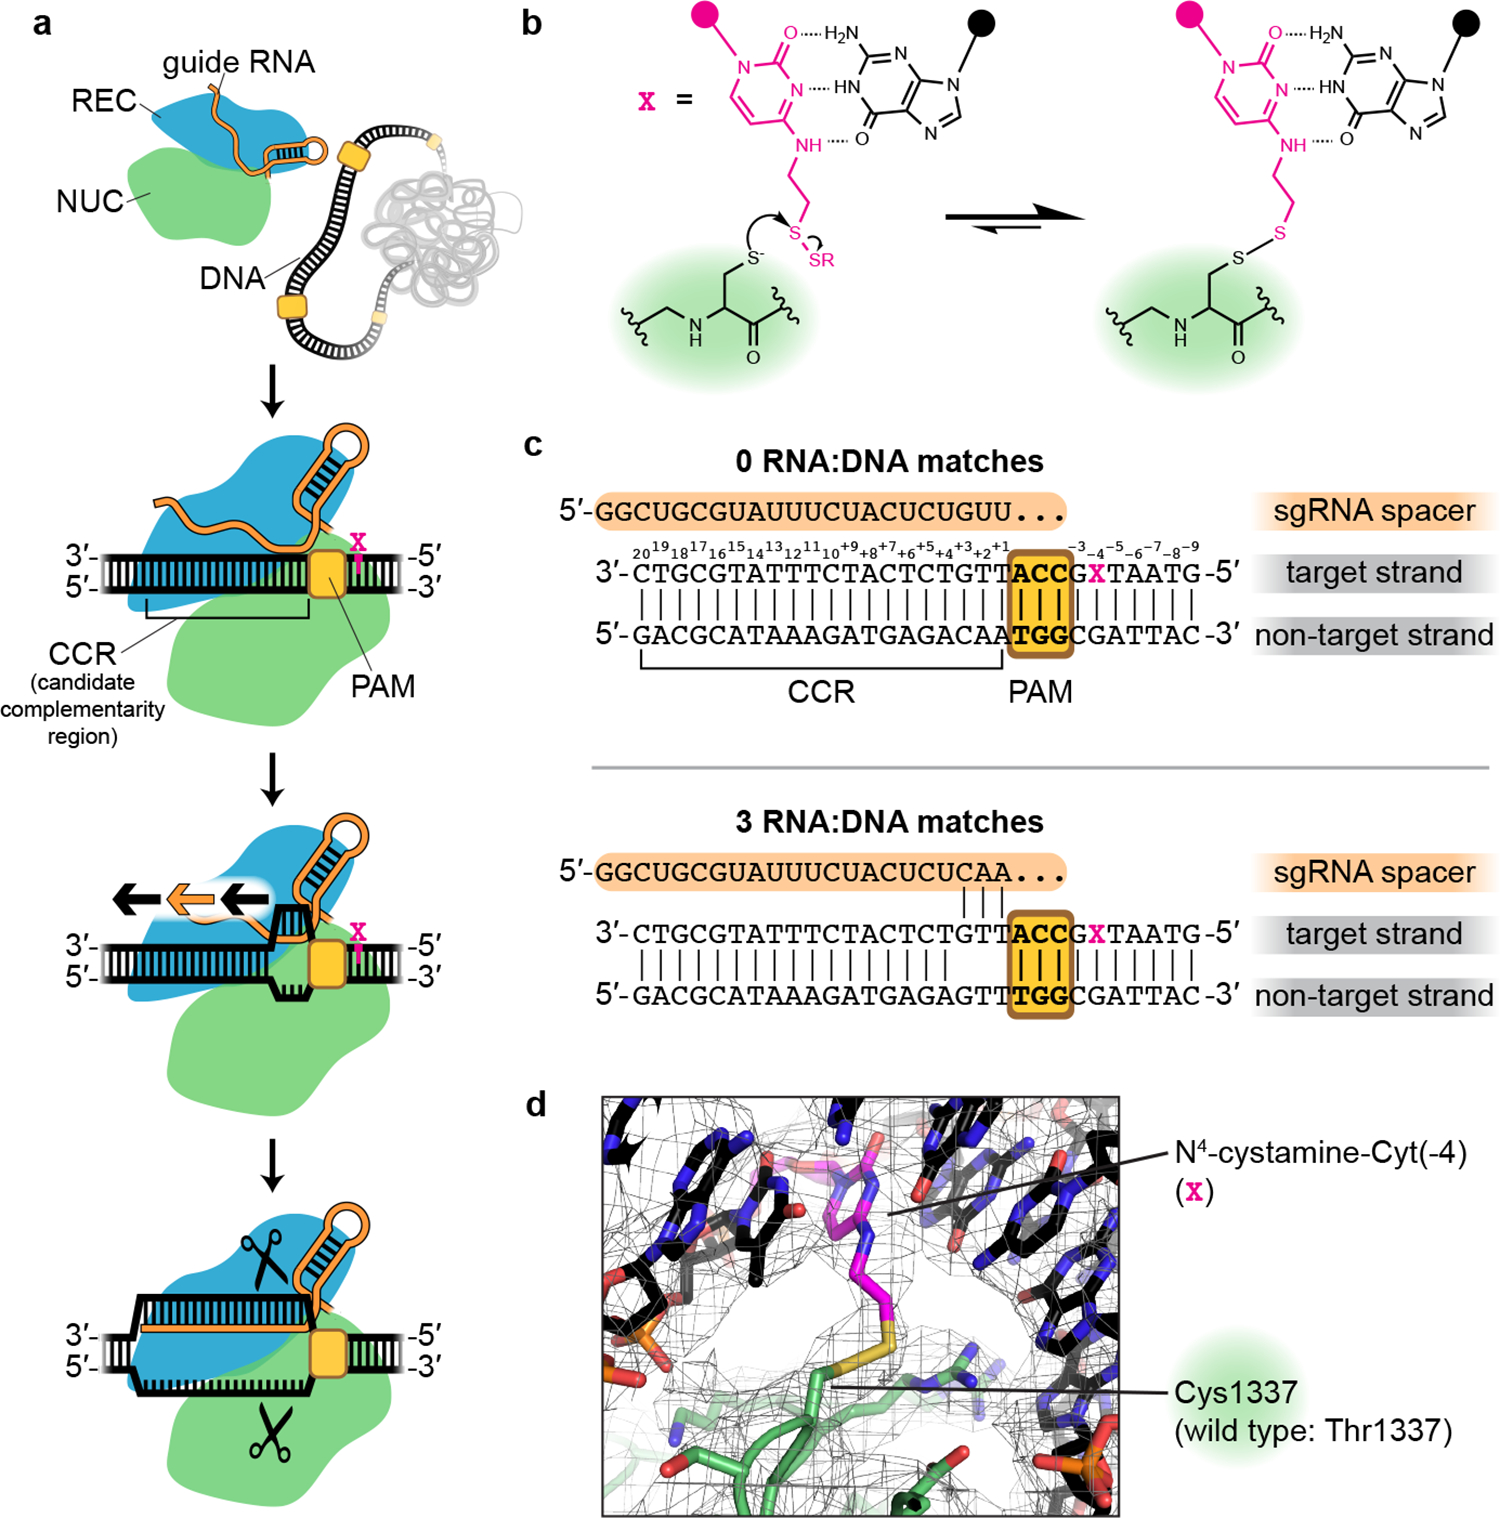
Fig. 1 |
Trapping the Cas9 interrogation complex.
a , Known steps leading to Cas9-catalyzed DNA cleavage. Orange/black arrows indicate direction of guide RNA strand invasion into the DNA helix. Magenta X indicates location of cystamine modification. ...
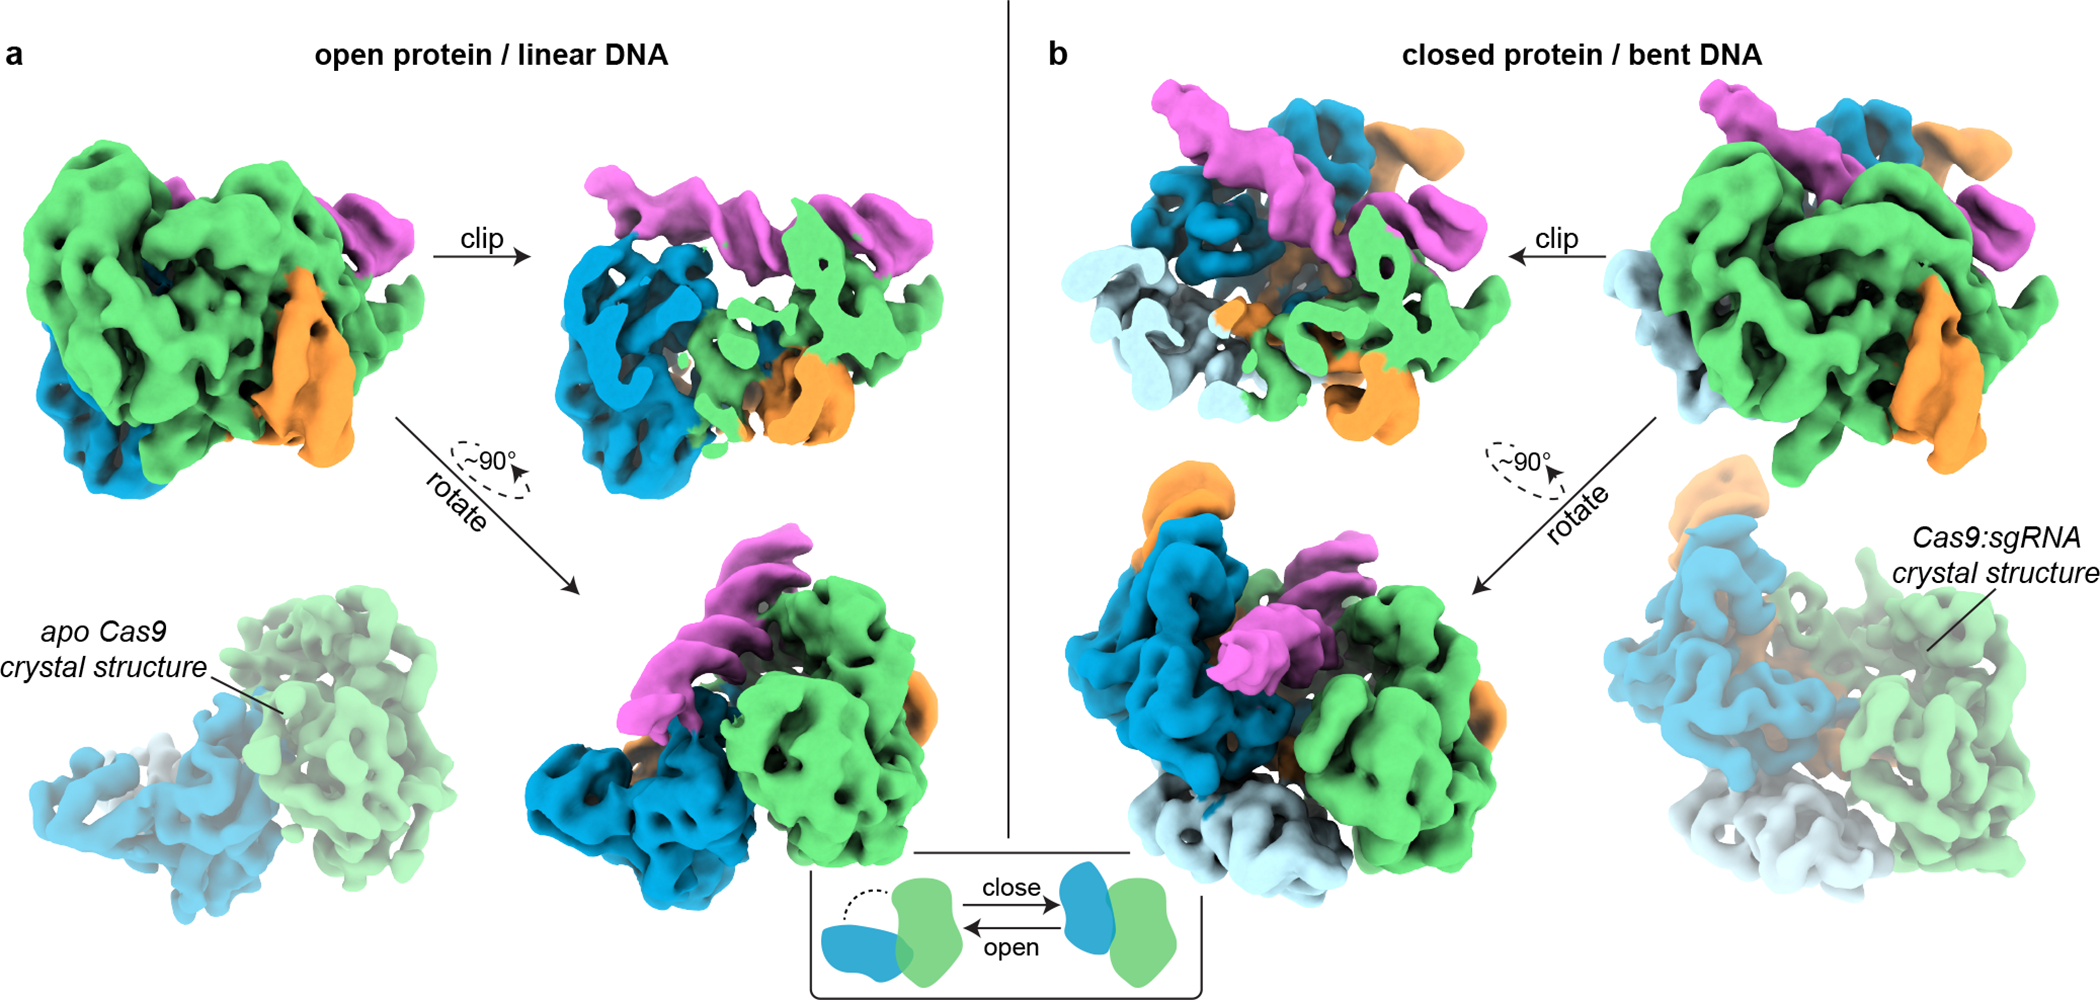
Fig. 2 |
Cryo-EM structures of the Cas9 interrogation complex, compared to previously determined crystal structures.
a , Unsharpened cryo-EM map (threshold 4u03c3) of Cas9 interrogation complex in open-protein/linear-DNA conformation, alongside apo Cas9 crystal structure (PDB 4CMP, 2Fo-Fc, threshold 1.5u03c3). b , C...
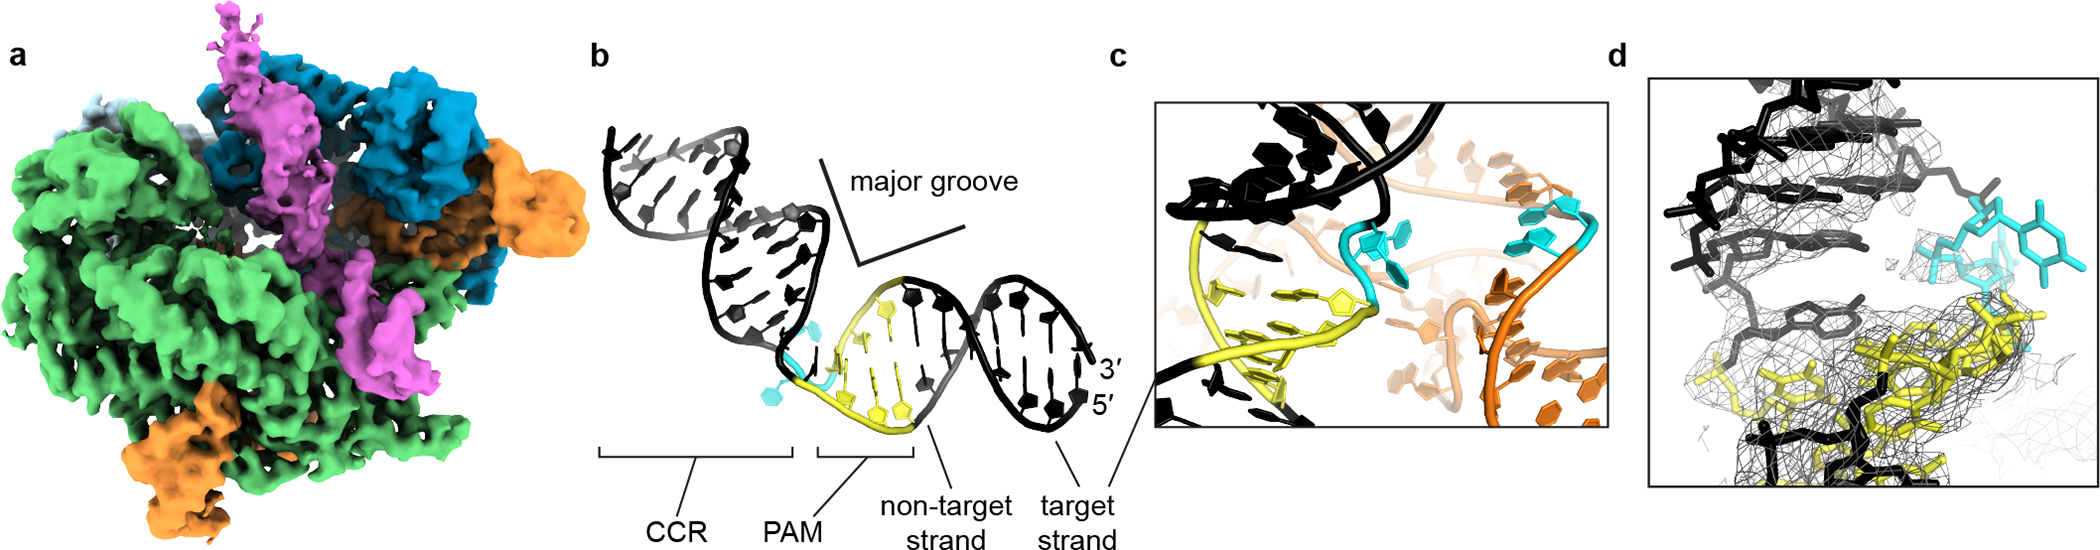
Fig. 3 |
DNA conformation at the site of bending.
a , Unsharpened cryo-EM map (threshold 5u03c3) of Cas9 interrogation complex in closed-protein/bent-DNA conformation. Green, NUC lobe; blue, REC lobe; orange, guide RNA; magenta, DNA. b , Bent DNA mod...
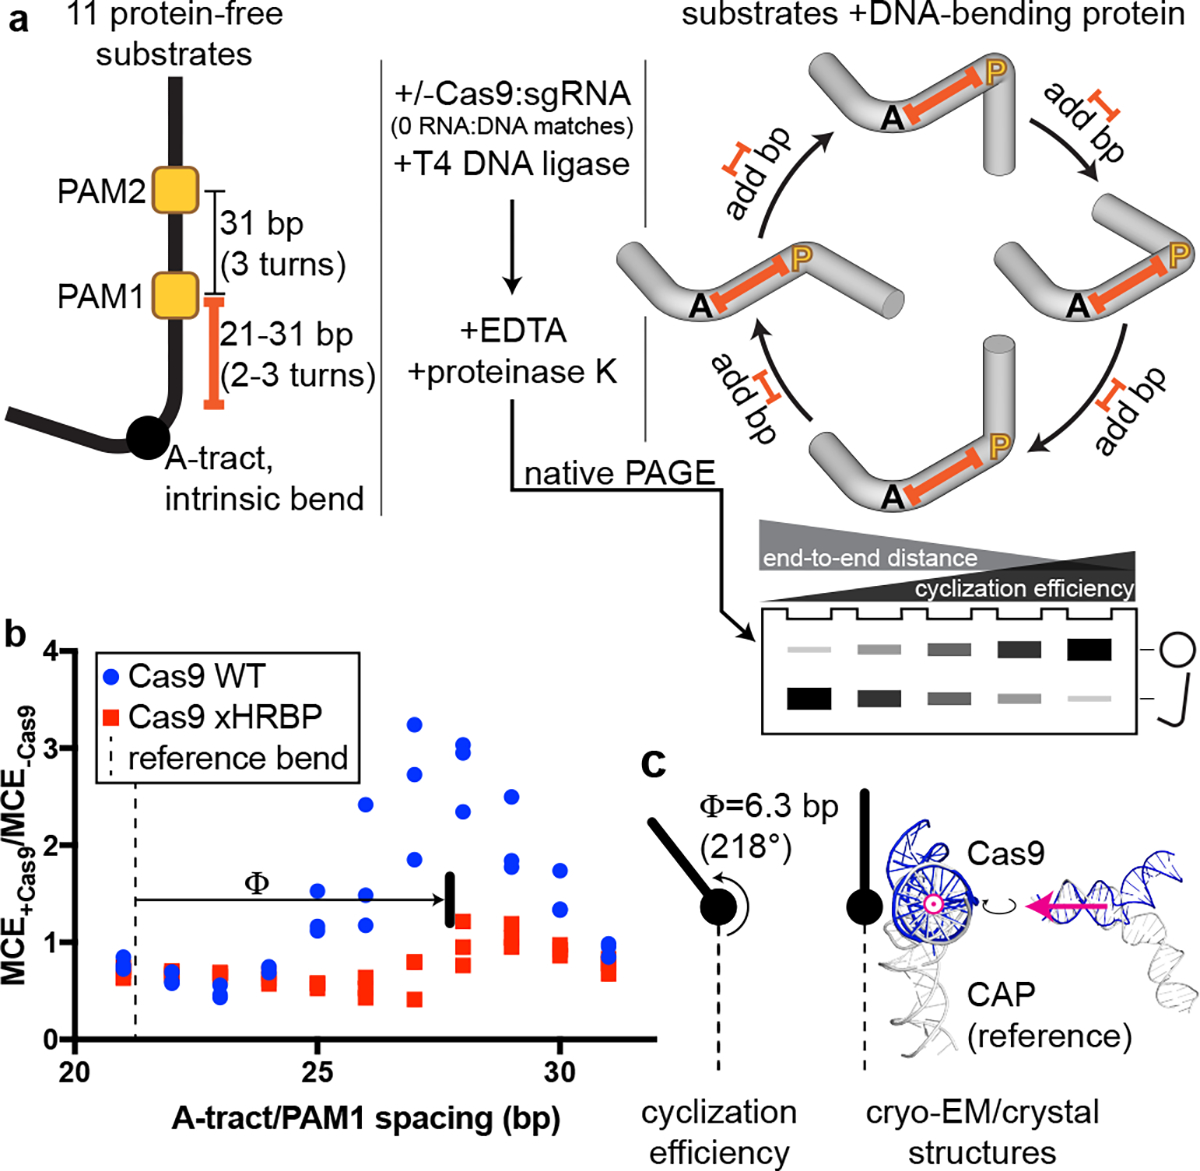
Fig. 4 |
DNA cyclization efficiency experiments.
a , Substrate structure and experimental pipeline. Black A, A-tract; yellow P, PAM; orange spacer, A-tract/PAM1 distance (21u201331 bp). For simplicity, bending is only depicted at a single PAM in the...
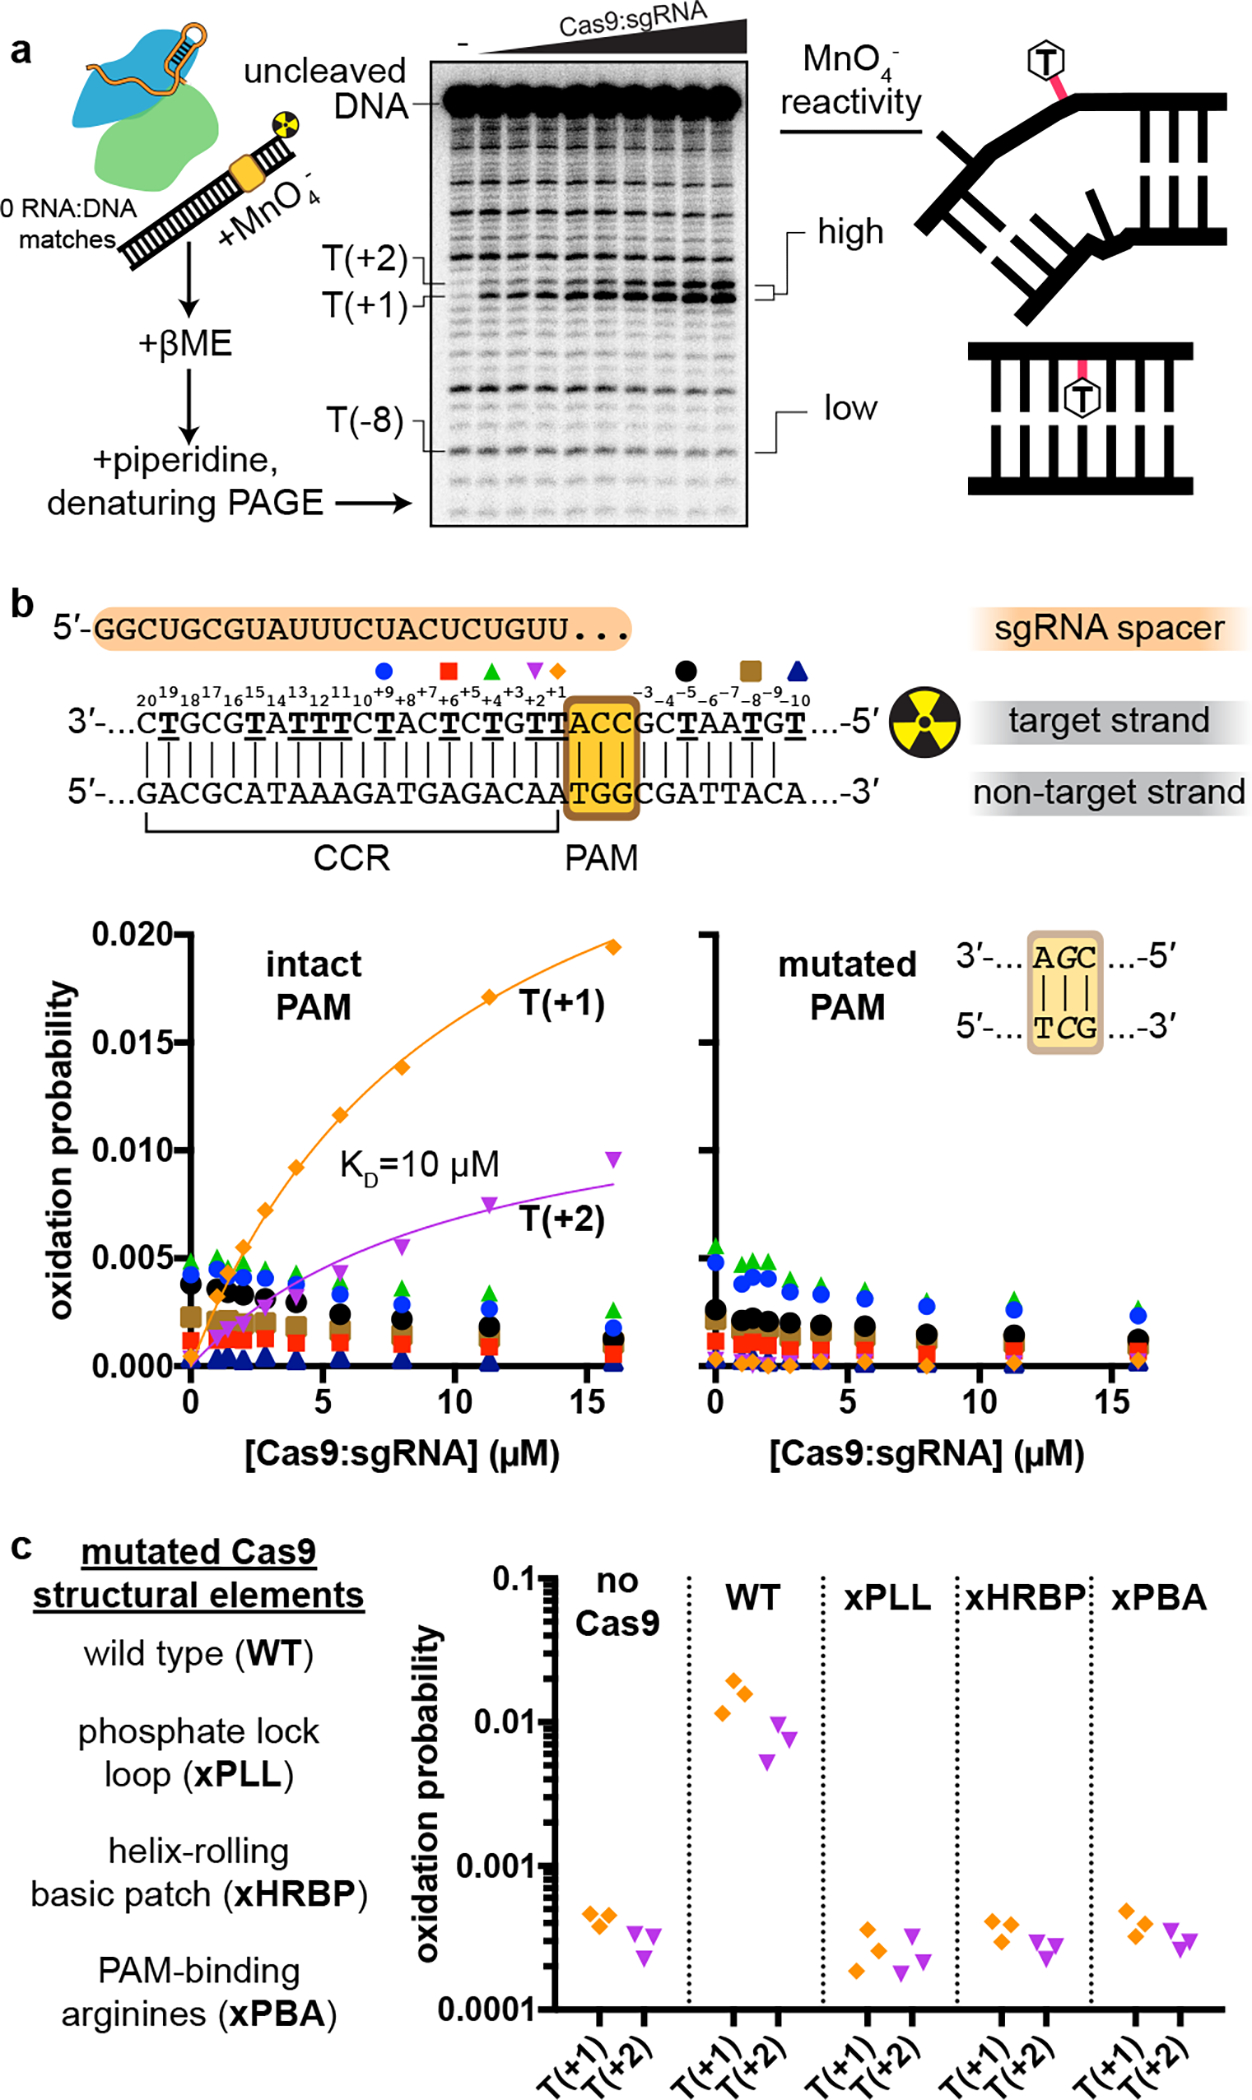
Fig. 5 |
Permanganate reactivity measurements.
a , Experimental pipeline. The autoradiograph depicts the raw data used to produce the u201cintact PAMu201d graph in b . b , Oxidation probability of select thymines as a function of [Cas9:sgRNA]. Dat...
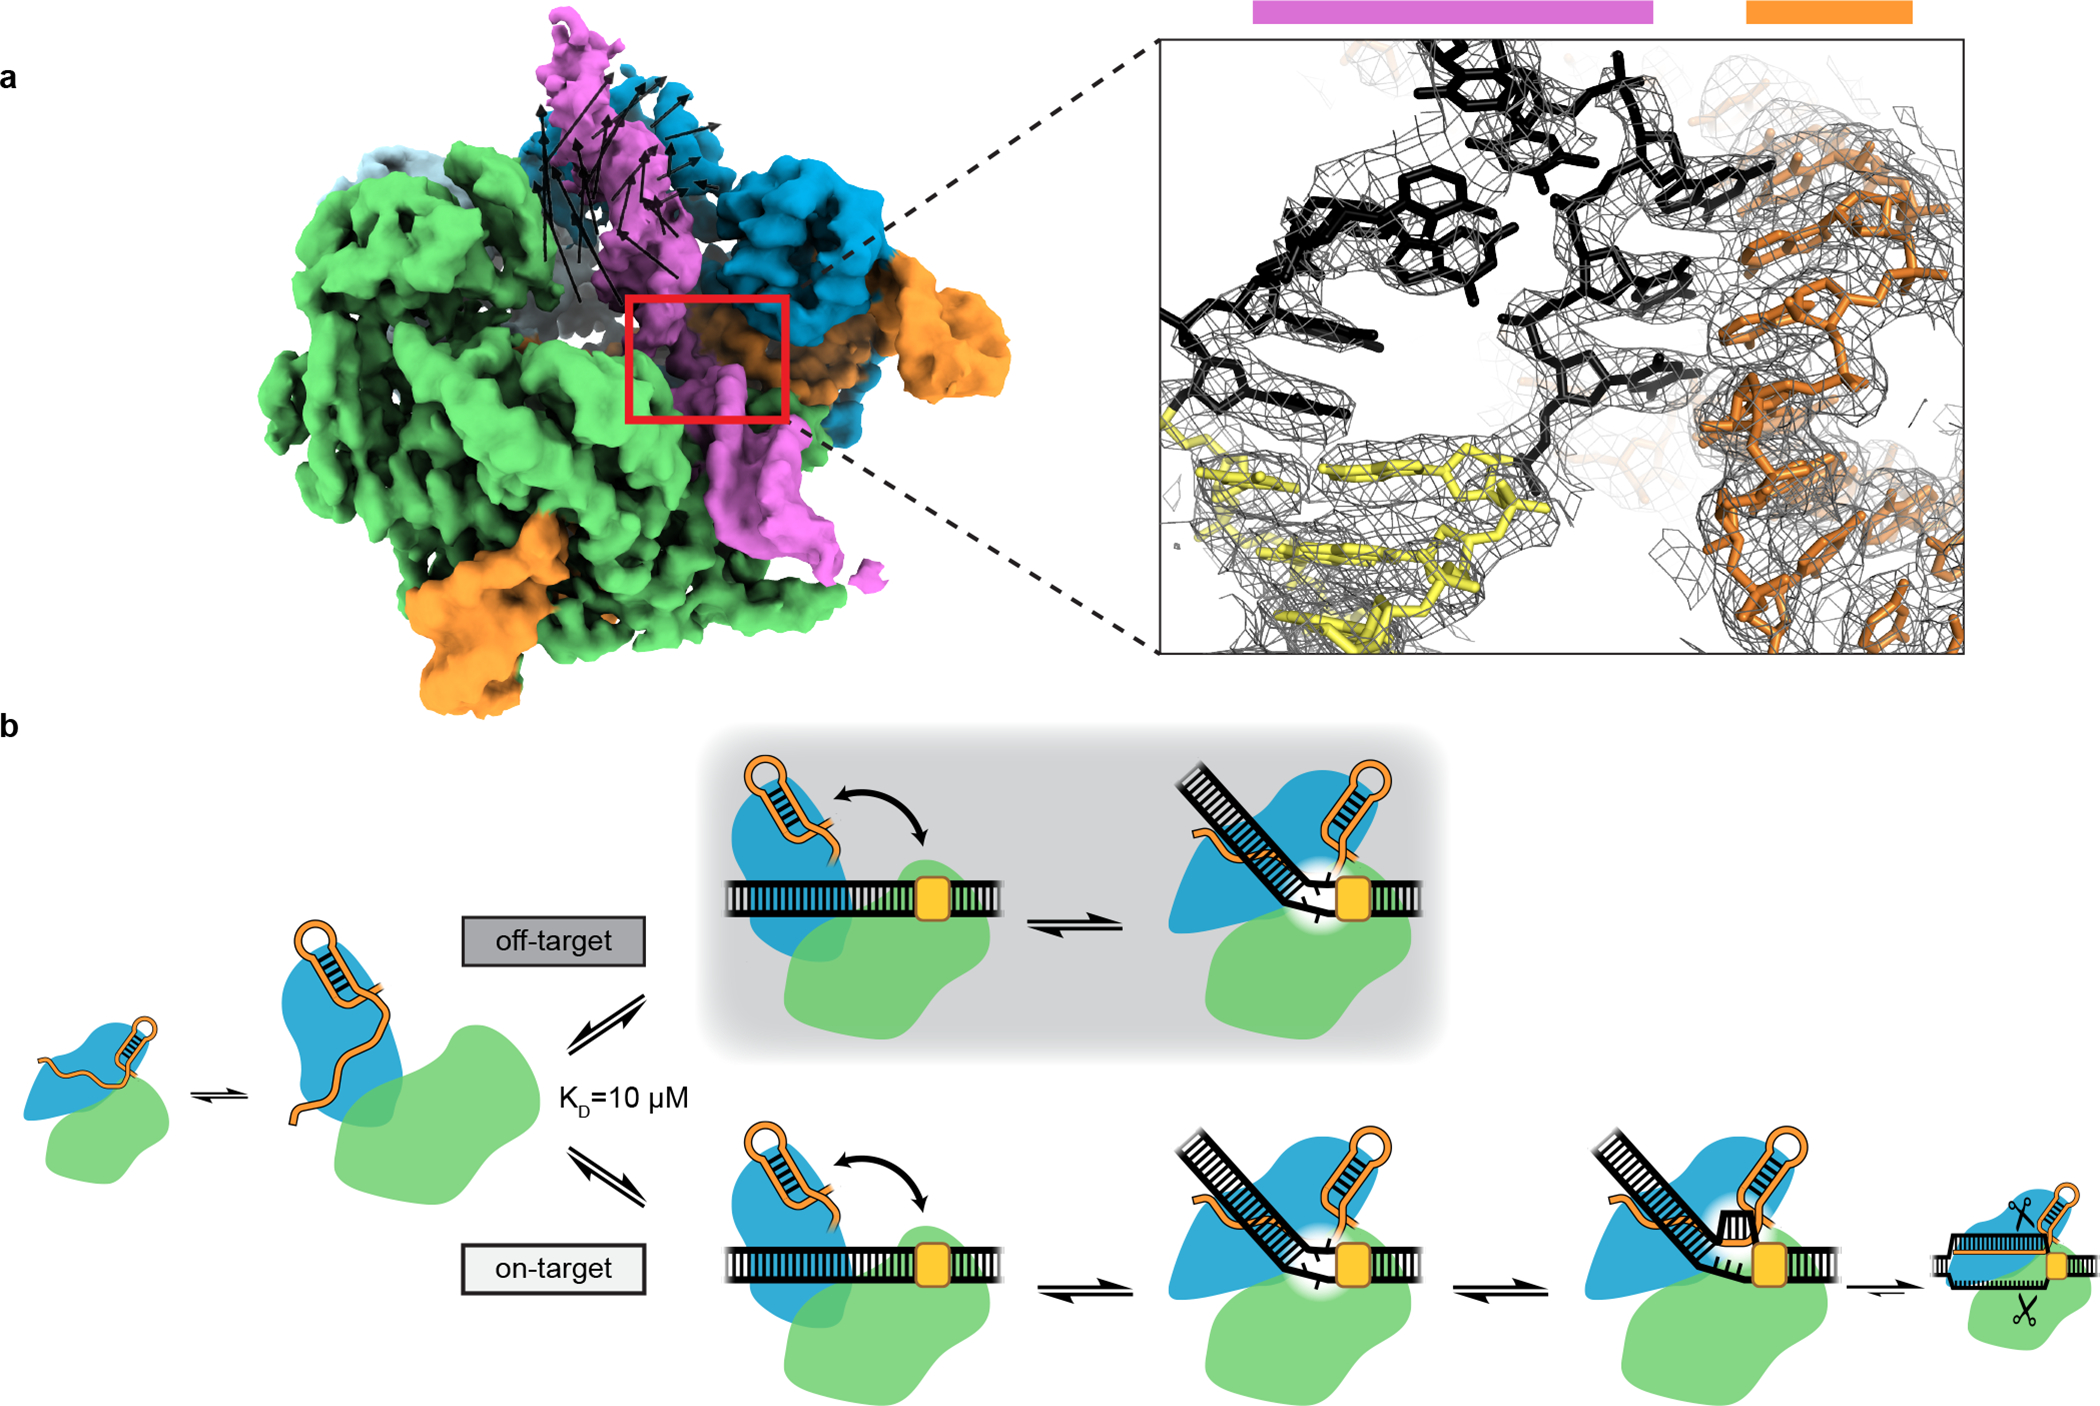
Fig. 6 |
Structure of a nascent R-loop and overview model.
a , Left, unsharpened cryo-EM map (threshold 5u03c3) of Cas9:sgRNA:DNA with 3 RNA:DNA bp. Green, NUC lobe; blue, REC lobe; orange, guide RNA; magenta, DNA. Black vectors indicate differences from the ...
Figure images are served from the NIH/NLM PubMed Central Open Access Subset or Europe PMC; copyright remains with the publishers and authors.
💬 Discussion
0 commentsNo comments yet. Be the first to start a discussion!
Leave a Comment