Abstract
The recently reported "UK variant" (B.1.1.7) of SARS-CoV-2 is thought to be more infectious than previously circulating strains as a result of several changes, including the N501Y mutation. We present a 2.9-Å resolution cryo-electron microscopy (cryo-EM) structure of the complex between the ACE2 receptor and N501Y spike protein ectodomains that shows Y501 inserted into a cavity at the binding interface near Y41 of ACE2. This additional interaction provides a structural explanation for the increased ACE2 affinity of the N501Y mutant, and likely contributes to its increased infectivity. However, this mutation does not result in large structural changes, enabling important neutralization epitopes to be retained in the spike receptor binding domain. We confirmed this through biophysical assays and by determining cryo-EM structures of spike protein ectodomains bound to 2 representative potent neutralizing antibody fragments.
🔬 Techniques
🔭 Microscopes
💻 Software
✨ Fluorophores
🧪 Sample Preparation
🔬 Cell Lines
🏭 Microscope Brands
🧪 Reagent Suppliers
📷 Detectors
💻 Software Details
💾 Data Repositories
🏷️ Research Resource Identifiers (RRIDs)
Verified research resources used in this paper:
🏛️ Research Organizations (ROR)
Affiliated research institutions:
📋 Methods
Cloning, expression, and purification of recombinant spike protein constructs The wild-type SARS-CoV-2 S HexaPro expression plasmid was a gift from Jason McLellan [ 7 ] and was obtained from Addgene (plasmid #154754; http://n2t.net/addgene:154754 ; RRID: Addgene_154754). The N501Y mutation was introduced by site-directed mutagenesis (Q5 Site-Directed Mutagenesis Kit, New England Biolabs). Successful subcloning and mutation were confirmed by Sanger sequencing (Genewiz). Expi293F cells (Thermo Fisher) were grown in suspension culture using Expi293 Expression Medium (Thermo Fisher) at 37°C and 8% CO 2 . Cells were transiently transfected at a density of 3 × 10 6 cells/ml using linear polyethylenimine (Polysciences). Twenty-four hours following transfection, the medium was supplemented with 2.2 mM valproic acid, and expression carried out for 5 d at 37°C and 8% CO 2 . The supernatant was harvested by centrifugation and filtered through a 0.22-μm filter before loading it onto a 5-ml HisTrap excel column (Cytiva). The column was washed with 20 column volumes (CVs) of wash buffer (20 mM Tris [pH 8.0], 500 mM NaCl), followed by 5 CVs of wash buffer supplemented with 20 mM imidazole. The protein was eluted with elution buffer (20 mM Tris [pH 8.0], 500 mM NaCl, 500 mM imidazole). Elution fractions containing the protein were pooled and concentrated (Amicon Ultra 100-kDa cutoff, Millipore Sigma) for gel filtration (GF). GF was conducted using a Superose 6 10/300 GL column (Cytiva) pre-equilibrated with GF buffer (20 mM Tris [pH 8.0], 150 mM NaCl). Peak fractions corresponding to soluble protein were pooled and concentrated to 4.5–5.5 mg/ml (Amicon Ultra 100-kDa cutoff, Millipore Sigma). Protein purity was estimated as >95% by SDS-PAGE, and protein concentration was measured spectrophotometrically (NanoPhotometer N60, Implen).
Show full methods section
Cloning, expression, and purification of recombinant spike protein constructs The wild-type SARS-CoV-2 S HexaPro expression plasmid was a gift from Jason McLellan [ 7 ] and was obtained from Addgene (plasmid #154754; http://n2t.net/addgene:154754 ; RRID: Addgene_154754). The N501Y mutation was introduced by site-directed mutagenesis (Q5 Site-Directed Mutagenesis Kit, New England Biolabs). Successful subcloning and mutation were confirmed by Sanger sequencing (Genewiz). Expi293F cells (Thermo Fisher) were grown in suspension culture using Expi293 Expression Medium (Thermo Fisher) at 37°C and 8% CO 2 . Cells were transiently transfected at a density of 3 × 10 6 cells/ml using linear polyethylenimine (Polysciences). Twenty-four hours following transfection, the medium was supplemented with 2.2 mM valproic acid, and expression carried out for 5 d at 37°C and 8% CO 2 . The supernatant was harvested by centrifugation and filtered through a 0.22-μm filter before loading it onto a 5-ml HisTrap excel column (Cytiva). The column was washed with 20 column volumes (CVs) of wash buffer (20 mM Tris [pH 8.0], 500 mM NaCl), followed by 5 CVs of wash buffer supplemented with 20 mM imidazole. The protein was eluted with elution buffer (20 mM Tris [pH 8.0], 500 mM NaCl, 500 mM imidazole). Elution fractions containing the protein were pooled and concentrated (Amicon Ultra 100-kDa cutoff, Millipore Sigma) for gel filtration (GF). GF was conducted using a Superose 6 10/300 GL column (Cytiva) pre-equilibrated with GF buffer (20 mM Tris [pH 8.0], 150 mM NaCl). Peak fractions corresponding to soluble protein were pooled and concentrated to 4.5–5.5 mg/ml (Amicon Ultra 100-kDa cutoff, Millipore Sigma). Protein purity was estimated as >95% by SDS-PAGE, and protein concentration was measured spectrophotometrically (NanoPhotometer N60, Implen).
Negative stain sample preparation and data collection
For negative stain, purified S protein (0.05 mg/ml) was mixed with soluble ACE2 (0.05 mg/ml) and incubated on ice for 15 min. For the competition experiment, the S protein (0.05 mg/ml) was first incubated on ice with V H ab8 (0.02 mg/ml) for 30 min, followed by addition of ACE2 (0.05 mg/ml) for another 30 min. Grids (copper 200 or 300 mesh coated with continuous ultrathin carbon) were plasma cleaned using an H 2 /O 2 gas mixture for 15 s in a Solarus II Plasma Cleaner (Gatan) or 10 s in a PELCO easiGlow Glow Discharge Cleaning System (Ted Pella). The protein mixtures (4.8 μl) were applied to the grid and allowed to adsorb for 30 s before blotting away excess liquid, followed by a brief wash with Milli-Q H 2 O. Grids were stained by 3 successive applications of 2% (w/v) uranyl formate (20 s, 20 s, 60 s). Negative stain grids were imaged using a 200-kV Glacios (Thermo Fisher Scientific) transmission electron microscope (TEM) equipped with a Falcon3 camera operated in linear mode. Micrographs were collected using EPU at nominal 92,000× magnification (physical pixel size 1.6 Å) over a defocus range of −2.0 μm to −1.0 μm with a total accumulated dose of 40 e – /Å 2 .
Cryo-EM sample preparation and data collection
For cryo-EM, both N501Y and unmutated SARS-CoV-2 spike ectodomain preparations were deposited on grids at a concentration of 2.25 mg/ml. Complexes were prepared by incubating spike ectodomain preparations with either ACE2 (residues 18–615, New England Biolabs), V H ab8, or Fab ab1 at molar ratios of 1:1.25, 1:9, and 1:8 (spike trimer to binding partner), respectively. Incubations were performed for 20 min on ice prior to centrifugation at 14,000 g for 10 min. Grids were plasma cleaned using an H 2 /O 2 gas mixture for 15 s in a Solarus II Plasma Cleaner (Gatan) before 1.8 μl of protein suspension was applied to the surface of the grid. Using a Vitrobot Mark IV (Thermo Fisher Scientific), the sample was applied to either Quantifoil Holey Carbon R1.2/1.3 copper 300 mesh grids (N501Y spike alone and in complex with ACE2) or UltrAuFoil Holey Gold 300 mesh grids (N501Y spike in complex with V H ab8 or Fab ab1) at a chamber temperature of 10°C with a relative humidity level of 100%, and then vitrified in liquid ethane after blotting for 12 s with a blot force of −10. All cryo-EM grids were screened using a 200-kV Glacios (Thermo Fisher Scientific) TEM equipped with a Falcon4 direct electron detector followed by high-resolution data collection on a 300-kV Titan Krios G4 (Thermo Fisher Scientific) TEM equipped with a Falcon4 direct electron detector in electron event registration (EER) mode. Movies were collected at 155,000× magnification (physical pixel size 0.5 Å) over a defocus range of −3 μm to −0.5 μm with a total dose of 40 e – /Å 2 using EPU automated acquisition software (Thermo Fisher).
Image processing
In general, all data processing was performed in cryoSPARC v.2.15 or v.3.0.1 [ 33 ] unless stated otherwise. For negative stain data, motion correction and contrast transfer function (CTF) estimation were performed in RELION v.3.1.1 [ 34 ]. Particles were picked by crYOLO v.1.7.6 [ 35 ] with a general model ( ftp://ftp.gwdg.de/pub/misc/sphire/crYOLO-GENERAL-MODELS/gmodel_phosnet_negstain_20190226.h5 ). After extraction, particles were imported into cryoSPARC and subjected to 2D classification and 3D heterogeneous classification. Final density maps were obtained by 3D homogeneous refinement. For cryo-EM data, motion correction in patch mode (EER upsampling factor 1, EER number of fractions 40), CTF estimation in patch mode, reference-free particle picking, and particle extraction (extraction box size 640, Fourier crop to box size 320) were performed on-the-fly in cryoSPARC. After preprocessing, particles were subjected to 2D classification and 3D heterogeneous classification. The initial consensus maps were obtained by 3D homogeneous refinement. Then particles were re-extracted with box size 800 and then binned to 400. Final 3D refinement was done with per particle CTF estimation and aberration correction. Local refinements with a soft mask covering a single RBD and its bound V H ab8 or ACE2 resulted in improvement of the binding interfaces. C3 symmetry expanded particles were used for local refinement of RBD and its bound Fab ab1. Overall resolution and locally refined resolutions were according to the gold-standard Fourier shell correlation (FSC) [ 36 ].
Model building and refinement
Coordinates of PDB 6WGJ and 7CH5 were used as initial models to build the V H ab8 and Fab ab1, respectively. Individual domains of SARS-CoV-2 HexaPro S trimer (PDB ID 6XKL) were docked into cryo-EM density using UCSF Chimera v.1.15 [ 37 ]. Initial models were first refined against sharpened locally refined maps, followed by iterative rounds of refinement against consensus map in Coot v.0.9.3 [ 38 ] and Phenix v.1.19 [ 39 ]. Glycans were added at N-linked glycosylation sites in Coot. Model validation was performed using MolProbity [ 40 ]. Figures were prepared using UCSF Chimera, UCSF ChimeraX v.1.1.1 [ 41 ], and PyMOL v.2.2 (Schrodinger). Pseudovirus neutralization assay SARS-CoV-2 S N501Y plasmid was obtained from SARS-CoV-2 S plasmid (HDM-IDTSpike-fixK) by site-directed mutagenesis (Q5 Site-Directed Mutagenesis Kit, New England Biolabs). SARS-CoV-2 S and SARS-CoV-2 S N501Y pseudotyped retroviral particles were produced in HEK293T cells as described previously [ 29 ]. Briefly, a lentiviral system was utilized in combination with plasmids encoding the full-length SARS-CoV-2 spike, along with a transfer plasmid encoding luciferase and GFP as a dual reporter gene. Pseudoviruses were harvested 60 h after transfection, filtered with 0.45-μm PES filters, and frozen. For cell-entry and neutralization assays, HEK293T-ACE2 cells were seeded in 96-well plates at 50,000 cells per well. The next day, pseudovirus preparations normalized for viral capsid p24 levels (Lenti-X GoStix Plus) were incubated with dilutions of the indicated antibodies, ACE2-mFc (SinoBiological), or medium alone for 1 h at 37°C prior to addition to cells and incubation for 48 h. Cells were then lysed and luciferase activity assessed using the ONE-Glo EX Luciferase Assay System (Promega) according to the manufacturer’s specifications. Detection of relative luciferase units was carried out using a Varioskan Lux plate reader (Thermo Fisher). Percent neutralization was calculated relative to signals obtained in the presence of virus alone for each experiment. The IC 50 values were calculated using a 4-parameter dose–response (sigmoidal) curve in GraphPad Prism (version 9 for Windows, GraphPad Software). This function provides the 95% confidence interval (95% CI) and standard error of the mean (SEM). Enzyme-linked immunosorbent assay (ELISA) One hundred microliters of wild-type or N501Y SARS-CoV-2 S protein preparation was coated onto 96-well MaxiSorp plates at 2 μg/ml in PBS overnight at 4°C. All washing steps were performed 5 times with PBS + 0.05% Tween 20 (PBS-T). After washing, wells were incubated with blocking buffer (PBS-T + 2% BSA) for 1 h at room temperature. After washing, wells were incubated with dilutions of V H Fc ab8 or ACE2-mFc (SinoBiological) in PBS-T + 0.5% BSA buffer for 1 h at room temperature. After washing, wells were incubated with either Goat Anti-Human IgG (Jackson ImmunoResearch) or Goat Anti-Mouse IgG Fc Secondary Antibody, HRP (Invitrogen) at a 1:8,000 dilution in PBS-T + 0.5% BSA buffer for 1 h at room temperature. After washing, the substrate solution (Pierce 1-Step) was used for color development according to the manufacturer’s specifications. Optical density at 450 nm was read on a Varioskan Lux plate reader (Thermo Fisher Scientific). For ACE2 competition assays, experiments were conducted as described above with amendments. Serial dilutions of V H Fc ab8 were incubated for 30 min at room temperature prior to the addition of 2.5 nM ACE2-mFc (SinoBiological). Wells were then further incubated for 45 min at room temperature. After washing, wells were incubated at a 1:8,000 dilution with Goat Anti-Mouse IgG Fc Secondary Antibody, HRP (Invitrogen) in PBS-T + 0.5% BSA buffer for 1 h at room temperature. After washing, the substrate solution (Pierce 1-Step) was used for color development according to the manufacturer’s specifications. Optical density at 450 nm was read on a Varioskan Lux plate reader (Thermo Fisher Scientific). For all experiments, controls for antibody–BSA interactions were performed. For competition assays, controls for Goat Anti-Mouse IgG Fc Secondary Antibody recognition of V H Fc ab8 were performed. The EC 50 values were calculated using a 4-parameter dose–response (sigmoidal) curve in GraphPad Prism. Biolayer interferometry (BLI) The binding kinetics of SARS-CoV-2 trimers and human ACE2 was analyzed with the biolayer interferometer BLItz (ForteBio). Protein-A biosensors (ForteBio, 18–5010) were coated with ACE2-mFc (40 μg/ml) for 2 min and incubated in DPBS (pH = 7.4) to establish baselines. Concentrations of 100 nM, 200 nM, and 400 nM spike trimers were used for association for 2 min followed by dissociation in DPBS for 5 min. The association ( k on ) and dissociation ( k off ) rates were derived from the sensorgram fitting and used to calculate the binding equilibrium constant (K D ).
Supporting information S1 Fig Purification of N501Y or unmutated (wild-type [wt]) HexaPro ectodomains. (A) Size exclusion chromatography profile of the indicated affinity-purified HexaPro constructs. Fractions pooled for structural and biochemical studies are indicated by gray shading. (B) SDS-PAGE analysis of pooled and concentrated HexaPro constructs. (TIF) Click here for additional data file. S2 Fig Cryo-EM data processing and validation for the N501Y spike protein ectodomains. (A) Representative micrograph. (B) Representative 2D class averages. (C) Cryo-EM data processing workflow. (D) Fourier shell correlation (FSC) between 2 half maps (red) and FSC between the refined map and model (blue). (E) Local resolution estimation. (F) Viewing direction distribution. (TIF) Click here for additional data file. S3 Fig Superposition of the structure of the N501Y spike protein ectodomains (light orange) with the previously published structure of the unmutated construct (blue; PDB ID 6XKL). (TIF) Click here for additional data file. S4 Fig Cryo-EM data processing and validation for the complex between the N501Y spike protein ectodomain and the ACE2 ectodomain. (A) Representative micrograph. (B) Representative 2D class averages. (C) Cryo-EM data processing workflow. (D) Fourier shell correlation (FSC) between 2 half maps (red) and FSC between the refined map and model (blue). (E) Local resolution estimation of the global map. (F) Viewing direction distribution. (G) FSC between 2 half maps of local refinement (red) and FSC between the locally refined map and model (blue). (H) Local resolution estimation of the locally refined map. (TIF) Click here for additional data file. S5 Fig Analysis of ACE2 interactions with N501Y and unmutated spike. (A) Analysis of cell entry of N501Y or unmutated SARS-CoV-2 S pseudotyped viral particles. N501Y or unmutated SARS-CoV-2 S pseudotyped virus was normalized for p24 levels and incubated with HEK293T-ACE2 cells for 48 h prior to cell lysis and luciferase activity quantification. (RLU: relative luminescent units). (B) Analysis of N501Y or unmutated SARS-CoV-2 S pseudotyped virus neutralization by soluble ACE2-mFC. The IC 50 of soluble ACE2-mFC neutralization is 0.066 μg/ml (95% CI 0.026–0.17 μg/ml) for unmutated pseudotyped virus, and 0.0074 μg/ml (95% CI < 0.043 μg/ml; lower bound not accurately determined) for N501Y pseudotyped virus. The IC 50 for wild-type is greater than that for N501Y, as demonstrated by a 1-tailed Welch test ( p = 3 × 10 −5 ). (C and D) Biolayer interferometry analysis of immobilized ACE2 binding by increasing concentrations of either N501Y (A) or unmutated (B) spike ectodomain. Shown is the extent of binding as determined by shift in wavelength (nm: nanometers). Biophysical parameters (K D , k on , k off ) are shown as mean ± standard deviation. (TIF) Click here for additional data file. S6 Fig Negative stain electron microscopy reveals different ACE2 occupancies for unmutated and N501Y spikes. (A and B) Representative micrograph selected from the total dataset for the unmutated (A) or N501Y (B) spike ectodomains in complex with ACE2. The concentrations of spike proteins and soluble ACE2 are the same for both unmutated and N501Y preparations. (C and D) 2D class averages corresponding to (C) the unmutated dataset (1,355 images) and (D) the N501Y dataset (1,125 images), covering the same range of stain thickness. (E and F) Processing workflow. (E) For unmutated spikes, 3D classification reveals an occupancy of 2 or fewer RBDs bound for the 2 most populated initial classes (50% and 34% of all particles from 2D classification). (F) For N501Y spikes, the most populated initial class (63%) has 3 RBDs bound. (G and H) Final refinement of (G) unmutated spikes and (H) N501Y spikes. The density corresponding to bound soluble ACE2 is colored in green. The higher occupancy of ACE2 for N501Y spikes reflects a shift in the equilibrium stoichiometry, consistent with the higher affinity of N501Y spikes for ACE2. (I and J) Competition experiments. Spike ectodomains were first incubated with the V H ab8 antibody fragment, then with soluble ACE2. The density corresponding to bound V H ab8 is colored in red. The V H ab8 antibody fragment competes with ACE2 binding, as demonstrated by the reduced ACE2 occupancy in both (I) the unmutated spike (1 RBD bound) and (J) the N501Y spike (2 RBDs bound). (TIF) Click here for additional data file. S7 Fig Cryo-EM data processing and validation for the complex between the N501Y spike protein ectodomain and VH ab8. (A) Representative micrograph. (B) Representative 2D class averages. (C) Cryo-EM data processing workflow. (D) Fourier shell correlation (FSC) between 2 half maps (red) and FSC between the refined map and model (blue). (E) Local resolution estimation of the global map. (F) Viewing direction distribution. (G) FSC between 2 half maps of local refinement (red) and FSC between the locally refined map and model (blue). (H) Local resolution estimation of the locally refined map. (TIF) Click here for additional data file. S8 Fig Cryo-EM data processing and validation for the complex between the N501Y spike protein ectodomain and Fab ab1. (A) Representative micrograph. (B) Representative 2D class averages. (C) Cryo-EM data processing workflow. (D–I) Fourier shell correlation (FSC) between 2 half maps (red) and between the refined map and model (blue), with local resolution estimation and viewing direction distribution, for class 1 (D–F) and class 2 (G–I). (J) FSC between 2 half maps of local refinement (red) and between the locally refined map and the model (blue). (K) Local resolution estimation of the locally refined map. (TIF) Click here for additional data file.
S1 Table
Biophysical parameters. (DOCX) Click here for additional data file.
S2 Table
Spike protein RBD residues that interact with ACE2 and various antibodies. (DOCX) Click here for additional data file. S1 Raw Images (PDF) Click here for additional data file.
📊 Figures
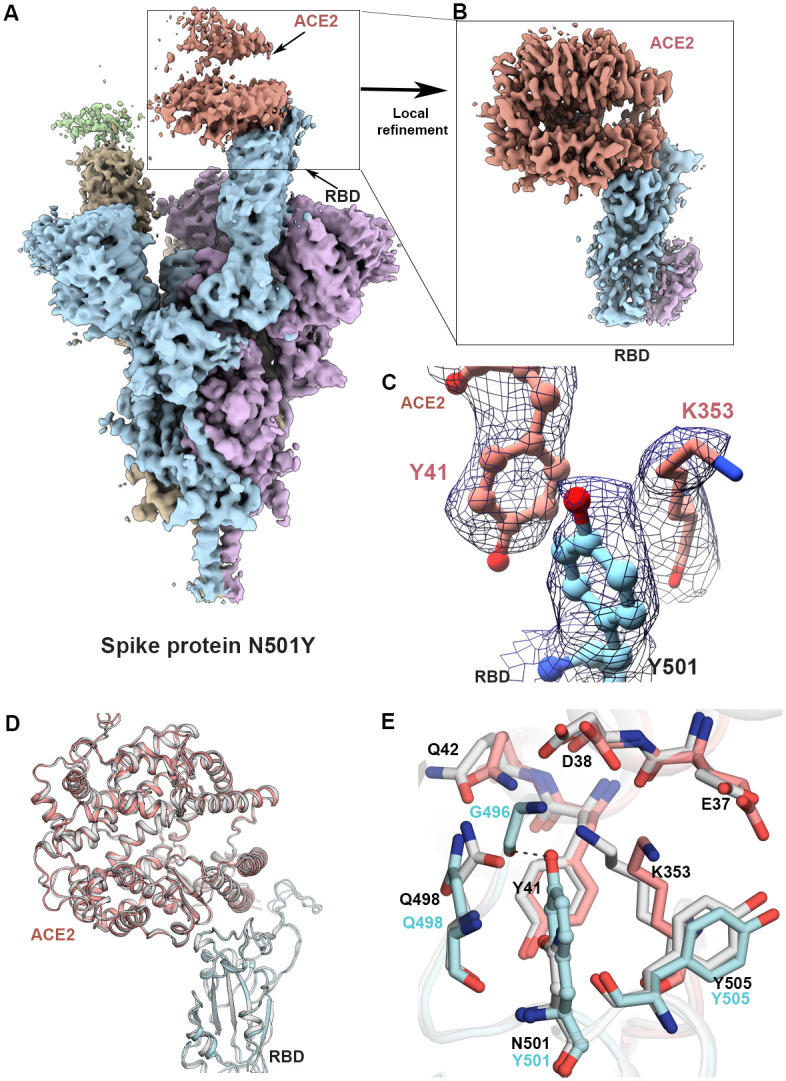
Fig 1
Structure of the SARS-CoV-2 N501Y mutant spike protein ectodomain bound to the ACE2 ectodomain.
(A) Density map for the overall complex at the end of global structure refinement. The 3 spike protein protomers are colored in cyan, purple, and yellow, with the density for the strongly and weakly b...
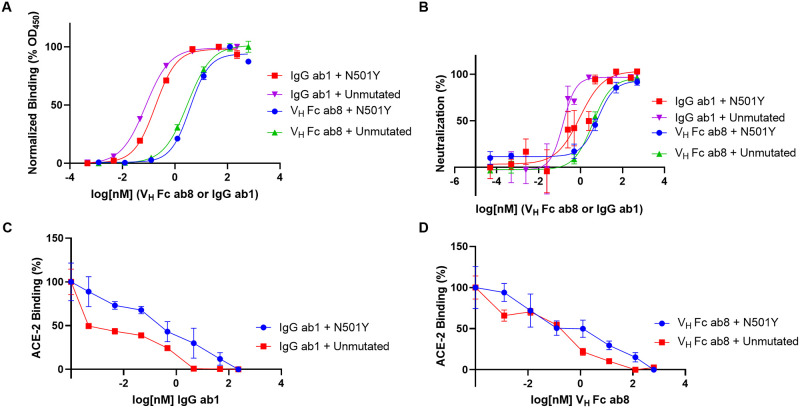
Fig 2
Analysis of V H Fc ab8 and IgG ab1 interactions with N501Y and unmutated spike.
(A) ELISA analysis of antibody interactions with either N501Y or unmutated spike ectodomain. (B) N501Y or unmutated SARS-CoV-2 S pseudotyped virus neutralization by either V H Fc ab8 or IgG ab1. (C an...
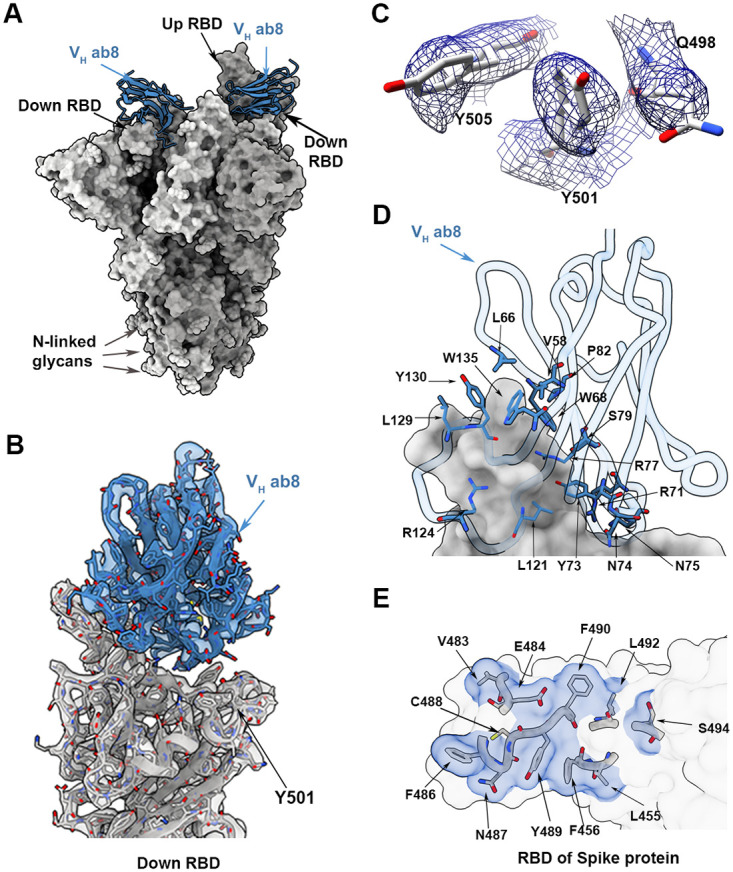
Fig 3
Structure of V H ab8 bound to the N501Y mutant spike protein trimer.
(A) Atomic model for the structure of the complex of V H ab8 (blue) with the N501Y mutant spike protein ectodomain (gray). The structure has 2 receptor binding domains (RBDs) in the down position with...
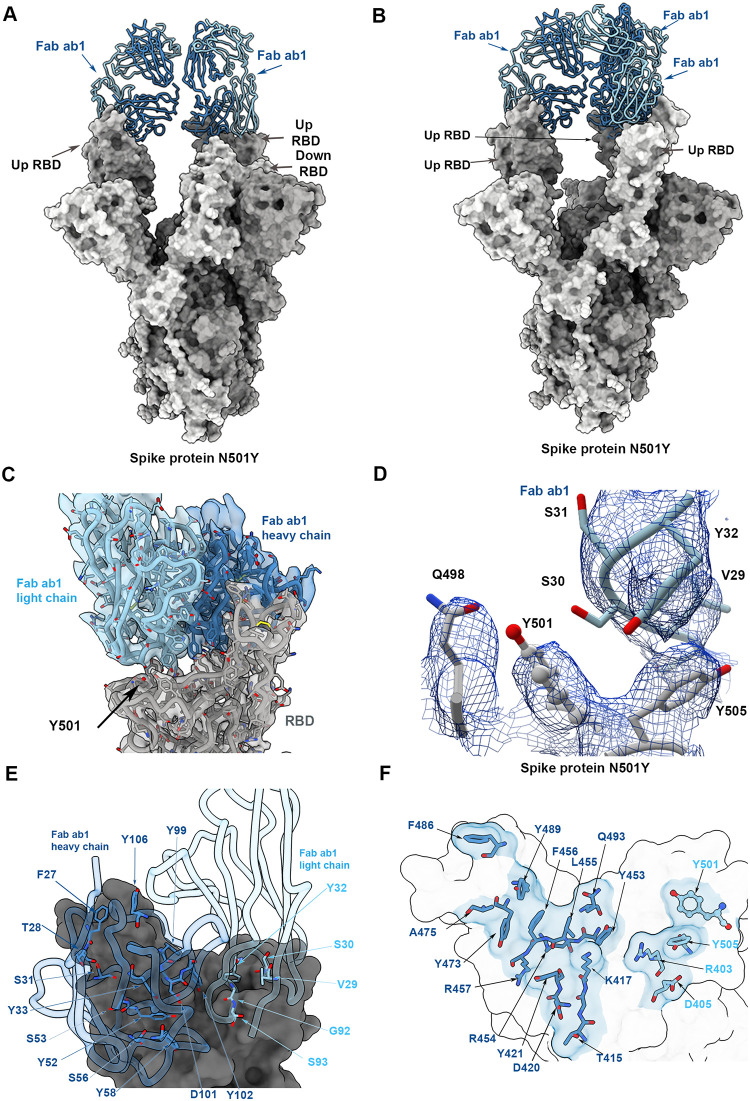
Fig 4
Structure of Fab ab1 bound to the N501Y mutant spike protein trimer.
(A and B) Atomic models for the 2 predominant conformations of the spike protein (gray) observed with Fab ab1 (blue) bound to either 2 (A) or 3 (B) receptor binding domains (RBDs) in the up position. ...
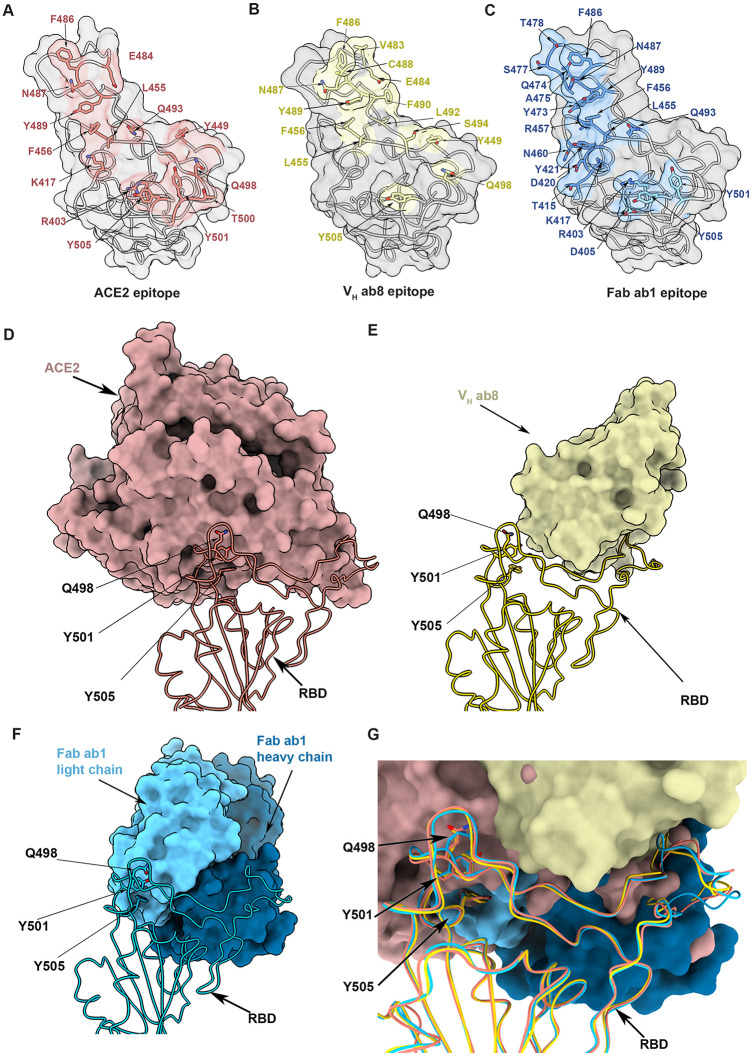
Fig 5
Comparison of the structures of complexes formed by the spike protein ectodomain with the ACE2 ectodomain, V H ab8, and Fab ab1.
(Au2013C) Open-face views of the receptor binding domain (RBD) from the vantage point of ACE2 (A), V H ab8 (B), and Fab ab1 (C), with the residues involved in contact shaded in red, yellow, and blue, ...
Figure images are served from the NIH/NLM PubMed Central Open Access Subset or Europe PMC; copyright remains with the publishers and authors.
💬 Discussion
0 commentsNo comments yet. Be the first to start a discussion!
Leave a Comment