Abstract
AbstractSerotonin receptors (5-HT3AR) directly regulate gut movement, and drugs that inhibit 5-HT3AR function are used to control emetic reflexes associated with gastrointestinal pathologies and cancer therapies. The 5-HT3AR function involves a finely tuned orchestration of three domain movements that include the ligand-binding domain, the pore domain, and the intracellular domain. Here, we present the structure from the full-length 5-HT3AR channel in the apo-state determined by single-particle cryo-electron microscopy at a nominal resolution of 4.3 Å. In this conformation, the ligand-binding domain adopts a conformation reminiscent of the unliganded state with the pore domain captured in a closed conformation. In comparison to the 5-HT3AR crystal structure, the full-length channel in the apo-conformation adopts a more expanded conformation of all the three domains with a characteristic twist that is implicated in gating.
🔬 Techniques
🧬 Organisms
✨ Fluorophores
🧪 Sample Preparation
🏭 Microscope Brands
🧪 Reagent Suppliers
💻 Software Details
💾 Data Repositories
🏛️ Research Organizations (ROR)
Affiliated research institutions:
📋 Methods
5-HT 3A R cloning and electrophysiological measurements in oocytes The gene encoding 5-HT 3A R (purchased from GenScript USA Inc.) was inserted into a Xenopus laevis oocyte expression vector (pTLN) and confirmed by DNA sequencing. This construct was first linearized with Mlu1 restriction enzyme overnight at 37 °C and then used for mRNA synthesis using the mMessage mMachine kit (Ambion). The mRNA was purified with RNAeasy kit (Qiagen) and stored at −20 °C. For measurement of 5-HT 3A R macroscopic currents, Xenopus laevis oocytes (stages V–VI) were injected with 3–10 ng of mRNA. As a control, oocytes were injected with the corresponding volume of water to verify endogenous currents were not present. The oocytes used in this study were kindly provided by Dr. Walter F. Boron. Female X. laevis were purchased from Nasco. All animal experimental procedures were approved by Institutional Animal Care and Use Committee (IACUC) of Case Western Reserve University. Both sets of injected oocytes were maintained at 18 °C in OR3 media (GIBCO BRL Leibovitz media containing glutamate and supplemented with 500 units each of penicillin and streptomycin, pH 7.5. The osmolarity was adjusted to 197 mOsm). After 2–5 days of injection, two electrode voltage-clamp (TEVC) experiments were performed at room temperature on a Warner Instruments Oocyte clamp OC-725. Oocytes were clamped at −60 mV holding potential, and macroscopic current traces were recorded in response to the application of serotonin hydrochloride (at indicated concentrations). The solution-exchange was performed using a syringe-pump perfusion system operating at a flow-rate of 6 ml/min. The current was sampled and digitized at 500 Hz with a Digidata 1332A. The traces were analyzed by Clampfit 10.2 (Molecular Devices). The electrophysiological solutions had the following buffer composition: 96 mM NaCl, 2 mM KCl, 1.8 mM CaCl 2 , 1 mM MgCl 2, and 5 mM HEPES (osmolarity adjusted to 195 mOsm, pH 7.4). All chemical reagents used in these experiments were purchased from Sigma-Aldrich.
Show full methods section
5-HT 3A R cloning and electrophysiological measurements in oocytes The gene encoding 5-HT 3A R (purchased from GenScript USA Inc.) was inserted into a Xenopus laevis oocyte expression vector (pTLN) and confirmed by DNA sequencing. This construct was first linearized with Mlu1 restriction enzyme overnight at 37 °C and then used for mRNA synthesis using the mMessage mMachine kit (Ambion). The mRNA was purified with RNAeasy kit (Qiagen) and stored at −20 °C. For measurement of 5-HT 3A R macroscopic currents, Xenopus laevis oocytes (stages V–VI) were injected with 3–10 ng of mRNA. As a control, oocytes were injected with the corresponding volume of water to verify endogenous currents were not present. The oocytes used in this study were kindly provided by Dr. Walter F. Boron. Female X. laevis were purchased from Nasco. All animal experimental procedures were approved by Institutional Animal Care and Use Committee (IACUC) of Case Western Reserve University. Both sets of injected oocytes were maintained at 18 °C in OR3 media (GIBCO BRL Leibovitz media containing glutamate and supplemented with 500 units each of penicillin and streptomycin, pH 7.5. The osmolarity was adjusted to 197 mOsm). After 2–5 days of injection, two electrode voltage-clamp (TEVC) experiments were performed at room temperature on a Warner Instruments Oocyte clamp OC-725. Oocytes were clamped at −60 mV holding potential, and macroscopic current traces were recorded in response to the application of serotonin hydrochloride (at indicated concentrations). The solution-exchange was performed using a syringe-pump perfusion system operating at a flow-rate of 6 ml/min. The current was sampled and digitized at 500 Hz with a Digidata 1332A. The traces were analyzed by Clampfit 10.2 (Molecular Devices). The electrophysiological solutions had the following buffer composition: 96 mM NaCl, 2 mM KCl, 1.8 mM CaCl 2 , 1 mM MgCl 2, and 5 mM HEPES (osmolarity adjusted to 195 mOsm, pH 7.4). All chemical reagents used in these experiments were purchased from Sigma-Aldrich.
Cloning and transfection
Codon-optimized mouse 5-HT 3A R gene (NCBI Reference Sequence: NM_001099644.1 ) was purchased from GenScript USA Inc. Subsequently, it was subcloned into pFastBac1 vector containing four Strep-tags (WSHPQFEK) at the N-terminus, followed by a linker sequence (GGGSGGGSGGGS) and a TEV-cleavage sequence (ENLYFQG). The construct also includes a C-terminal 1D4-tag 47 . S. frugiperda (Sf9) cells (purchased from Expression System) were cultured in ESF921 medium (Expression System) and incubated at 28 °C without CO 2 exchange. The culture media did not contain antibiotics. Sub-confluent cells were then transfected with recombinant 5-HT 3A R bacmid DNA using Cellfectin II transfection reagent (Invitrogen) using manufacturer recommended instructions. At 72 h post-transfection, the cell-culture supernatant was collected and centrifuged at 1000× g for 5 min to remove cell debris and harvest progeny 1 (P1) recombinant baculovirus. The P2 virus was obtained through a consecutive round of Sf9 cells infection with the P1 virus stock. The supernatant containing P2 virus was then used to infect Sf9 cells, thus generating P3 virus. The level of protein expression was checked by western blot using both P2 and P3 viruses. The P3 virus was used for recombinant protein production and analysis.
Expression and purification of recombinant protein
The recombinant 5-HT 3A R protein production was carried out by infection of approximately 2.5 × 10 6 /ml Sf9 cells with P3 virus. The cells were harvested at 72 h post-infection and centrifuged at 8000× g for 20 min at 4 °C to separate the supernatant from the cell pellet. The cells were then re-suspended in a buffer containing 20 mM Tris-HCl and 36.5 mM sucrose at pH 7.5 and supplemented with 1% protease inhibitor cocktail (Sigma-Aldrich). The cells were disrupted by sonication on ice and the non-lysed cells were removed by centrifugation (3000× g for 15 min). The membrane fraction was separated by ultracentrifugation (167,000× g for 1 h) and solubilized with 1% C 12 E 9 (Anatrace) in a buffer containing 500 mM NaCl, 50 mM Tris pH 7.4, 10% glycerol, and 0.5% protease inhibitor by rotating for 2 h at 4 °C. Non-solubilized material was removed by ultracentrifugation (167,000× g and 15 min). The supernatant was collected and bound with 1D4 beads equilibrated with 150 mM NaCl, 20 mM HEPES pH 8.0, and 0.01% C 12 E 9 for 2 h at 4 °C. The beads were then washed with 100 column volumes of 150 mM NaCl, 20 mM Hepes pH 8.0, and 0.01% C 12 E 9 (Buffer A). The protein was then eluted with Buffer A supplemented with 3 mg/ml 1D4 peptide (NH 2 -TETSQVAPA-CO 2 H). Eluted protein was then concentrated and deglycosylated with PNGase F (NEB) by incubating 5 units of the enzyme per 1 μg of the protein for 2 h at 37 °C under gentle agitation. Deglycosylated protein was then applied to a Superose 6 column (GE healthcare) equilibrated with Buffer A. The peak fractions around 13.9 ml were pooled and concentrated to 2–3 mg/ml using 50 kDa MWCO Millipore filters (Amicon) and used subsequently for cryo-EM studies.
Sample preparation and cryo-EM data acquisition The 5-HT 3A
R protein (~2.5 mg/ml) was filtered and incubated with 3 mM Fluorinated Fos-choline 8 (Anatrace) to improve particle distribution 48 . The sample was double blotted (3.5 µl per blot) onto Cu 300 mesh Quantifoil 1.2/1.3 grids (Quantifoil Micro Tools), and immediately after the second blot, the grid was plunge frozen using a Vitrobot (FEI). The grids were imaged on a Titan Krios microscope (FEI), operating at 300 kV, and equipped with a K2-Summit direct detector camera (Gatan). 40-frame movies were collected at 130,000× magnification (set on microscope) in super-resolution mode with a physical pixel size of 0.532 Å/pixel. The dose rate was 4 electrons/pixel/second, with a total exposure time of 12 s. The defocus values ranged from −0.75 µm to −2.5 µm (input range setting for data collection) as per the automated imaging software 49 .
Image processing
Movies were motion-corrected to compensate for the beam-induced motion using MotionCor2 50 with a B-factor of 150 pixels 2 . Super-resolution counting images were 2 × 2 binned in Fourier space with a pixel size of 1.064 Å. All subsequent data processing was performed using RELION 2.03 51 . The defocus values of the motion-corrected micrographs were estimated using Gctf software 52 . Approximately, 2000 particles were manually picked from the 3550 micrographs and sorted into two-dimensional (2D) classes. The best of these classes were then used as templates for auto-picking. A loose auto-picking threshold was selected to ensure no good particles were missed. This resulted in ~327,000 auto-picked particles that were subjected to multiple rounds of 2D classification to remove suboptimal particles. An initial three-dimensional (3D) model was generated from 5-HT 3A R crystal structure (PDB code: 4PIR) and low-pass filtered to 60 Å using EMAN2 53 .The best ~117,000 particles were then subjected to 3D auto-refinement, followed by 3D classification into three classes. The best 3D class, containing ~108,000 particles, was subjected to a final round of 3D auto-refinement and post-processing to yield a 5-HT 3A R map at an overall resolution of 4.3 Å (calculated based on the gold-standard Fourier shell coefficient (FSC) = 0.143 criterion). In the RELION post-processing step, a soft mask was applied to the two half-maps before the FSC was calculated. The post-processing step also included B-factor estimation and map sharpening. ResMap software 54 was used for estimation of local resolutions. 5-HT 3A R model building The 5-HT 3A R crystal structure (PDB-ID: 4PIR) 16 was used as an initial model and aligned to the 5-HT 3A R cryo-EM map calculated with RELION 2.03. The cryo-EM map was converted to an .mtz format using mapmask and sfall tools in CCP4i software 55 . The mtz map was then used for model building in COOT 56 . In comparison to the 5-HT 3A R crystal structure, for each monomer, 15 additional residues were built in our model and sidechains were built for seven additional residues. After initial model building, the model was refined against the EM-derived maps using the phenix.real_space_refinement tool from the PHENIX software package 57 , employing rigid body, local grid, NCS, and gradient minimization. This model was then subjected to additional rounds of manual model-fitting and refinement which resulted in a final model-to-map cross-correlation coefficient of 0.774. Stereochemical properties of the model were evaluated by Molprobity 58 . Protein surface area and interfaces were analyzed by using PDBePISA server ( http://www.ebi.ac.uk/pdbe/pisa/ ). To compare apo-5-HT 3A R and the 5-HT 3A R crystal structure, all ligands, ions, water molecules, and nanobodies (in the crystal structure) were removed from the PDB files. Additional residues in the apo-5-HT 3A R structure were also removed before analysis so that surface area comparisons were made between identical construct lengths. Electrostatic surface potential calculations were carried out using the APBS tools plug-in PyMOL 59 . The pore profile was calculated using the HOLE program 60 .
Data availability
The coordinates of the 5-HT 3A R structure and the cryo-EM map have been deposited under PDB ID 6BE1 and EMD-7088 with the wwPDB and EMDB. Data supporting the findings of this manuscript are available from the corresponding author upon reasonable request.
Electronic supplementary material Supplementary Information Peer Review File
📊 Figures
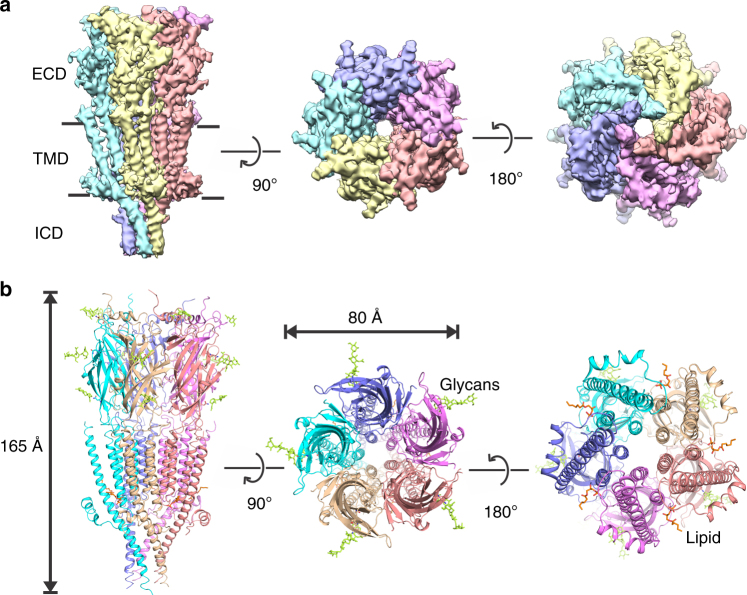
Fig. 1
Cryo-EM structure of apo-5-HT 3A R. a The 3D reconstruction map from the full-length 5-HT 3A R at 4.3u2009u00c5 resolution. The views, going from left to right, are parallel to the membrane (side view...
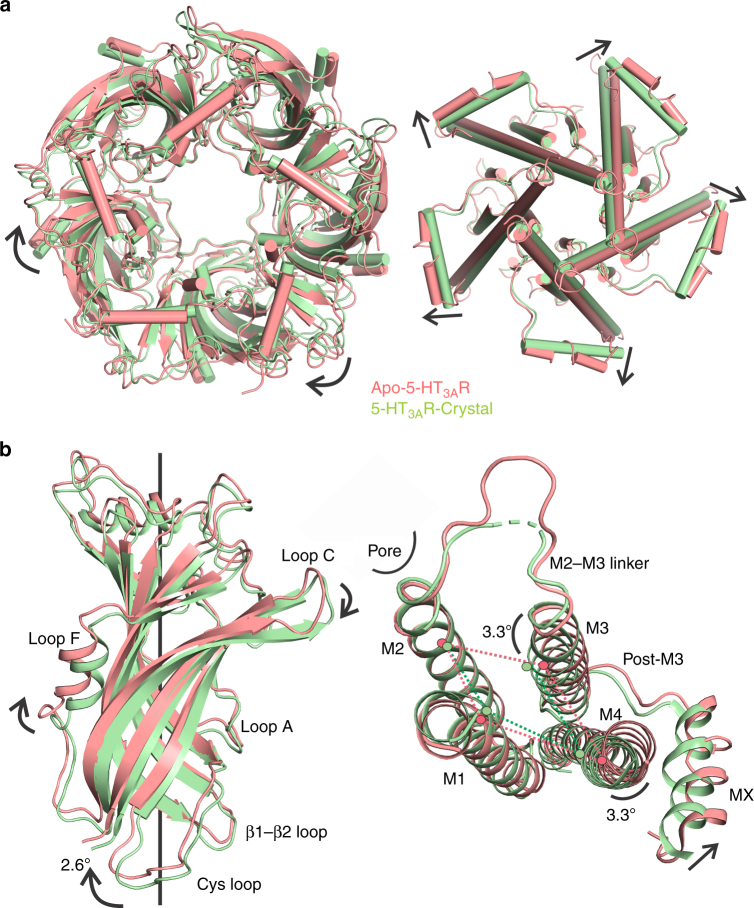
Fig. 2
Alignment of the apo-5-HT 3A R with the crystal structure of nanobody-bound 5-HT 3A R. a A view of the ECDs from the extracellular end when aligned with respect to the TMDs (left). The view of the TMD...
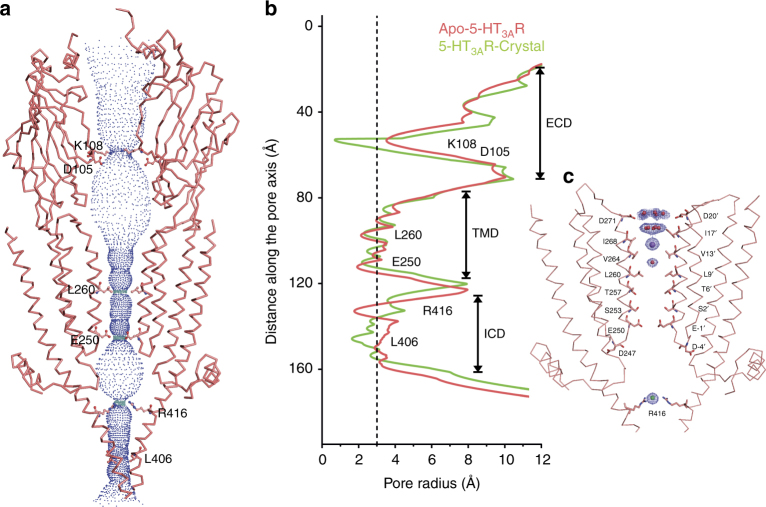
Fig. 3
Profile of ion permeation pathway. a The pore profile generated by the HOLE program 60 depicts an ion permeation pathway of ~165u2009u00c5 encompassing the ECD, TMD, and the ICD. Only two subunits are...
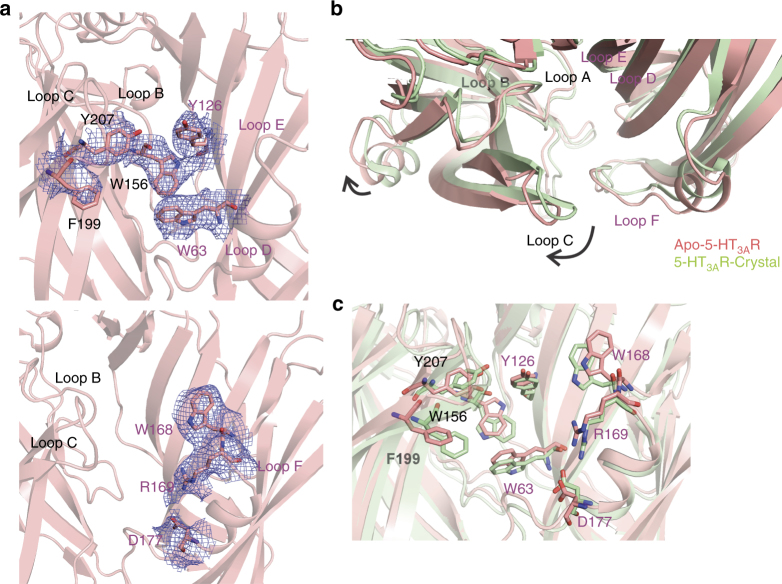
Fig. 4
The neurotransmitter binding site. a The map around the aromatic residues at the subunit interface that constitutes the neurotransmitter binding site (top). The map for the residues in Loop F that are...
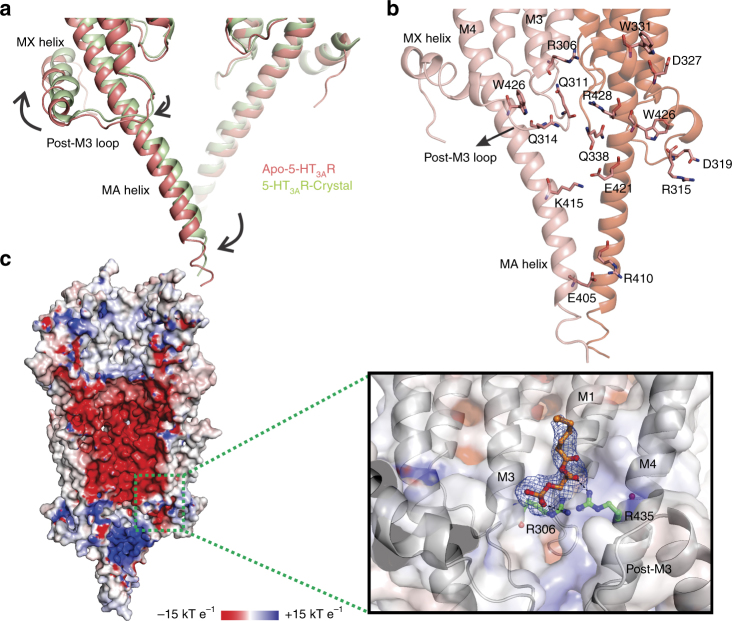
Fig. 5
The Intracellular domain. a The ICD is comprised of the post-M3 loop, the MX, helix, a stretch of unstructured region, followed by the MA helix. The density from the MX helix is bent downward to the i...
Figure images are served from the NIH/NLM PubMed Central Open Access Subset or Europe PMC; copyright remains with the publishers and authors.
💬 Discussion
0 commentsNo comments yet. Be the first to start a discussion!
Leave a Comment