Abstract
KATP channels are metabolic sensors that couple cell energetics to membrane excitability. In pancreatic β-cells, channels formed by SUR1 and Kir6.2 regulate insulin secretion and are the targets of antidiabetic sulfonylureas. Here, we used cryo-EM to elucidate structural basis of channel assembly and gating. The structure, determined in the presence of ATP and the sulfonylurea glibenclamide, at ~6 Å resolution reveals a closed Kir6.2 tetrameric core with four peripheral SUR1s each anchored to a Kir6.2 by its N-terminal transmembrane domain (TMD0). Intricate interactions between TMD0, the loop following TMD0, and Kir6.2 near the proposed PIP2 binding site, and where ATP density is observed, suggest SUR1 may contribute to ATP and PIP2 binding to enhance Kir6.2 sensitivity to both. The SUR1-ABC core is found in an unusual inward-facing conformation whereby the two nucleotide binding domains are misaligned along a two-fold symmetry axis, revealing a possible mechanism by which glibenclamide inhibits channel activity.
🔬 Techniques
🔭 Microscopes
🧬 Organisms
💻 Software
✨ Fluorophores
🧪 Sample Preparation
🔬 Cell Lines
🏭 Microscope Brands
🧪 Reagent Suppliers
📷 Detectors
💻 Software Details
📋 Protocols
💾 Data Repositories
🏷️ Research Resource Identifiers (RRIDs)
Verified research resources used in this paper:
🏛️ Research Organizations (ROR)
Affiliated research institutions:
📋 Methods
Construction of recombinant adenoviruses
Construction of the hamster SUR1 (94.5% protein sequence identity with human SUR1) with an N-terminal FLAG-tag (f-SUR1) and rat Kir6.2 (96.15% protein sequence identity with human Kir6.2) recombinant adenoviruses was as described previously ( Lin et al., 2005 ; Pratt et al., 2009 ). A FLAG tag (DYKDDDDK) was engineered at the N-terminus of SUR1 for affinity purification of the channel complex. In brief, the gene encoding the rat Kir6.2 was cloned into pShuttle, and recombined with the pAdEasy vector in the BJ5183 strain of Escherichia Coli . Positive recombinants were selected, and pAdEasy plasmids containing the correct insert were used to transfect HEK293 cells (RRID: CVCL_0045 ) for virus production. The SUR1 recombinant adenovirus was constructed using a modified pShuttle plasmid (AdEasy kit, Stratagene, San Diego, CA) containing a tetracycline-inducible promoter. Recombinant viruses were amplified in HEK293 cells and purified according to the manufacturer's instructions.
K ATP channel expression and purification
INS-1 cells clone 832/13 (RRID: CVCL_7226 ) (from Dr. Christopher Newgard) ( Hohmeier et al., 2000 ) were plated in 15 cm plates and cultured for 24 hr in RPMI 1640 with 11.1 mM D-glucose (Invitrogen, Carsbad, CA) supplemented with 10% fetal bovine serum, 100 units/ml penicillin, 100 μg/ml streptomycin, 10 mM HEPES, 2 mM glutamine, 1 mM sodium pyruvate, and 50 μM β-mercaptoethanol. For channel expression, cells were co-infected with three recombinant adenoviruses, one encoding Kir6.2, one f-SUR1, and one encoding tetracycline-inhibited transactivator (tTA) for the tTA-regulated f-SUR1 expression ( Pratt et al., 2009 ). Cells at ∼70% confluent density were washed once with phosphate-buffered saline (PBS) and then incubated for 3 hr at 37°C in OPTI-MEM without serum and a mixture of viruses with the multiplicity of infection (M.O.I.) of each virus determined empirically to optimize the maturation efficiency of the channel complex as judged by the abundance of the SUR1 and Kir6.2 bands as well as the ratio of the mature complex glycosylated versus the immature core-glycosylated SUR1 bands. Medium was then replaced with fresh growth medium plus 1 mM sodium butyrate and 1 µM glibenclamide (GBC) to enhance expression and maturation ( Yan et al., 2004 ), and the cells were further incubated at 37°C for 36–48 hr. Cells were harvested in PBS, pelleted, flash frozen in liquid nitrogen, and stored at −80°C until purification. For channel purification, cells were resuspended in hypotonic buffer (15 mM KCl, 10 mM HEPES, 1.5 mM MgCl 2 ) and allowed to swell for 20 min on ice. Cells were then lysed with a tight-fitting Dounce homogenizer, then centrifuged at 20,000 x g for 60 min. Membranes were resuspended in buffer A (150 mM NaCl, 25 mM HEPES, 50 mM KCl, 1 mM ATP, 1 µM GBC, 4% Trehalose) with protease inhibitors (cocktail tablets from Roche) and then solubilized with 0.5% Digitonin for 90 min. Solubilized membranes were separated from insoluble materials by centrifugation (100,000 x g for 30 min at 4°C) and then incubated with anti-FLAG M2 affinity agarose gel for 4–5 hr. The protein-bound agarose gel was washed with five column volumes of buffer B (150 mM NaCl, 25 mM HEPES, 50 mM KCl, 1 mM ATP, 1 µM GBC, 0.05% Digitonin) and bound proteins eluted in the same buffer with FLAG peptide. Eluted proteins were concentrated using a centricon filter (100 kD cutoff) to a final concentration of ~0.7–1 mg/ml. Purified proteins were further fractionated by size exclusion chromatography using a Suprose six column and fractions analyzed by blue native gel electrophoresis and SDS-PAGE ( Figure 1A,B ).
Show full methods section
Construction of recombinant adenoviruses
Construction of the hamster SUR1 (94.5% protein sequence identity with human SUR1) with an N-terminal FLAG-tag (f-SUR1) and rat Kir6.2 (96.15% protein sequence identity with human Kir6.2) recombinant adenoviruses was as described previously ( Lin et al., 2005 ; Pratt et al., 2009 ). A FLAG tag (DYKDDDDK) was engineered at the N-terminus of SUR1 for affinity purification of the channel complex. In brief, the gene encoding the rat Kir6.2 was cloned into pShuttle, and recombined with the pAdEasy vector in the BJ5183 strain of Escherichia Coli . Positive recombinants were selected, and pAdEasy plasmids containing the correct insert were used to transfect HEK293 cells (RRID: CVCL_0045 ) for virus production. The SUR1 recombinant adenovirus was constructed using a modified pShuttle plasmid (AdEasy kit, Stratagene, San Diego, CA) containing a tetracycline-inducible promoter. Recombinant viruses were amplified in HEK293 cells and purified according to the manufacturer's instructions.
K ATP channel expression and purification
INS-1 cells clone 832/13 (RRID: CVCL_7226 ) (from Dr. Christopher Newgard) ( Hohmeier et al., 2000 ) were plated in 15 cm plates and cultured for 24 hr in RPMI 1640 with 11.1 mM D-glucose (Invitrogen, Carsbad, CA) supplemented with 10% fetal bovine serum, 100 units/ml penicillin, 100 μg/ml streptomycin, 10 mM HEPES, 2 mM glutamine, 1 mM sodium pyruvate, and 50 μM β-mercaptoethanol. For channel expression, cells were co-infected with three recombinant adenoviruses, one encoding Kir6.2, one f-SUR1, and one encoding tetracycline-inhibited transactivator (tTA) for the tTA-regulated f-SUR1 expression ( Pratt et al., 2009 ). Cells at ∼70% confluent density were washed once with phosphate-buffered saline (PBS) and then incubated for 3 hr at 37°C in OPTI-MEM without serum and a mixture of viruses with the multiplicity of infection (M.O.I.) of each virus determined empirically to optimize the maturation efficiency of the channel complex as judged by the abundance of the SUR1 and Kir6.2 bands as well as the ratio of the mature complex glycosylated versus the immature core-glycosylated SUR1 bands. Medium was then replaced with fresh growth medium plus 1 mM sodium butyrate and 1 µM glibenclamide (GBC) to enhance expression and maturation ( Yan et al., 2004 ), and the cells were further incubated at 37°C for 36–48 hr. Cells were harvested in PBS, pelleted, flash frozen in liquid nitrogen, and stored at −80°C until purification. For channel purification, cells were resuspended in hypotonic buffer (15 mM KCl, 10 mM HEPES, 1.5 mM MgCl 2 ) and allowed to swell for 20 min on ice. Cells were then lysed with a tight-fitting Dounce homogenizer, then centrifuged at 20,000 x g for 60 min. Membranes were resuspended in buffer A (150 mM NaCl, 25 mM HEPES, 50 mM KCl, 1 mM ATP, 1 µM GBC, 4% Trehalose) with protease inhibitors (cocktail tablets from Roche) and then solubilized with 0.5% Digitonin for 90 min. Solubilized membranes were separated from insoluble materials by centrifugation (100,000 x g for 30 min at 4°C) and then incubated with anti-FLAG M2 affinity agarose gel for 4–5 hr. The protein-bound agarose gel was washed with five column volumes of buffer B (150 mM NaCl, 25 mM HEPES, 50 mM KCl, 1 mM ATP, 1 µM GBC, 0.05% Digitonin) and bound proteins eluted in the same buffer with FLAG peptide. Eluted proteins were concentrated using a centricon filter (100 kD cutoff) to a final concentration of ~0.7–1 mg/ml. Purified proteins were further fractionated by size exclusion chromatography using a Suprose six column and fractions analyzed by blue native gel electrophoresis and SDS-PAGE ( Figure 1A,B ).
Sample preparation and data acquisition for cryo-EM analysis
Digitonin solubilized K ATP complexes (in the presence of 1 mM ATP and 1 µM GBC) were first examined by negative-staining EM (1% w/v uranyl acetate, on continuous thin-carbon coated grids) to confirm the integrity of the full complex ( Figure 1C ). For cryo-EM imaging, due to low particle distribution with holey-carbon grids, we experimented with two types of grids: UltrAufoil gold grids and C-flat grids coated in-house with 5 nm of gold on each side, and used both in the final data collection. The grids were first glow-discharged by EasyGlow at 20 mA for 45 s, then 3 µl of purified K ATP complex was loaded onto the grid, blotted (2–4 s blotting time, force −4, and 100% humidity) and cryo-plunged into liquid ethane cooled by liquid nitrogen using a Vitrobot Mark III (FEI, Hillsboro, OR). Single-particle cryo-EM data weres collected on a Titan Krios 300 kV cryo-electron microscope (FEI) in the Multi-Scale Microscopy Core at Oregon Health and Science University, assisted by the automated acquisition program SerialEM. Images were recorded on the Gatan K2 Summit direct electron detector in the counting mode at the nominal magnification 81,000 x (calibrated image pixel-size 1.720 Å), with varying defocus ranging between 1.2 and 3.5 µm across the dataset ( Figure 1D ). To contain the beam radiation damage and reduce electron coincidence loss in the K2 counting-mode recording, the dose rate was kept around 2.0 e - /Å 2 /s, frame rate at 2 frames/s and 40 frames in each movie, which gave the total dose of approximately 40 e - /Å 2 . In total, 4339 movies were recorded, from which ~35,000 particles were used in final reconstructions ( Figure 1—figure supplements 1 and 2 ).
Image processing
The raw frame stacks were gain-normalized and then aligned and dose-compensated using Unblur ( Grant and Grigorieff, 2015 ) ( Table 1 ). CTF was estimated from the aligned frame sums using CTFFIND4 ( Rohou and Grigorieff, 2015 ). To reduce the possibility of bias and capture every possible particle view, an initial set of 350,000 potential particles (referred to as ‘peaks’ in Figure 1—figure supplement 1 ) were picked using DoGPicker ( Voss et al., 2009 ) with a broad threshold range for subsequent 2D classification using RELION ( Scheres, 2012 ). 2D classification was able to remove the large number of false positives and aggregates, and resulted in ~35,000 particles with 2D classes in which secondary structure was already apparent ( Figure 1E ). These class averages revealed that the side views also adopted a preferred orientation. Upon imposing C4 symmetry, the angular sampling space was filled in along three orthogonal axes ( Figure 1—figure supplement 2A ), which greatly improved the quality of the 3D reconstruction. The final rounds of refinement with C4 symmetry revealed two 3D classes ( Figure 1—figure supplement 1 ). The dominant class (EMDB ID: EMD-8470), derived from 20,707 particles had an overall resolution of ~6.7 Å, and application of a mask improved the resolution of the overall structure to 5.8 Å and the central Kir6.2 domain to 5.1 Å ( Figure 1—figure supplement 2B ). The second class, derived from 14,115 particles, had an overall unmasked resolution of ~7.6 Å, and masking improved the resolution of the overall structure to 7.2 Å and for the central Kir6.2 domain to 6.9 Å ( Figure 1—figure supplement 2C ). All resolutions were reported using the 0.143 criterion with gold-standard FSC and phase-randomization correction for the use of masks ( Chen et al., 2013b ). Resolution was further confirmed using local-resolution as measured using ResMap ( Kucukelbir et al., 2014 ), and by observing criterion such as helical pitch starting to become visible, and density bumps for some of the larger side chains (see examples shown in Figure 3B ). Maps were B-factor corrected during post-processing using the K2 MTF, and the fitting procedure described by Rosenthal and Henderson ( Rosenthal and Henderson, 2003 ). The two 3D classes differ in the cytoplasmic domain of Kir6.2 where a rotation of ~14° relative to each other was observed ( Figure 1—figure supplement 2F ). Model building Local resolution measurements using ResMap and masked FSCs showed that some parts of the complex including Kir6.2 and TMDs of SUR1 had significantly better resolution, in the 5 Å range, than the overall resolution of 5.8 Å, while other parts such as the NBDs of SUR1 had worse resolution, estimated to be in the 8 Å range. Moreover, some parts of the channel complex, such as the TMD0 and L0 of SUR1 do not have existing homology models. Therefore, different strategies were used to model the channel complex, as detailed below. For Kir6.2, a homology model was built from Kir3.2 (PDB ID: 3SYA) using MODELLER ( Webb and Sali, 2016 ) and served as the initial model. The model was docked into the density in UCSF Chimera ( Pettersen et al., 2004 ); the fit was improved by rigid body refinement of domains in RSRef ( Chapman et al., 2013 ), followed by iterative rounds of real-space refinement in COOT ( Emsley et al., 2010 ) and stereochemically restrained torsion angle refinement in CNS ( Brünger et al., 1998 ), substituting in the RSRef real-space target function ( Chapman et al., 2013 ), adding (φ,ψ) backbone torsion angle restraints, and imposing non-crystallographic symmetry (NCS) constraints. The final model contained residues 32–356 ( Figure 2—figure supplement 1 ). The distal N- and C-termini of Kir6.2, although interesting regions implicated in channel assembly and gating ( Devaraneni et al., 2015 ; Enkvetchakul et al., 2000 ; Zerangue et al., 1999 ), lacked strong density. Therefore, they were not included in the model. For the SUR1 core structure, the sequence was divided into three segments: TMD1, NBD1, and TMD2-NBD2. A TMD1 homology model was built using PCAT-1 (PDB ID: 4RY2) ( Figure 2—figure supplement 2 ), NDB1 was modeled from the NDB1 of mouse P-glycoprotein (PDB ID: 4 M1M) ( Figure 2—figure supplement 3 ), and TMD2 and NBD2 were modeled together from chain B of TM287/288 (PDB ID: 4Q4HB) ( Figure 2—figure supplement 4 ); all homology models were built with MODELLER. These models were docked into the density in Chimera. SUR1 had some disordered regions (744–770, 928–1000, 1319–1343), particularly in the linkers between TMDs and NBDs, and in NBD1, that were not seen in our map. These regions were removed from the homology models before proceeding with refinement. The TM helices were then manually adjusted in COOT, as a substantial adjustment was needed to move them into density. The domains were then refined in the same steps as outlined for Kir6.2, except that before the final manual adjustments in COOT and final density gradient optimization, a batch of torsion angle simulated annealing optimization was inserted, again using RSRef/CNS and the same torsion angle restraints and NCS constraints. The final model for the ABC core structure contained residues 284–616 (TMD1), 675–739 and 762–930 (NBD1), 981–1044 and 1060–1321 (TMD2), and 1325–1577 (NBD2). TMD0 and L0 domains of SUR1 (a.a. 1–283) are some of the most interesting and novel regions of the K ATP complex for which there is no existing homology model. These domains were therefore modeled de novo. Even though embedded in a micelle, all the transmembrane helices in TMD0 are clearly visible in the density map. The visibility of helical pitch and some side chains allowed confident modeling and refinement of the TM helices. With the predominantly alpha-helical nature of this domain, continuous loop density between most of the TM helices, and the presence of residues with bulky side chains, we were able to build the ~200 residues of TMD0 with a good degree of confidence. Of less certainty was the L0 region of SUR1 that sits between TMD0 and TMD1. While there was an easily identifiable region of the map corresponding to L0, the scarcity of secondary structures in this region made it difficult to build with the same degree of confidence. This was further complicated by the high likelihood that some of the observed density may be attributable to the ligand GBC, a high affinity antagonist which has been shown to interact with this region ( Bryan et al., 2004 ). Nonetheless, we made a best effort to model the residues in L0 primarily to verify that (1) a plausible model could be built into this density, and (2) that the observed density was sufficient to account for all the amino acids in this loop. The L0 model we built fulfilled both criteria, and as such, allowed for a better interpretation and understanding of the electron density map. We did not, however, attempt to draw any definitive conclusions about specific residues or GBC density from our tentative modeling of L0. Note we used two different software suites, RSRef and PHENIX ( Adams et al., 2010 ), to confirm the consistency of our individual models of Kir6.2 and the SUR1 ABC core structure upon refinement into our electron density. The full final models were refined with all the constraints available in PHENIX real-space refinement: torsion angles, bond lengths, Ramachandran, and secondary structure. This was done initially with side-chains in place to ensure that the refinement did not place residues in implausible configurations ( Figure 3B shows examples of residues that were particularly well-resolved and served as anchor points for building and refining the model). Evaluation of these refined models confirmed that the model could be refined to fit the density quite well while maintaining good stereochemical statistics ( Table 1 ). However, as many of the side chains did not have much, if any, supporting density, a final pass was made throughout the entire model to remove these side-chains prior to PDB deposition (PDB ID: 5TWV). The resulting model was very similar to the full-atom refinement, but had better statistics ( Table 1 ) primarily due to the reduced possibility of clashes.
📊 Figures
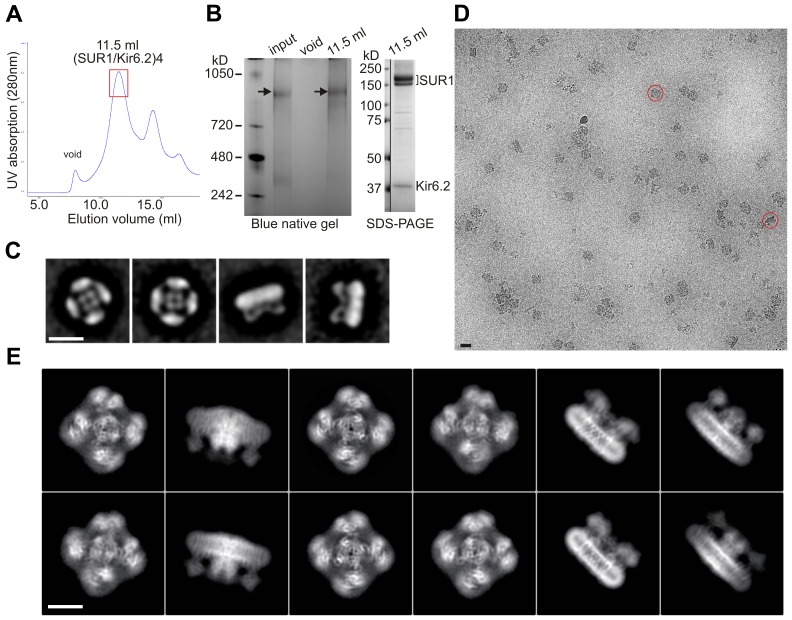
Figure 1.
Purification and single-particle EM imaging of the SUR1/Kir6.2 K ATP channel.
( A ) Size exclusion chromatography (SEC) profile of affinity purified K ATP channels on a Suprose 6 column showing peak elution atu00a0~11.5 ml (the red rectangle). ( B ) Left : Blue native gel showi...
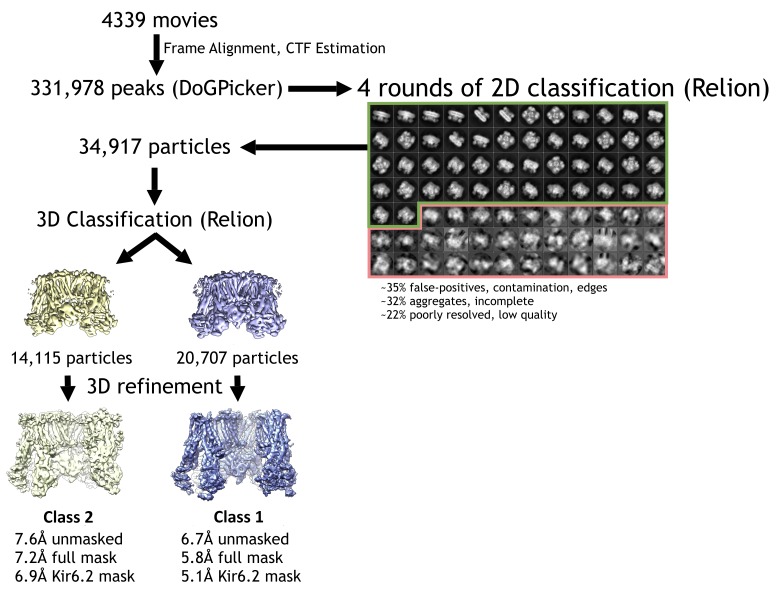
Figure 1u2014figure supplement 1.
Cryo-EM data processing flowchart.
DOI: http://dx.doi.org/10.7554/eLife.24149.004
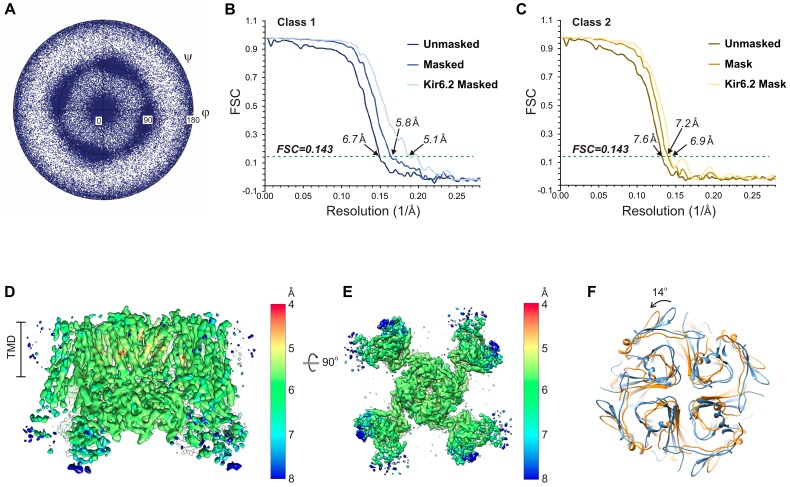
Figure 1u2014figure supplement 2.
Cryo-EM density map analysis.
( A ) Euler angle distribution plot of all particles included in the calculation of the final map. ( B and C ) Fourier shell coefficient (FSC) curves of unmasked and masked whole complex, as well as m...
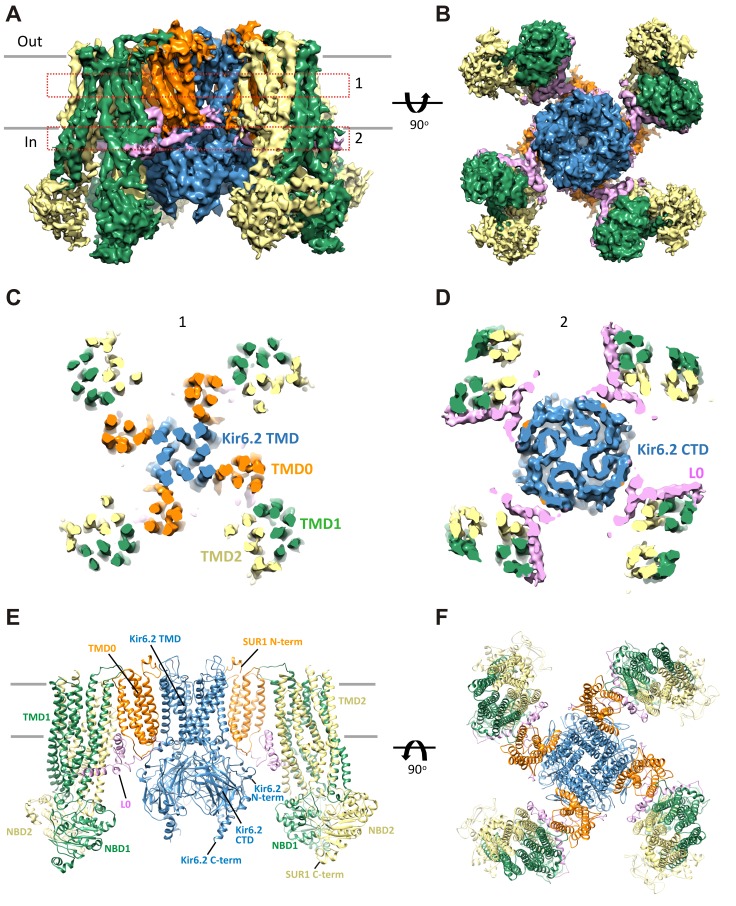
Figure 2.
Three-dimensional reconstruction of the K ATP channel.
( A ) Cryo-EM density map of the K ATP channel complex at an overall resolution of 5.8 u00c5, viewed from the side. The four Kir6.2 subunits in the center are colored blue, SUR1 is in orange (TMD0), l...
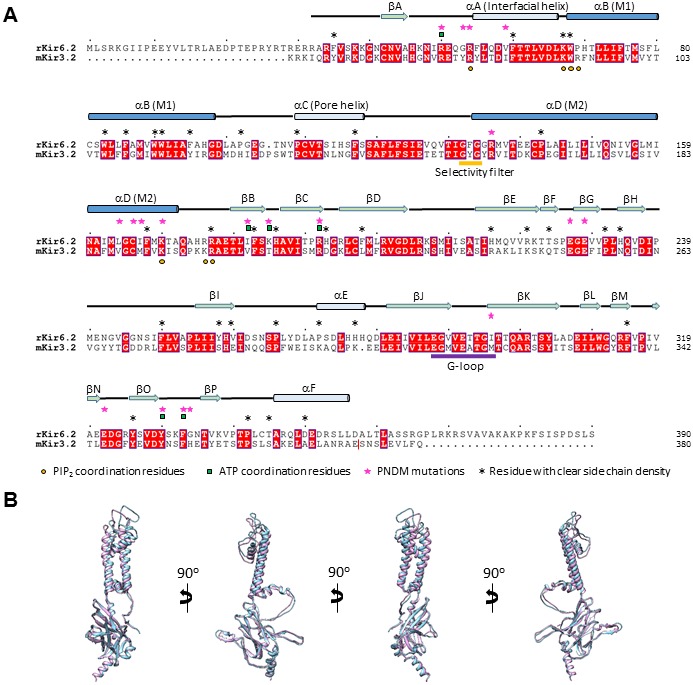
Figure 2u2014figure supplement 1.
Sequence and structure comparison between Kir6.2 and Kir3.2.
( A ) Sequence alignment of rat Kir6.2 and mouse Kir3.2. Only the Kir3.2 sequence that was used to solve the structure in the PIP 2 -bound state is shown (PDB ID: 3SYA; residue 380 in mouse Kir3.2 is ...
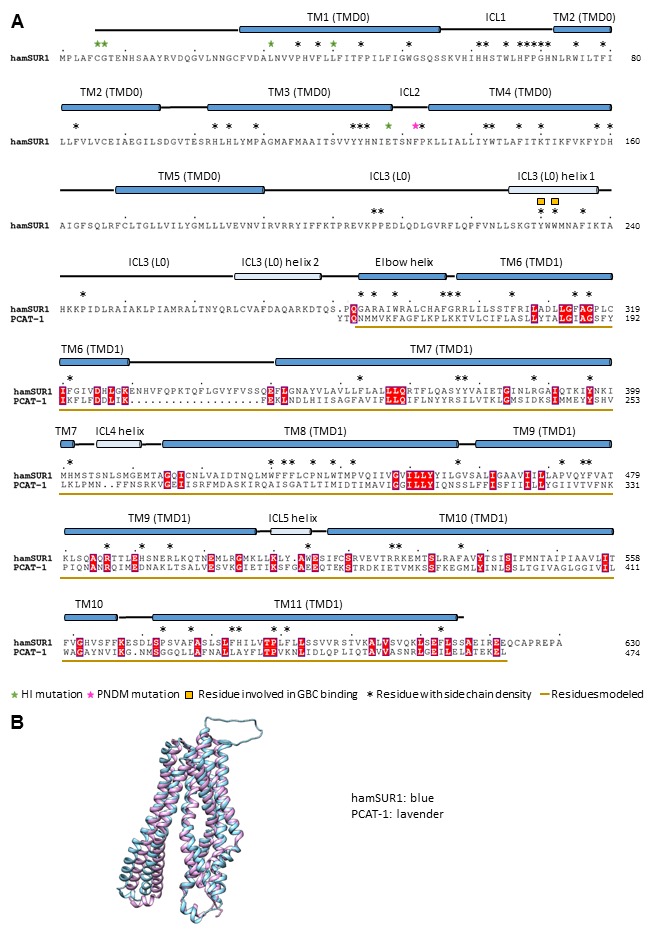
Figure 2u2014figure supplement 2.
Sequence alignment and structure comparison between SUR1 TMD1 and a bacterial peptidase-containing ABC transporter PCAT-1 (PDB ID: 4RY2).
The structure 4RY2 of PCAT-1 was used for homology modeling of SUR1 TMD1 (a.a. 284u2013616). ( A ) Alignment of the hamster SUR1 sequence from 1u00a0tou00a0624 and the sequence of PCAT-1 in the crysta...
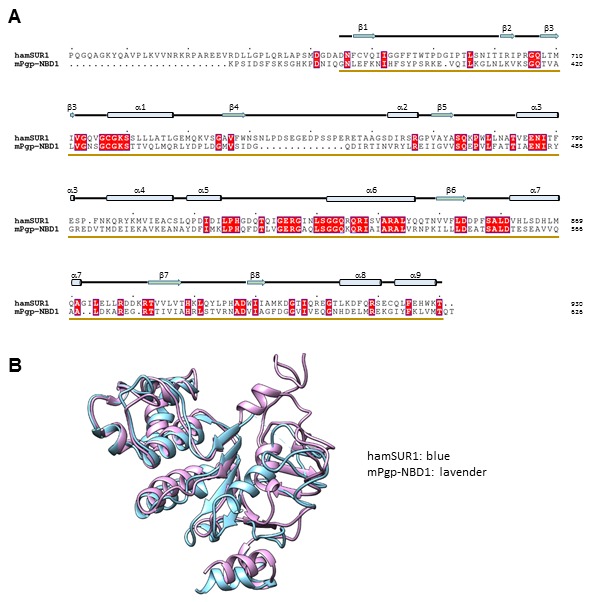
Figure 2u2014figure supplement 3.
Sequence alignment and structure comparison between SUR1 NBD1 and the mouse P-glycoprotein NBD1 (PDB ID: 4MLM).
The NBD1 structure of the mouse P-glycoprotein (mPgp; PDB ID: 4MLM) was used for homology modeling of SUR1 NBD1. ( A ) Alignment of the hamster SUR1 sequence from 631u2013930 and the sequence of mPgp ...
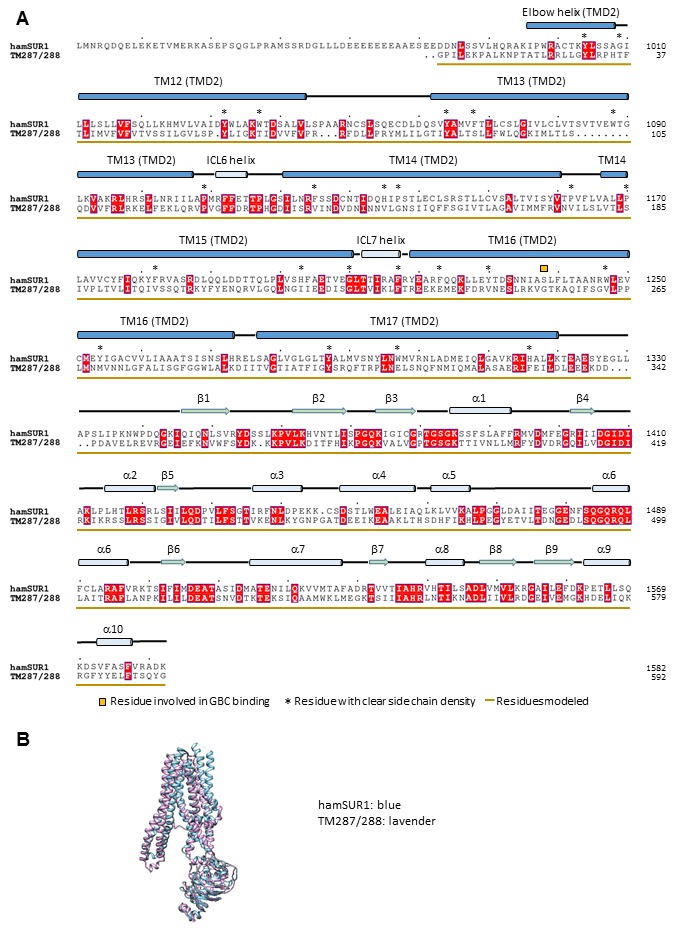
Figure 2u2014figure supplement 4.
Sequence alignment and structure comparison between SUR1 TMD2-NBD2 and a bacterial ABC exporter TM287/288 (PDB ID: 4Q4H).
The structure 4Q4H of TM287/288 was used for homology modeling of SUR1 TMD2-NBD2. ( A ) Alignment of the hamster SUR1 sequence from 961u00a0tou00a01982 and the sequence of TM287/288 in the crystal str...
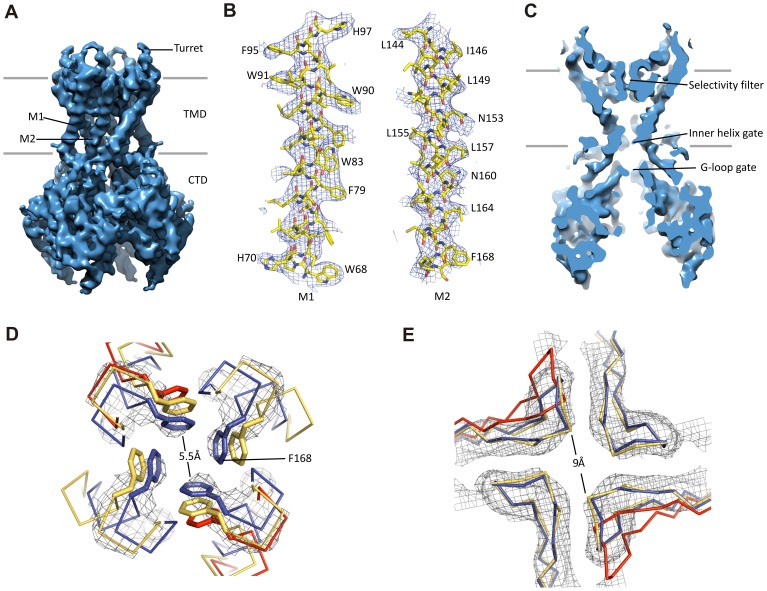
Figure 3.
Kir6.2 in a closed conformation.
( A ) Cryo-EM density map of Kir6.2 at 5.1 u00c5 resolution. ( B ) Density of M1 and M2. Residues with clear side chain density are labeled. ( C ) A central slice through the density highlighting the ...
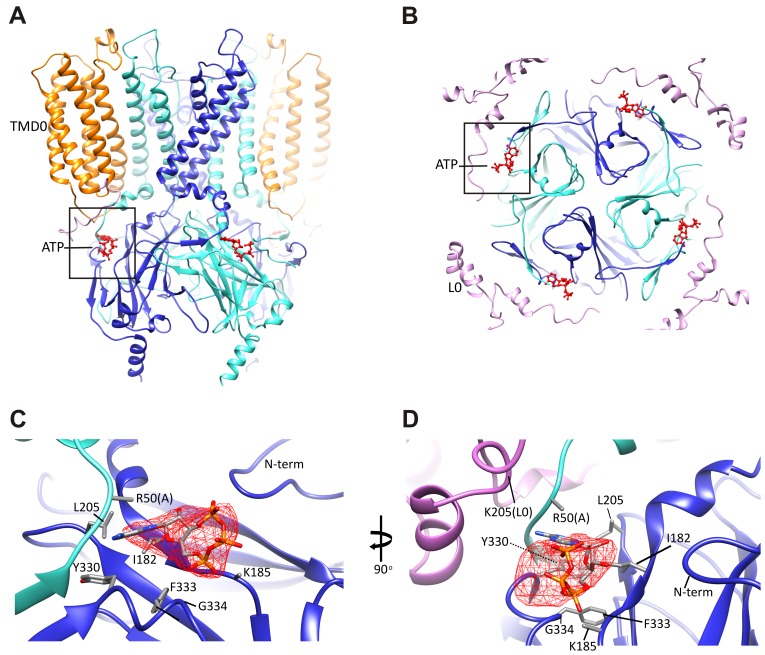
Figure 4.
The ATP binding pocket.
( A and B ) Overview of ATP site from the side and from the top. ( C and D ) Difference map calculated from model prior to ATP docking, contoured to 3u03c3. Residues surrounding the ATP density are la...
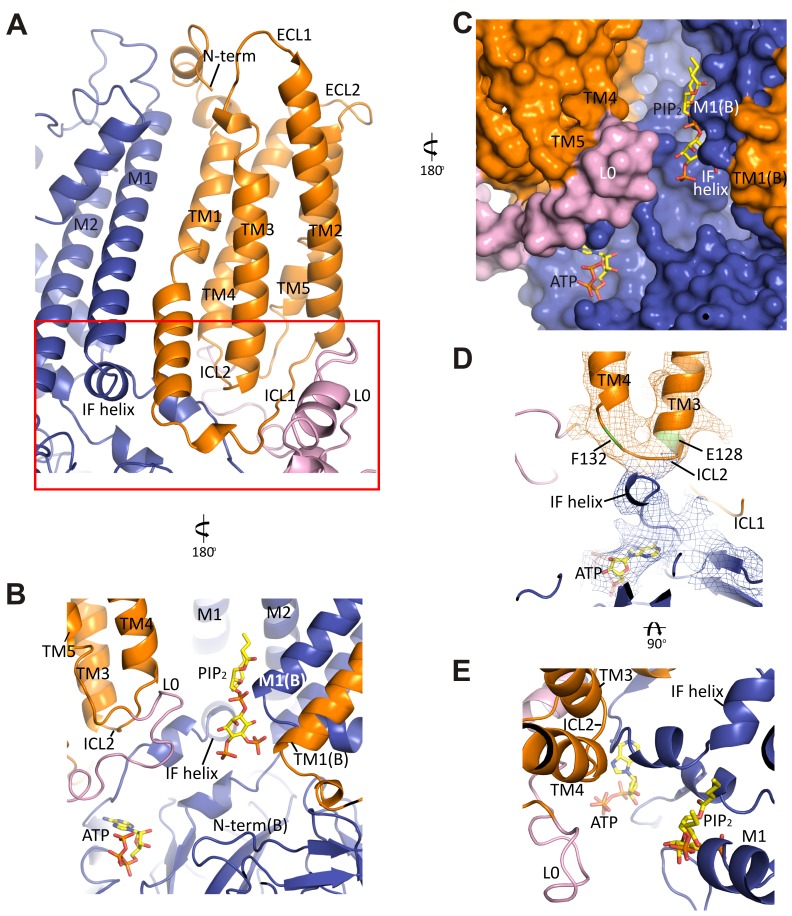
Figure 5.
The interface between TMD0 and the N-terminal segment of L0 with Kir6.2.
( A ) Overall structure of the interface region, with TMD0 in orange, Kir6.2 in blue, and L0 in lavender. ECL: extracellular loop; ICL: intracellular loop; IF helix: interfacial (slide) helix. ( B and...
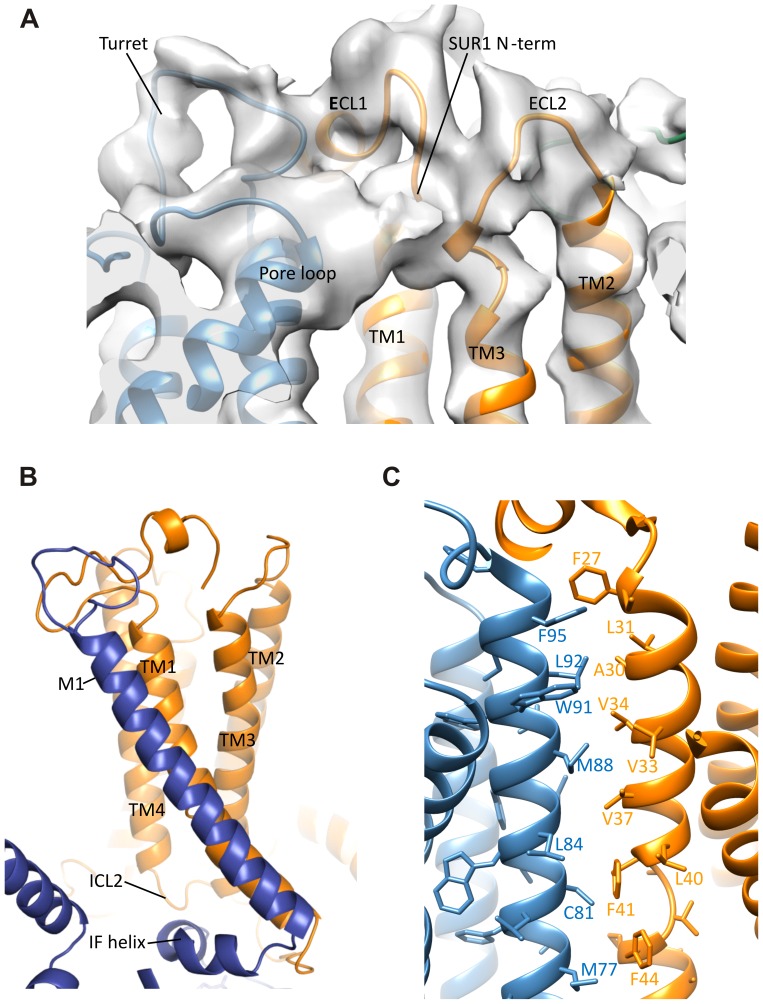
Figure 5u2014figure supplement 1.
Interactions between TMD0 and Kir6.2.
( A ) Interactions of SUR1 N-terminus with the pore loop and turret of Kir6.2. Note continuous density extending from the pore loop to the N-term/extracellular loop 2 (ECL2) and from the turret to the...
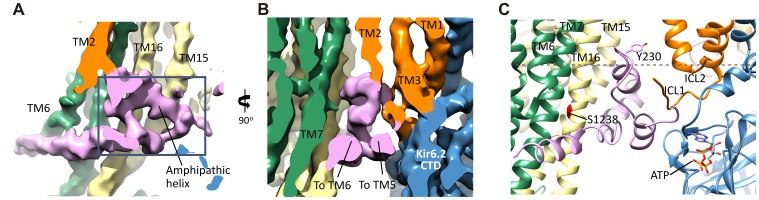
Figure 6.
The SUR1-L0 connecting TMD0/Kir6.2 with the SUR1-ABC core.
( A ) View of the L0 region from the side along the plane of the membrane; Kir6.2 density has been removed for clarity. The hairpin structure is outlined. ( B ) Slice through the N- and C-terminal seg...
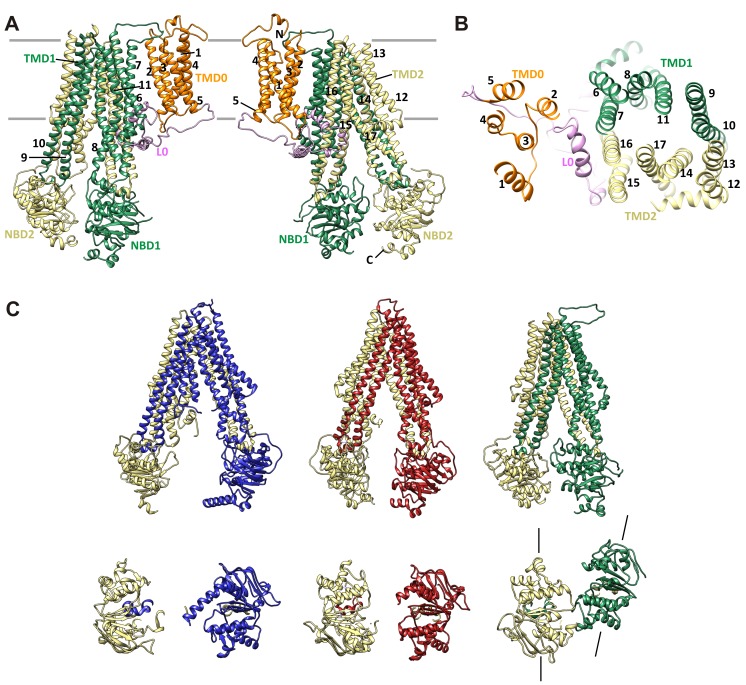
Figure 7.
SUR1 with a twisted ABC core conformation in saturating concentrations of GBC.
( A ) Model of SUR1 with the various domains colored as in Figure 1 , with each TM helix labeled. On the left, TMD1/NBD1 (green) is toward the front and TMD2/NBD2 (tan) is toward the back. ( B ) Cross...
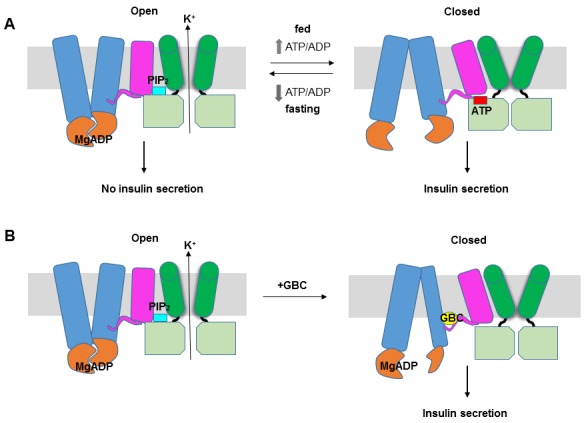
Figure 8.
K ATP channel gating model.
( A ) Cartoon illustrating how changes in the ATP/ADP ratio upon feeding and fasting alter the equilibrium between the inward-facing and outward-facing states of the SUR1-ABC core and interactions of ...
Figure images are served from the NIH/NLM PubMed Central Open Access Subset or Europe PMC; copyright remains with the publishers and authors.
💬 Discussion
0 commentsNo comments yet. Be the first to start a discussion!
Leave a Comment